

| Cardiology Research, ISSN 1923-2829 print, 1923-2837 online, Open Access |
| Article copyright, the authors; Journal compilation copyright, Cardiol Res and Elmer Press Inc |
| Journal website https://www.cardiologyres.org |
Original Article
Volume 14, Number 4, August 2023, pages 268-278

Comparing Left Atrial Low Voltage Areas in Sinus Rhythm and Atrial Fibrillation Using Novel Automated Voltage Analysis: A Pilot Study
James Manniona, Kathryn Honga, b, Sarah-Jane Lennona, Anthony Kennyc, Joseph Galvina, Jim O’Briena, Gael Jauverta, Edward Keelana, Usama Bolesa, d, e, f
aAtrial Fibrillation Institute (AFI) and Cardiovascular Research Institute (CVRI), Heart and Vascular Centre, Mater Private Hospital, Dublin, Ireland
bUCD School of Medicine, UCD Health Sciences Centre, University College Dublin, Bellfield, Dublin 4, Ireland
cBiosense Webster, Johnson & Johnson (Ireland) Limited, Tallaght, Dublin 24, Ireland
dDepartment of Cardiology, Arrhythmia Service, Tipperary University Hospital, Clonmel, E91 VY40, Ireland
eHeart and Vascular Centre, Mater Private Hospital, Dublin 7, Ireland
fCorresponding Author: Usama Boles, Department of Cardiology, Arrhythmia Service, Tipperary University Hospital, Clonmel, E91 VY40, Ireland
Manuscript submitted April 5, 2023, accepted May 25, 2023, published online July 12, 2023
Short title: Comparing Left Atrial LVAs in SR and AF
doi: https://doi.org/10.14740/cr1503
| Abstract | ▴Top |
Background: Low voltage areas (LVAs) have been proposed as surrogate markers for left atrial (LA) scar. Correlation between voltages in sinus rhythm (SR) and atrial fibrillation (AF) have previously been measured via point-by-point analysis. We sought to compare LA voltage composition measured in SR to AF, utilizing a high-density automated voltage histogram analysis (VHA) tool in those undergoing pulmonary vein isolation (PVI) for persistent AF (PeAF).
Methods: We retrospectively analyzed patients with PeAF undergoing de novo PVI. Maps required ≥ 1,000 voltage points in each rhythm and had a standardized procedure (mapped in AF then remapped in SR post-PVI). We created six anatomical segments (AS) from each map: anterior, posterior, roof, floor, septal and lateral AS. These were analyzed by VHA, categorizing atrial LVAs into 10 voltage aliquots 0 - 0.5 mV. Data were analyzed using SPSS v.26.
Results: We acquired 58,342 voltage points (n = 10 patients, mean age: 67 ± 13 years, three females). LVA burdens of ≤ 0.2 mV, designated as “severe LVAs”, were comparable between most AS (except on the posterior wall) with good correlation. Mapped voltages between the ranges of 0.21 and 0.5 mV were labeled as “diseased LA tissue”, and these were found significantly more in AF than SR. Significant differences were seen on the roof, anterior, posterior, and lateral AS.
Conclusions: Diseased LA tissue (0.21 - 0.5 mV) burden is significantly higher in AF than SR, mainly in the anterior, roof, lateral, and posterior wall. LA “severe LVA” (≤ 0.2 mV) burden is comparable in both rhythms, except with respect to the posterior wall. Our findings suggest that mapping rhythm has less effect on the LA with voltages < 0.2 mV than 0.2 - 0.5 mV across all anatomical regions, excluding the posterior wall.
Keywords: Persistent atrial fibrillation; Left atrial low voltage area burden; Radiofrequency ablation; Voltage histogram analysis
| Introduction | ▴Top |
While the mainstay of symptomatic atrial fibrillation (AF) treatment is pulmonary vein isolation (PVI), non-pulmonary vein triggers arising from the posterior wall of the left atrial (LA) may alter conduction velocities and therefore, treatment efficacy. These so-called low voltage areas (LVAs) were identified via electro-anatomical voltage mapping correlate to scarred myocardium identified via cardiac magnetic resonance imaging (MRI) with late gadolinium enhancement (MRI-LGE) [1]. The burden of MRI-LGE enhanced area has an inverse relationship with LA endocardial voltage [2]. LVAs are usually identified as those measured via bipolar voltage (BiV) mapping in sinus rhythm (SR) with an intrinsic voltage ≤ 0.5 mV [3]. Previous reports have demonstrated that high LVA burden is clinically associated with increased recurrence of AF post-PVI compared to lower burden of LVAs. Therefore, these areas have prognostic significance as a marker of arrhythmia recurrence and may serve as an important therapeutic target for additional substrate modification, namely in patients with persistent AF (PeAF) [3-5].
LVAs differ in quantity and severity depending on the underlying rhythm [6, 7]. The characterization of LVAs in the left atrium during alternative rhythms has not been thoroughly evaluated. One cardinal study suggests a strong correlation (R = 0.707) between voltages in AF and SR when point-by-point analysis is utilized [8]. Other studies have also described a good correlation between mapped voltages in AF and SR [9, 10]. It is suggested however that there are regional variations to the concordance of mapped voltages between rhythms [10].
The voltage histogram analysis (VHA) tool is a novel offline software module (CARTO3, Biosense Webster) which allows for rapid voltage assessment and summary of the pre-selected regions of the fast anatomical map (FAM) by tabulating the selected area into pre-set voltage categories [5, 9]. VHA has been validated in the assessment of LA LVAs, demonstrating superiority to visual assessment [9]. Indeed, data suggest that automated LA voltage assessment reduces inter-operator variability [9]. Moreover, the automated VHA software allows for analysis of entire regions or walls of LA, cumulating hundreds of points data simultaneously, as opposed to previous studies performed using point-by-point analysis.
In the current study, we utilize automated VHA (high voltage point density) endocardial assessment to generate high-density maps for voltage analysis and compared maps in AF and SR in selected patients. We will then correlate the data to LA anatomical distribution to assess for LA regional variations in perceived LVAs.
| Materials and Methods | ▴Top |
Study population
We retrospectively analyzed medical records of those who underwent de novo PVI at the Mater Private Hospital, Dublin, from the January 2018 to December 2020. Patients with symptomatic, non-valvular PeAF, who were refractory to at least one antiarrhythmic agent in addition to cardioversion were selected for the study. All patients signed an informed consent before collection of any data.
We included consecutive patients with at least 1,000 voltage points taken in both SR and AF. Patients were excluded if they had undergone a prior catheter ablation of any type, were less than 18 years old, or had a procedure sequence that differed from our approved procedure protocol. Patients were excluded if they underwent additional substrate modification during their de novo PVI, including lesion sets performed in addition to PVI.
A standard 3-day protocol without antiarrhythmic therapy was applied to all patients prior to ablation.
The study protocol was reviewed and approved by the Mater Misericordiae University Hospital Clinical Research Ethics Committee in accordance with the Declaration of Helsinki (Institutional Review Board reference number: 1/378/2219 TMR). All procedures were performed by a single operator.
Uniform procedure workflow
The procedure and catheterization lab flow were standardized using right femoral vein to gain access under general anesthesia followed by a transseptal puncture under transesophageal echocardiography guidance (Vivid S70N, GE Healthcare). Direct oral anticoagulation was held on the day of the procedure. The atrium was first mapped in AF with a 7-French, deflectable D-curve multi-electrode mapping catheter, comprising 22 electrodes distributed over five splines with 4 - 4 - 4 mm spacing (PENTARAY, Biosense Webster, J & J Medical NV/SA, Belgium).
Our mapping catheter splines were held in place until stable and clear electrograms were achieved and accepted by our system (CONFIDENSE, Biosense Webster, J & J Medical NV/SA, Belgium) while mapping in AF to optimize accuracy and provide a true voltage point value. The full details of the procedural workflow have been described in a previous study [10].
After AF mapping, PVI was performed with bilateral wide antral circumferential ablation (WACA) lines. Patients were subsequently remapped in SR mapping after completion of the ablation. The endpoint of the procedure was exit and entrance block across the WACA line 20 min after the ablation was performed.
LA anatomical segments (AS) configuration
High density electro-anatomical maps in AF and SR were segmented into six anatomical zones to allow for regional analysis. These AS comprised the anterior, posterior, roof, floor, septal and lateral wall segments (Fig. 1). These regions were further demarcated for detailed LA regional analysis [11], resulting in a total of 120 AS in 10 patients for mapping analysis in SR and AF.
 Click for large image | Figure 1. Left atrial AS. Demonstration of left atrial AS boarders with example of each anatomical region in place during analysis via VHA. (a) Anterior AS. (b) Roof AS. (c) Floor AS. (d) Posterior AS. (e) Septal AS. (f) Lateral AS. AS: anatomical segment; VHA: voltage histogram analysis. |
The pulmonary veins, mitral annulus and transseptal puncture sites were demarcated at their ostia and then removed from the FAM to allow for more accurate voltage analysis of healthy tissue.
Voltage analysis using automated VHA
LA-AS voltage analyses were performed offline using automated VHA. VHA software analyzed the AS by identifying the square area of the map that fell under each pre-selected voltage category, 0.01 - 0.5 mV. This was achieved by assessing the value of each voltage point attained and assigning the same value to the surrounding endocardium of a pre-selected distance. For our study, we assigned a 1 mm2 distance or radius from the voltage point to be assigned with the value of the voltage point. Results were compiled before being displayed to the operator [4, 10].
All anatomical regions were divided into 10 micro-voltage aliquots for VHA analysis, between 0.01 mV and 0.5 mV. These ranges were 0.01 - 0.05 mV, 0.06 - 0.11 mV, 0.12 - 0.16 mV, 0.16 - 0.20 mV, 0.21 - 0.25 mV, 0.26 - 0.30 mV, 0.31 - 0.35 mV, 0.36 - 0.41 mV, 0.41 - 0.45 mV, and 0.46 - 0.5 mV. Voltage ≤ 0.5 mV was considered LVA, which was further sub-categorized as “severe LVAs” for those ≤ 0.2 mV and areas between 0.21 - 0.5 mV “diseased LA tissue”.
This was followed by analysis of individual segments in both AF and SR. All patient maps were analyzed in this way, and the output categorized under each voltage range was recorded.
Statistical analysis
Statistical analyses were conducted with IBM SPSS Statistics Version 26 (IBM Corp, New York, USA). The Shapiro-Wilk test of normality was performed to assess for normality of distribution. The Student’s t-test or Wilcoxon signed ranks test were performed as appropriate. Continuous variables are reported as mean ± one standard deviation.
Spearman’s Rho correlation coefficient was performed to assess for correlation between continuous variables. Two-tailed P values of < 0.05 were considered statistically significant.
| Results | ▴Top |
Patient characteristics
Ten patients met inclusion criteria. Baseline demographics for all patients are summarized in Table 1. The mean age of the study cohort was 63 ± 13 years. All patients had PeAF that was treated with at least one antiarrhythmic medication and had previous synchronized direct current cardioversion (DCCV).
 Click to view | Table 1. Baseline Patient Characteristics |
Automated VHA in AF and SR
The LA was subjected to electro-anatomical voltage mapping in both rhythms for all patients. For our analysis, 58,342 total points during SR and AF were analyzed via VHA (Fig. 2). We then performed statistical analyses on the VHA outputs. There was no significant difference in mean measured LA endocardial area between SR and AF (12,119 ± 1,725 mm2 in SR vs. 13,557 ± 1,748 mm2 in AF; P = 0.13).
 Click for large image | Figure 2. Breakdown of data. Map diagram demonstrating number of patients and breakdown of data points. All combined maps comprised 58,342 voltage points split among 10 patients. Each patient had two maps, one in SR and one in AF. These maps were divided into six AS, giving us 12 AS per patient and 120 in total. Each AS was divided into 10 voltage aliquots between 0 and 0.5 mV, giving us 1,200 voltage aliquots/data points for comparison. LVA: low voltage area; SR: sinus rhythm; AF: atrial fibrillation; AS: anatomical segment. |
Mean LA area values ≤ 0.5 mV
The total regional burden of LVAs (≤ 0.5 mV) across all anatomical regions, was compared between AF and SR. Significant differences were observed between rhythms in every AS. The most significant inter-rhythmic difference in this voltage category was noted on the posterior wall, which demonstrated a mean area of 204.01 ± 172.56 mm2 in AF compared to 123.82 ± 132.66 mm2 in SR, P ≤ 0.001. This was followed by the lateral wall (AF = 118.46 ± 112.14 mm2; SR = 80.71 ± 72.47 mm2, P = 0.003), anterior wall (AF = 183.13 ± 171.53 mm2; SR = 147.85 ± 131.77 mm2, P ≤ 0.001), roof (AF = 123.84 ± 106.48 mm2; SR = 102.09 ± 96.02 mm2, P ≤ 0.001), floor (AF = 133.29 ± 128.11 mm2; SR = 112.61 ± 107.5 mm2, P = 0.003) and finally septal wall (AF = 98.88 ± 87.88 mm2; SR = 91.87 ± 72.47 mm2, P = 0.001).
Total severe LVA burden
A relatively complex LVA distribution was noted amongst the study cohort. The mean severe LVAs burden as a total of the entire LA was 13.7±8.9% when mapped in AF vs. 11±9% when mapped in SR; P = 0.29. When quantifying all LVAs ≤ 0.5 mV mapped as a proportion of the entire LA, we found a highly significant difference between both rhythms (41.7±18.9% of the LA demonstrated a voltage ≤ 0.5 mV in AF when compared to 25.5±15.7% in SR; P = 0.004).
Analysis of “severe LVAs” (≤ 0.2 mv)
This group contained the values of the four voltage aliquots listed in section “Voltage analysis using automated VHA” whose voltages were ≤ 0.2 mV. The total area with values consistent with severe low voltage was found to be comparable in AF and SR when measured as a mean across all AS, excluding the posterior wall (SR = 102.14 ± 157.47 mm2; AF = 159.03 ± 194.65 mm2; P = 0.02). This difference in the posterior region gave significance to the mean difference of all combined AS values (AF = 143.41 ± 144.23 mm2, SR = 115.89 ± 113.61 mm2, P = 0.02) (Table 2).
Click to view | Table 2. Low Voltage Area Burden |
Analysis of “diseased tissue” (0.21 - 0.5 mV)
This group contained the results of six voltage ranges previously listed in section “Voltage analysis using automated VHA” with voltages between 0.21 - 0.5 mV. When these voltage criteria were applied, we found highly significant differences between groups. First, there was a significant difference in diseased tissue when taken as a mean over all segments (AF = 144.00 ± 135.24 mm2; SR = 105.78 ± 103.7 mm2, P ≤ 0.0001). We once again found a significant difference on the posterior wall (AF = 234 ± 150.45 mm2; SR = 138.27 ± 112.3 mm2, P ≤ 0.0001), in addition to significant differences in readings consistent with diseased tissue noted in the anterior (AF = 220.87 ± 173.07 mm2; SR = 158.53 ± 99.22 mm2, P = 0.002), roof (AF = 150.61 ± 93.17 mm2; SR = 115 ± 77.14 mm2, P = 0.01) and lateral regions (AF = 137.05 ± 104.99 mm2; SR = 87.52 ± 66.82 mm2, P = 0.0002). We found a trend towards significance on the LA floor (AF = 151.2 ± 110.07 mm2; SR = 117.62 ± 85.41 mm2, P = 0.052) with no significant difference in the septal AS (Table 2).
Correlation coefficient of LVAs ≤ 0.5 mV between AF and SR
Voltage correlations between all 10 voltage aliquots in both rhythms were calculated via Spearman’s Rho correlation coefficient. Overall, the combined aliquots ≤ 0.5 mV demonstrated significant regional correlation in both AF and SR (Table 3). We found a significant difference in regional LVA across all AS, which demonstrated a combination of moderate strength (R = 0.4 - 0.59) correlations (roof: R = 0.404, P = < 0.001; posterior: R = 0.437, P ≤ 0.001) and weak strength (R = 0.2 - 0.39) correlations (lateral: R = 0.255, P = 0.025; septal: R = 0.344, P ≤ 0.001; floor, R = 0.291, P = 0.003; anterior, R = 0.367, P ≤ 0.001).
Click to view | Table 3. Low Voltage Areas (LVAs) Correlation Coefficients |
Correlation coefficient of “severe LVAs” (≤ 0.2 mV) between AF and SR
When our analysis focused on four aliquots with values consistent with severe LVAs (≤ 0.2 mV) compared to higher voltages, we found that the correlation coefficient was greater in every anatomical region. Areas of very low voltage had good, significant correlation between AF and SR (range of R = 0.395 - 0.555).
Correlation coefficient of “diseased tissue” (0.21 - 0.5 mV) between AF and SR
When assessing diseased LA (0.21 - 0.5 mV), a nonsignificant difference in inter-rhythmic variability was noted. The posterior wall demonstrated a weak yet significant correlation (R = 0.314, P = 0.015) with a trend towards weak correlation in the septal (R = 0.252, P = 0.052) and anterior region (R = 0.235, P = 0.071). No significant variability was demonstrated in any other region within this voltage category. A scatterplot comparison of all AS in the severe LVA category and diseased LA category can be seen in Figure 3.
 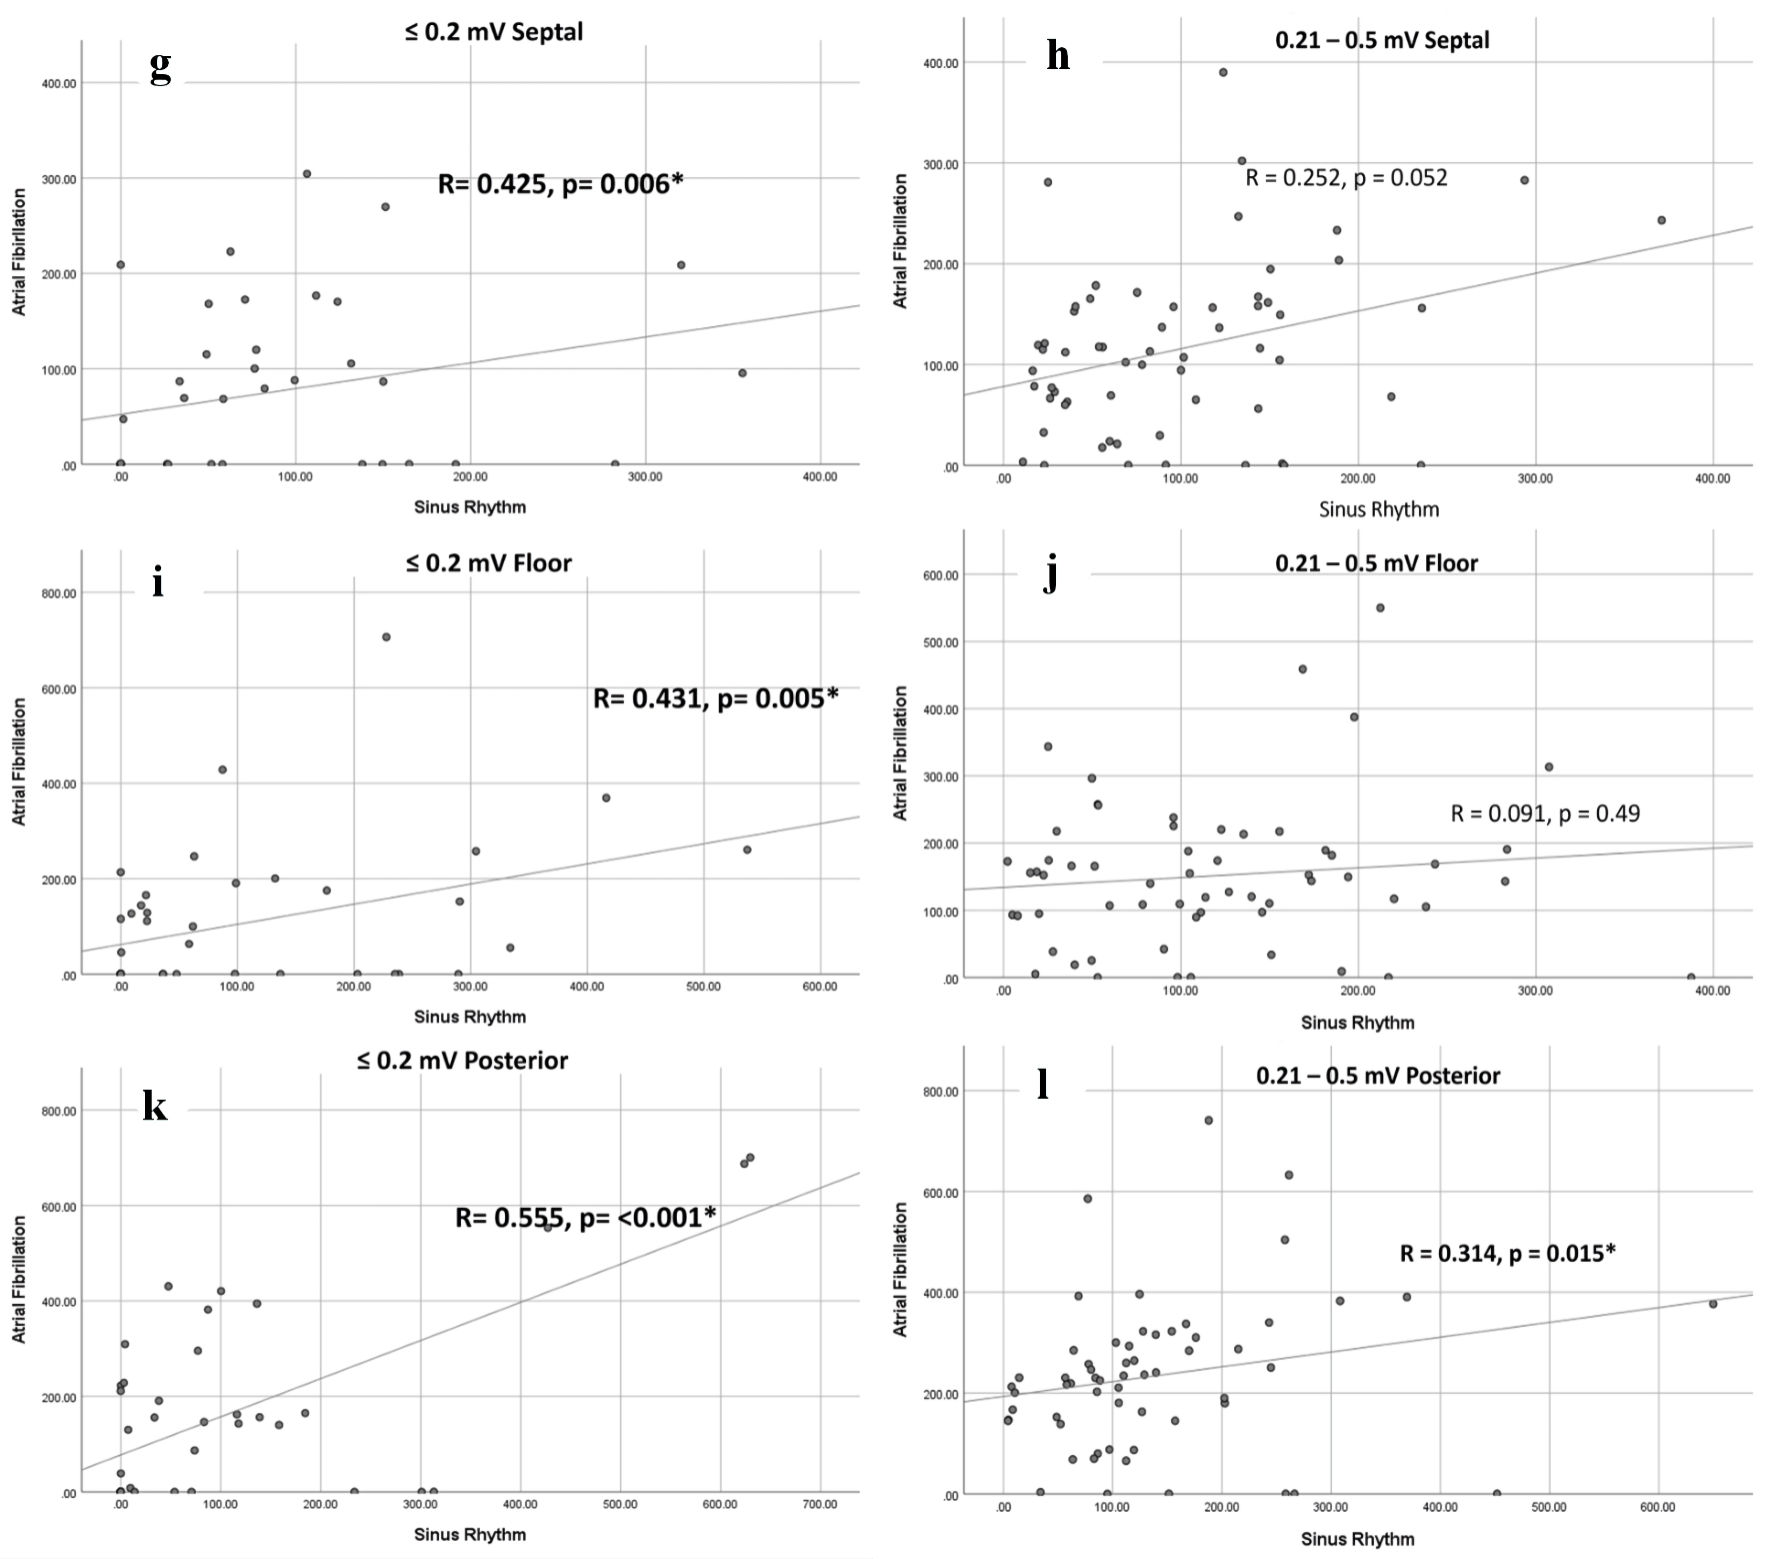 Click for large image | Figure 3. *Denotes significance. Correlation coefficient scatterplots. Scatterplots demonstrating correlation coefficients between rhythms at different ranges, ≤ 0.2 mV (group 1) and 0.21 - 0.5 mV (group 2). (a, b) Roof AS in group 1 and 2, respectively. (c, d) Lateral AS in group 1 and group 2, respectively. (e, f) Anterior AS in group 1 and 2, respectively. (g, h) Septal AS in group 1 and group 2, respectively. (i, j) Floor AS in group 1 and group 2, respectively. (k, l) Posterior AS in group 1 and 2, respectively. AS: anatomical segment. |
| Discussion | ▴Top |
Study findings
This study is in keeping with previous studies demonstrating an overall greater area of LA endocardium may be categorized as low voltage (≤ 0.5 mV) when measured in AF than in SR. Automated VHA permitted the characterization of high density and more detailed voltages in the left atrium, which allowed us to quantify rhythm variabilities across a wide spectrum of voltages (0.01 - 0.5 mV).
Mapping rhythm influenced all LVA ranges when analyzing voltage ranges from 0.21 to 0.5 mV (designated as “diseased LA tissue” in this study). Notably, there was a great disparity between readings with AF mapping yielding significantly more area of “diseased LA tissue”. In this range, there was no significant correlation between values obtained between AF and SR except on the posterior wall.
Comparatively, at voltage ranges ≤ 0.2 mV (termed “severe LVAs”), we found no significant difference in LVA burden in most segments when we compared maps in AF and SR, except for the posterior wall that demonstrated higher quantities of “severe LVAs” when mapped in AF. Our findings would suggest that “severe LVAs” identification, when mapped in either AF or SR, correlates well with anatomical location and has no significant difference with respect to total LVA burden, except for in the posterior wall.
While not clinically significant, we also found that the mean LA endocardial area differed between SR and AF by more than 10%. Given that atrial endocardial area is proportionately related to atrial volume and end diastolic pressure, we hypothesize that the return of a meaningful synchronized atrial contraction with SR reduced end diastolic pressure in the atrium acutely, thereby leading to a reduction in mapped volume.
Voltage correlation AF to SR
In our study we found a strong correlation between SR and AF at voltages consistent with “severe LVAs”, with no significant difference found in any area except the posterior wall [11]. However, a similar trend was not observed with respect to voltages of “diseased tissue”.
When “severe LVAs” were analyzed, the disparity between rhythms became statistically insignificant. Possible reasons for these findings include the presence of AF itself, which may have resulted in lower voltages from the fibrillatory wall; the association between faster AF cycle length and lower voltages obtained via BiV mapping [12]; as well as multiple depolarization wavefront collisions and a faster intrinsic rate attributable to AF. The latter may lead to zones of impaired functional conduction undergoing different stages of depolarization and repolarization. These features may increase the perceived burden of LVAs when measured in AF [13]. Other factors that are associated with an increased risk of AF and may have impacted on voltage include the presence of baseline characteristics, such as hyperthyroidism [14] and structural channelopathies [15], and lifestyle factors such as endurance sport and smoking [16]. The use of amiodarone, however, does not affect voltage [17]. Nonetheless, the stability of catheters, filters to non-physiologic electrogram (EGM), and data homogenization are advantages when using the VHA tool and hence, mitigate these considerations.
Voltage as a surrogate for scar identification
Our study hopes to aid understanding of how mapping rhythm and the electrophysiological conditions associated with AF influences the voltages obtained via BiV mapping. Currently BiV is used as a surrogate for LA scar identification although it has limitations. It has been shown to correlate well to LGE-MRI, which is the gold standard in identification of LA scar [18, 19], but there are other variables which may influence the voltage [20-22]. Much of the spectrum of scar creation is visible via LGE-MRI, this includes compact collagenous scar which is usually surrounded by various types of non-compact arrhythmogenic scar in a diffuse, patchy or interstitial distribution [23]. This level of qualitative scar analysis is not available with BiV but some understanding this may be borne out as we further understand the relationship between mapping rhythm and electrophysiological environment created by AF to voltages obtained.
Our study found a greater difference in voltage disparity between AF to SR which may explained in part by the fact that our entire cohort was entirely PeAF rather than paroxysmal AF like previous work by Yagishita et al, who included both PeAF and paroxysmal AF [8]. Similar findings of higher voltage readings in those with paroxysmal AF when compared to PeAF was also observed [8].
The progressive nature of AF is accompanied by widespread electrophysiological remodeling. Mapping LVAs in AF rather than SR may be more subjective to the presence of subtle functional electrophysiological remodeling of uncertain significance, including slowed conduction zones and multiple wavelet interaction points or re-entry points [20].
Anatomical distribution of severe LVAs outside of WACA lines
Some newer studies suggest that additional substrate modification of extra-pulmonary vein sites may result in longer freedom from disease in those with PeAF [24, 25]. Hence, we focused on the identification of severe LVAs outside of the PV antra.
We excluded the WACA anatomical areas from our study as patients underwent PVI with WACA lines only during their procedure and this would greatly offset the data in their second map. Similarly, it was found in previous literature that the PVs and PV antra had lowest voltages in AF compared to SR in those with paroxysmal or PeAF, hence the decision to exclude those area was to avoid surplus results [8].
Our study has found that the posterior wall demonstrated the greatest difference in measured voltages than any other anatomical region. This was not only evident in the “diseased tissue” category but also the “severe LVAs” voltage range. These findings are in keeping with a study by Benito et al, who found a propensity for scar tissue on the posterior wall as identified via LGE-MRI [26].
Posterior wall unique electrophysiology
Our cohort had a significant complex LVA distribution as outlined above. This may be a property of the endocardium when in the presence of more established scar to demonstrate comparatively lower voltages when mapped in AF compared to SR. Similarly, Yagishita et al [8] found that LA voltages show greater correlation between rhythms when measured in paroxysmal rather than more established AF.
Additionally, the posterior wall contains multiple mechanisms and properties that are unique compared to other atrial walls such as having a lower resting membrane potential, short action-potential duration, and refractory periods [9, 10].
In the posterior wall we find an assortment of heterogeneously juxtaposing muscle bundles, some of which encircle the pulmonary vein ostia, while others extend vertically, obliquely and laterally [10, 11].
The presence of these anisotropic bundles may result in functional block and variation of wavefront propagation, leading to slowed conduction between neighbouring fibres [12]. The voltage decompensation resulting from myocardial conditions created by AF (multi-directional wavelet propagation and faster cycle length) may be more potent on the posterior wall due to shorter action potential and refractory periods in addition to these juxtaposing muscle bundles [27-29].
Study novelty
The novelty of the current study is reflected by the study technique and clinically significant results which will serve to guide intraprocedural techniques. This manuscript utilized high density regional LA voltage analysis, allowing for much higher numbers of voltage points to be included in the data than previous studies [8]. This study results also focus on the burden of LA scar and LVAs between AF and SR on regional walls, rather than individual point voltage point correlation. This focus of results allows for more readily translatable findings into prognostication and decision making for electrophysiologists during ablation mapping. Finally, our data suggest that the posterior wall has unique electrophysiological characteristics that lead to a greater disparity in perceived LVA burden when mapped in AF than SR compared to other walls.
Limitations
This is a retrospective, offline voltage analysis in 10 patients with PeAF undergoing radiofrequency (RF) ablation at our center. With our limited cohort size, the high-quality and high-density data were innately more vulnerable to individual patient characteristics than a larger sample size would be. Furthermore, since SR mapping was performed after WACA ablation and DCCV, it remains unknown as to what extent the electrical remodeling induced by AF may alter the voltages obtained in the second SR map. As we utilized the PentaRay mapping catheter, these results may not necessarily be generalized to other mapping systems.
Given the fact that catheter contact force may influence voltage recordings, we ensured that electrodes were held in place with a consistent force for several seconds in each spot until clear stable electrograms were obtained. However, we also note that this may not entirely mitigate potential issues arising from the retrospective and offline nature of the analysis. We also confirm all attempts were made to homogenize the procedure protocol. This may overcome the retrospective and offline nature of the analysis as all other procedurals variables were fixed. Finally, we analyzed more than 57,000 points to empower the analysis and override any potential selection bias or other competing factors.
Conclusions
Overall, LVAs in AF were significantly greater than SR in the same atria. The “severe LVA” (≤ 0.2 mV) burden was similar between rhythms in most segments except the posterior wall, where it was significantly higher. There was overall good correlation of values between rhythms at very low voltage. Contrary to this, “diseased tissue” (0.21 - 0.5 mV) burden was significantly higher in AF than SR across all segments, and concomitantly these areas showed weaker or no correlation between rhythms suggesting a greater influence of atrial rhythm on mapping voltage results in this range.
Hence, the distribution of LVAs when measured in AF may be misleading or overestimated to different extents depending on whether voltages are ≤ 0.2 mV or 0.21 - 0.5 mV. Further larger prospective studies with regional voltage analysis are warranted to help guide clinical decision making.
Acknowledgments
We would like to acknowledge Biosense Webster, Johnson & Johnson for the provision of the VHA software tool to our institution.
Financial Disclosure
This was an investigator lead study with no funding support attained.
Conflict of Interest
No conflict of interest to report.
Informed Consent
Informed consent was obtained.
Author Contributions
Manuscript preparation, review and editing, GR and UB. All authors have read and agreed to the published version of the manuscript.
Data Availability
The authors declare that data supporting the findings of this study are available within the article.
| References | ▴Top |
- Badger TJ, Daccarett M, Akoum NW, Adjei-Poku YA, Burgon NS, Haslam TS, Kalvaitis S, et al. Evaluation of left atrial lesions after initial and repeat atrial fibrillation ablation: lessons learned from delayed-enhancement MRI in repeat ablation procedures. Circ Arrhythm Electrophysiol. 2010;3(3):249-259.
doi pubmed pmc - Caixal G, Alarcon F, Althoff TF, Nunez-Garcia M, Benito EM, Borras R, Perea RJ, et al. Accuracy of left atrial fibrosis detection with cardiac magnetic resonance: correlation of late gadolinium enhancement with endocardial voltage and conduction velocity. Europace. 2021;23(3):380-388.
doi pubmed - Masuda M, Fujita M, Iida O, Okamoto S, Ishihara T, Nanto K, Kanda T, et al. Left atrial low-voltage areas predict atrial fibrillation recurrence after catheter ablation in patients with paroxysmal atrial fibrillation. Int J Cardiol. 2018;257:97-101.
doi pubmed - Vlachos K, Efremidis M, Letsas KP, Bazoukis G, Martin R, Kalafateli M, Lioni L, et al. Low-voltage areas detected by high-density electroanatomical mapping predict recurrence after ablation for paroxysmal atrial fibrillation. J Cardiovasc Electrophysiol. 2017;28(12):1393-1402.
doi pubmed - Herczeg S, Walsh K, Keaney JJ, Keelan E, Travers J, Szeplaki G, Galvin J. Quantitative assessment of left atrial scar using high-density voltage mapping and a novel automated voltage analysis tool. J Interv Card Electrophysiol. 2020;59(1):5-12.
doi pubmed - Kapa S, Desjardins B, Callans DJ, Marchlinski FE, Dixit S. Contact electroanatomic mapping derived voltage criteria for characterizing left atrial scar in patients undergoing ablation for atrial fibrillation. J Cardiovasc Electrophysiol. 2014;25(10):1044-1052.
doi pubmed - Rodriguez-Manero M, Valderrabano M, Baluja A, Kreidieh O, Martinez-Sande JL, Garcia-Seara J, Saenen J, et al. Validating left atrial low voltage areas during atrial fibrillation and atrial flutter using multielectrode automated electroanatomic mapping. JACC Clin Electrophysiol. 2018;4(12):1541-1552.
doi pubmed - Yagishita A, S DEO, Cakulev I, Gimbel JR, Sparano D, Manyam H, Manrique-Garcia A, et al. Correlation of left atrial voltage distribution between sinus rhythm and atrial fibrillation: identifying structural remodeling by 3-D electroanatomic mapping irrespective of the rhythm. J Cardiovasc Electrophysiol. 2016;27(8):905-912.
doi pubmed - Nairn D, Lehrmann H, Muller-Edenborn B, Schuler S, Arentz T, Dossel O, Jadidi A, et al. Comparison of unipolar and bipolar voltage mapping for localization of left atrial arrhythmogenic substrate in patients with atrial fibrillation. Front Physiol. 2020;11:575846.
doi pubmed pmc - Nairn D, Eichenlaub M, Lehrmann H, et al. Spatial correlation of left atrial low voltage substrate in sinus rhythm versus atrial fibrillation: identifying the pathological substrate irrespective of the rhythm. medRxiv. 2022.
doi - Andres Lahuerta A, Roberto C, Saiz FJ, Cano O, Martinez-Mateu L, Alonso P, Sauri A, et al. Atrial low voltage areas: A comparison between atrial fibrillation and sinus rhythm. Cardiol J. 2022;29(2):252-262.
doi pubmed pmc - Kawaji T, Hojo S, Kushiyama A, Nakatsuma K, Kaneda K, Kato M, Yokomatsu T, et al. Optimal cutoff value of bipolar low-voltage in electroanatomic voltage mapping during atrial fibrillation rhythm. Pacing Clin Electrophysiol. 2019;42(6):663-669.
doi pubmed - Ndrepepa G, Schneider MA, Karch MR, Weber S, Schreieck J, Zrenner B, Schmitt C. Impact of atrial fibrillation on the voltage of bipolar signals acquired from the left and right atria. Pacing Clin Electrophysiol. 2003;26(4 Pt 1):862-869.
doi pubmed - Frost L, Vestergaard P, Mosekilde L. Hyperthyroidism and risk of atrial fibrillation or flutter: a population-based study. Arch Intern Med. 2004;164(15):1675-1678.
doi pubmed - Mascia G, Bona RD, Ameri P, Canepa M, Porto I, Parati G, Crotti L, et al. Brugada syndrome and syncope: a practical approach for diagnosis and treatment. Europace. 2021;23(7):996-1002.
doi pubmed - Mont L, Elosua R, Brugada J. Endurance sport practice as a risk factor for atrial fibrillation and atrial flutter. Europace. 2009;11(1):11-17.
doi pubmed pmc - Ikoma T, Naruse Y, Kaneko Y, Sakakibara T, Narumi T, Sano M, Mogi S, et al. Pre-procedural predictors of left atrial low-voltage zones in patients undergoing catheter ablation of atrial fibrillation. PLoS One. 2022;17(4):e0266939.
doi pubmed pmc - Anjo N, Nakahara S, Okumura Y, Hori Y, Nagashima K, Komatsu T, Hayashi A, et al. Impact of catheter tip-tissue contact on three-dimensional left atrial geometries: Relationship between the external structures and anatomic distortion of 3D fast anatomical mapping and high contact force guided images. Int J Cardiol. 2016;222:202-208.
doi pubmed - Nairn D, Nagel C, Mueller-Edenborn B, Lehrmann H, Jadidi A, Loewe A. [Abstr] Spatial and quantitative assessment of the correlation between sinus rhythm and atrial fibrillation voltage mapping to identify low voltage substrate in persistent atrial fibrillation. Europace. 2021;23(Supplement_3): euab116.163.
- Beheshti M, Magtibay K, Masse S, Porta-Sanchez A, Haldar S, Bhaskaran A, Nayyar S, et al. Determinants of atrial bipolar voltage: Inter electrode distance and wavefront angle. Comput Biol Med. 2018;102:449-457.
doi pubmed - Sasaki N, Okumura Y, Watanabe I, Sonoda K, Kogawa R, Takahashi K, Iso K, et al. Relations between contact force, bipolar voltage amplitude, and mapping point distance from the left atrial surfaces of 3D ultrasound- and merged 3D CT-derived images: Implication for atrial fibrillation mapping and ablation. Heart Rhythm. 2015;12(1):36-43.
doi pubmed - Park JH, Pak HN, Choi EJ, Jang JK, Kim SK, Choi DH, Choi JI, et al. The relationship between endocardial voltage and regional volume in electroanatomical remodeled left atria in patients with atrial fibrillation: comparison of three-dimensional computed tomographic images and voltage mapping. J Cardiovasc Electrophysiol. 2009;20(12):1349-1356.
doi pubmed - Nguyen TP, Qu Z, Weiss JN. Cardiac fibrosis and arrhythmogenesis: the road to repair is paved with perils. J Mol Cell Cardiol. 2014;70:83-91.
doi pubmed pmc - Inoue K, Hikoso S, Masuda M, Furukawa Y, Hirata A, Egami Y, Watanabe T, et al. Pulmonary vein isolation alone vs. more extensive ablation with defragmentation and linear ablation of persistent atrial fibrillation: the EARNEST-PVI trial. Europace. 2021;23(4):565-574.
doi pubmed - Della Rocca DG, Di Biase L, Mohanty S, Trivedi C, Gianni C, Romero J, Tarantino N, et al. Targeting non-pulmonary vein triggers in persistent atrial fibrillation: results from a prospective, multicentre, observational registry. Europace. 2021;23(12):1939-1949.
doi pubmed - Benito EM, Carlosena-Remirez A, Guasch E, Prat-Gonzalez S, Perea RJ, Figueras R, Borras R, et al. Left atrial fibrosis quantification by late gadolinium-enhanced magnetic resonance: a new method to standardize the thresholds for reproducibility. Europace. 2017;19(8):1272-1279.
doi pubmed - Kaba RA, Momin A, Camm J. Persistent atrial fibrillation: the role of left atrial posterior wall isolation and ablation strategies. J Clin Med. 2021;10(14):3129.
doi pubmed pmc - Suenari K, Chen YC, Kao YH, Cheng CC, Lin YK, Chen YJ, Chen SA. Discrepant electrophysiological characteristics and calcium homeostasis of left atrial anterior and posterior myocytes. Basic Res Cardiol. 2011;106(1):65-74.
doi pubmed - Scherlag BJ, Nakagawa H, Jackman WM, Yamanashi WS, Patterson E, Po S, Lazzara R. Electrical stimulation to identify neural elements on the heart: their role in atrial fibrillation. J Interv Card Electrophysiol. 2005;13(Suppl 1):37-42.
doi pubmed
This article is distributed under the terms of the Creative Commons Attribution Non-Commercial 4.0 International License, which permits unrestricted non-commercial use, distribution, and reproduction in any medium, provided the original work is properly cited.
Cardiology Research is published by Elmer Press Inc.