Cardiology Research, ISSN 1923-2829 print, 1923-2837 online, Open Access
Article copyright, the authors; Journal compilation copyright, Cardiol Res and Elmer Press Inc
Journal website https://www.cardiologyres.org

Original Article

Volume 14, Number 4, August 2023, pages 268-278


Comparing Left Atrial Low Voltage Areas in Sinus Rhythm and Atrial Fibrillation Using Novel Automated Voltage Analysis: A Pilot Study

Figures

Figure 1.
Figure 1. Left atrial AS. Demonstration of left atrial AS boarders with example of each anatomical region in place during analysis via VHA. (a) Anterior AS. (b) Roof AS. (c) Floor AS. (d) Posterior AS. (e) Septal AS. (f) Lateral AS. AS: anatomical segment; VHA: voltage histogram analysis.
Figure 2.
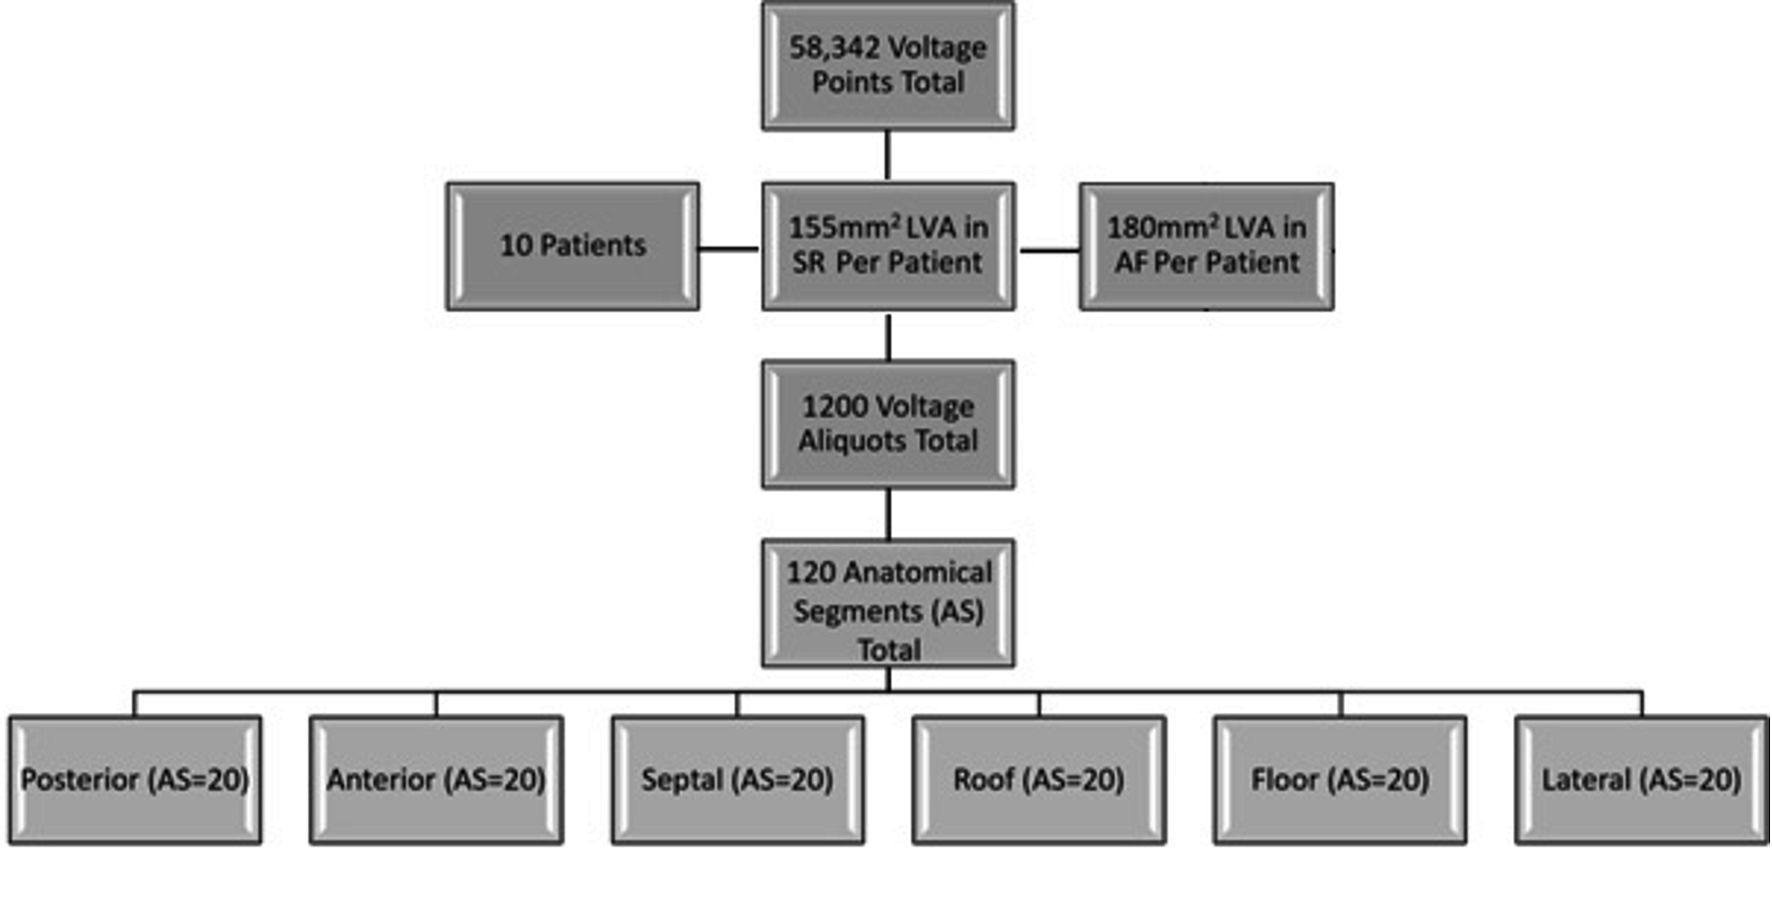
Figure 2. Breakdown of data. Map diagram demonstrating number of patients and breakdown of data points. All combined maps comprised 58,342 voltage points split among 10 patients. Each patient had two maps, one in SR and one in AF. These maps were divided into six AS, giving us 12 AS per patient and 120 in total. Each AS was divided into 10 voltage aliquots between 0 and 0.5 mV, giving us 1,200 voltage aliquots/data points for comparison. LVA: low voltage area; SR: sinus rhythm; AF: atrial fibrillation; AS: anatomical segment.
Figure 3. Figure 3.
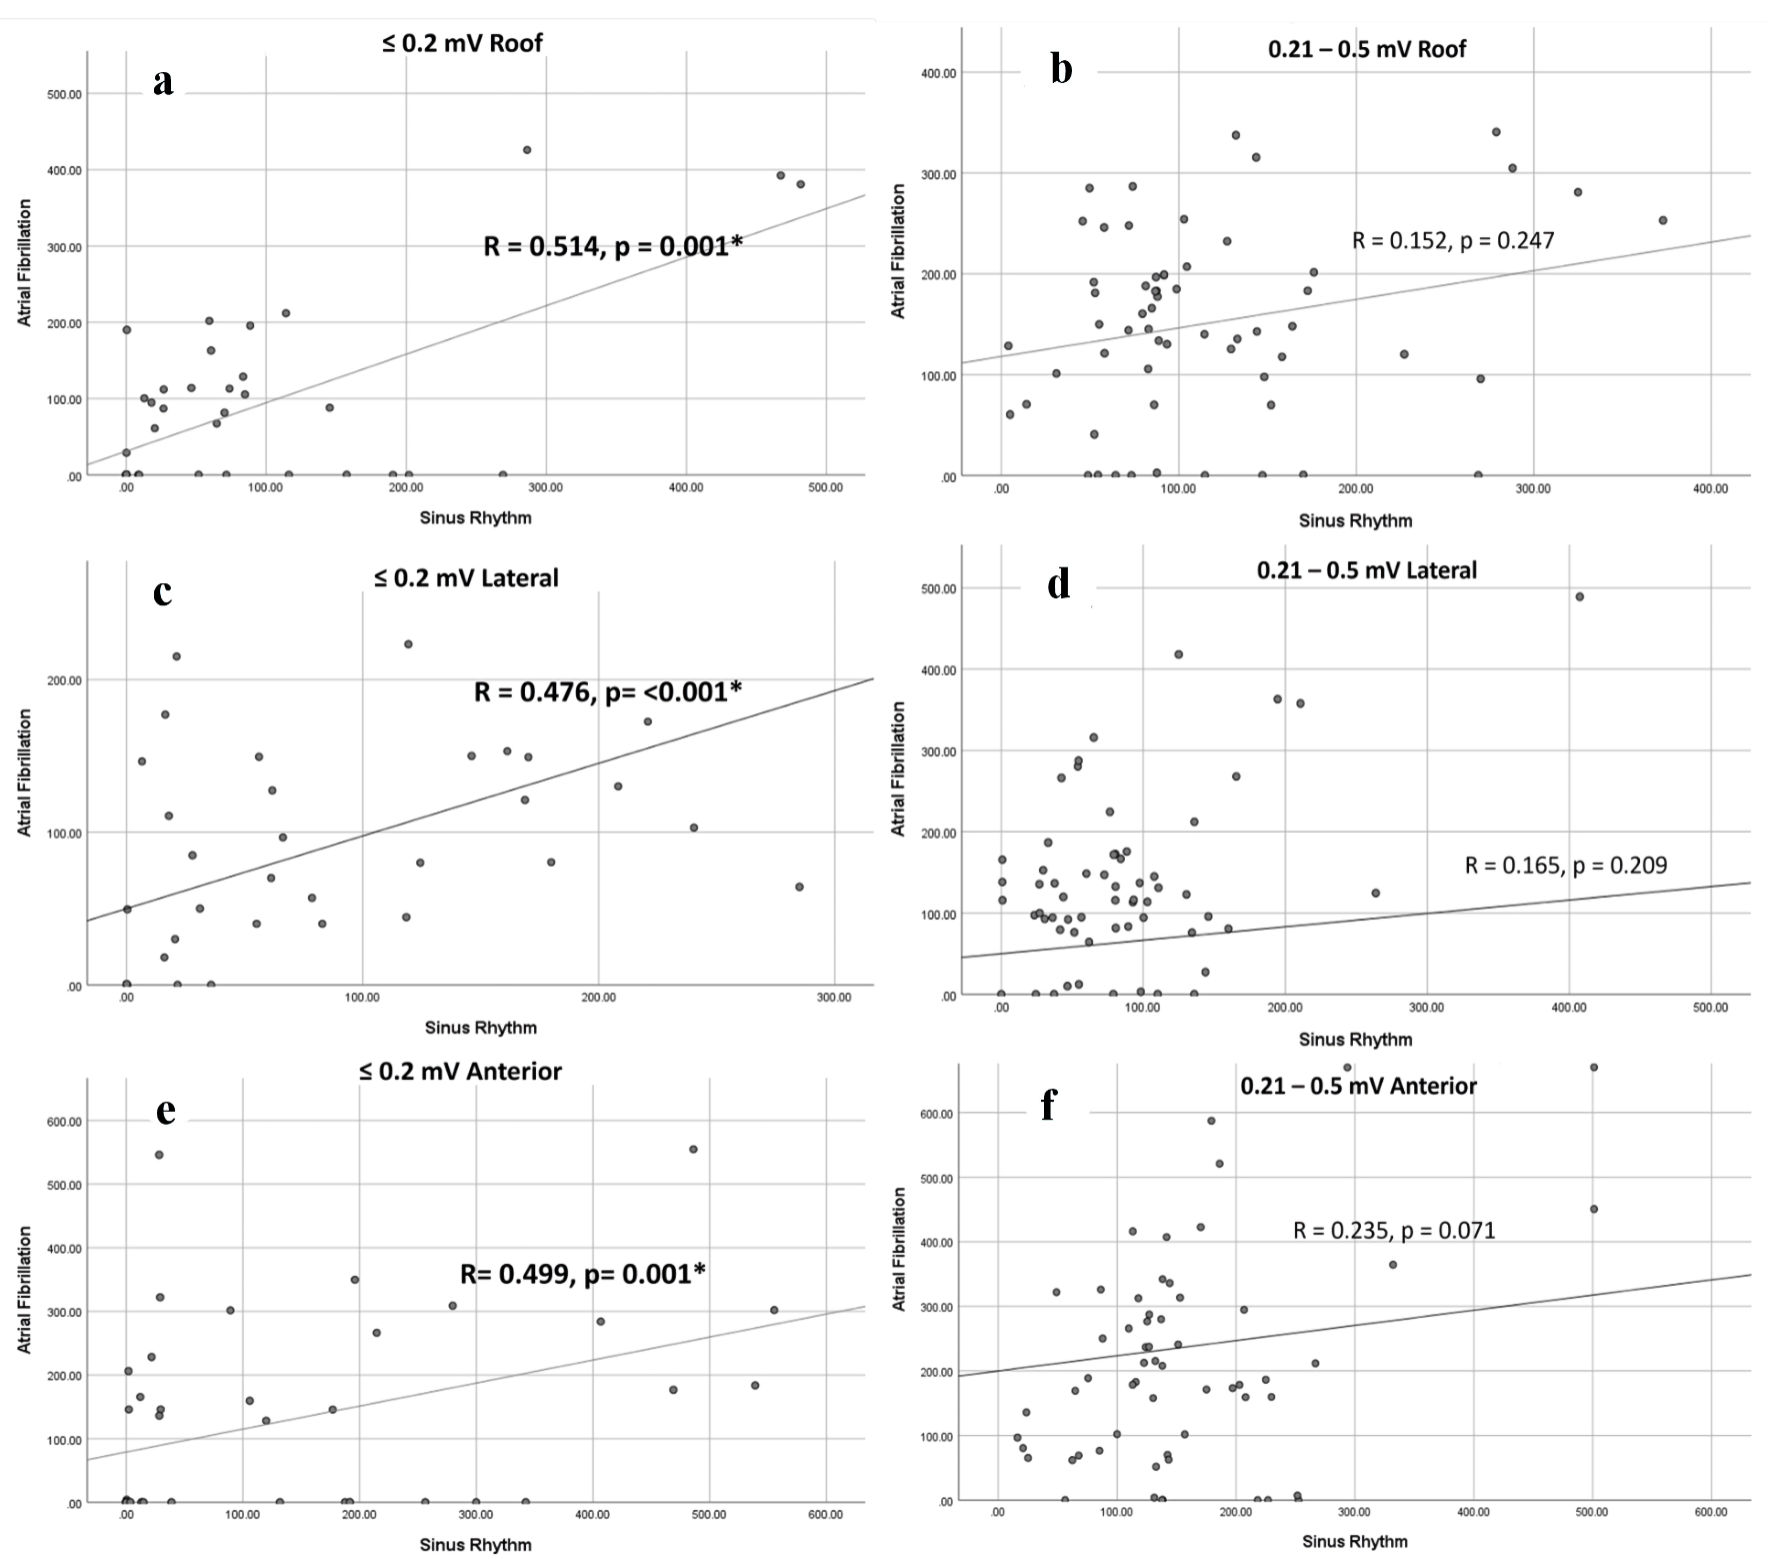
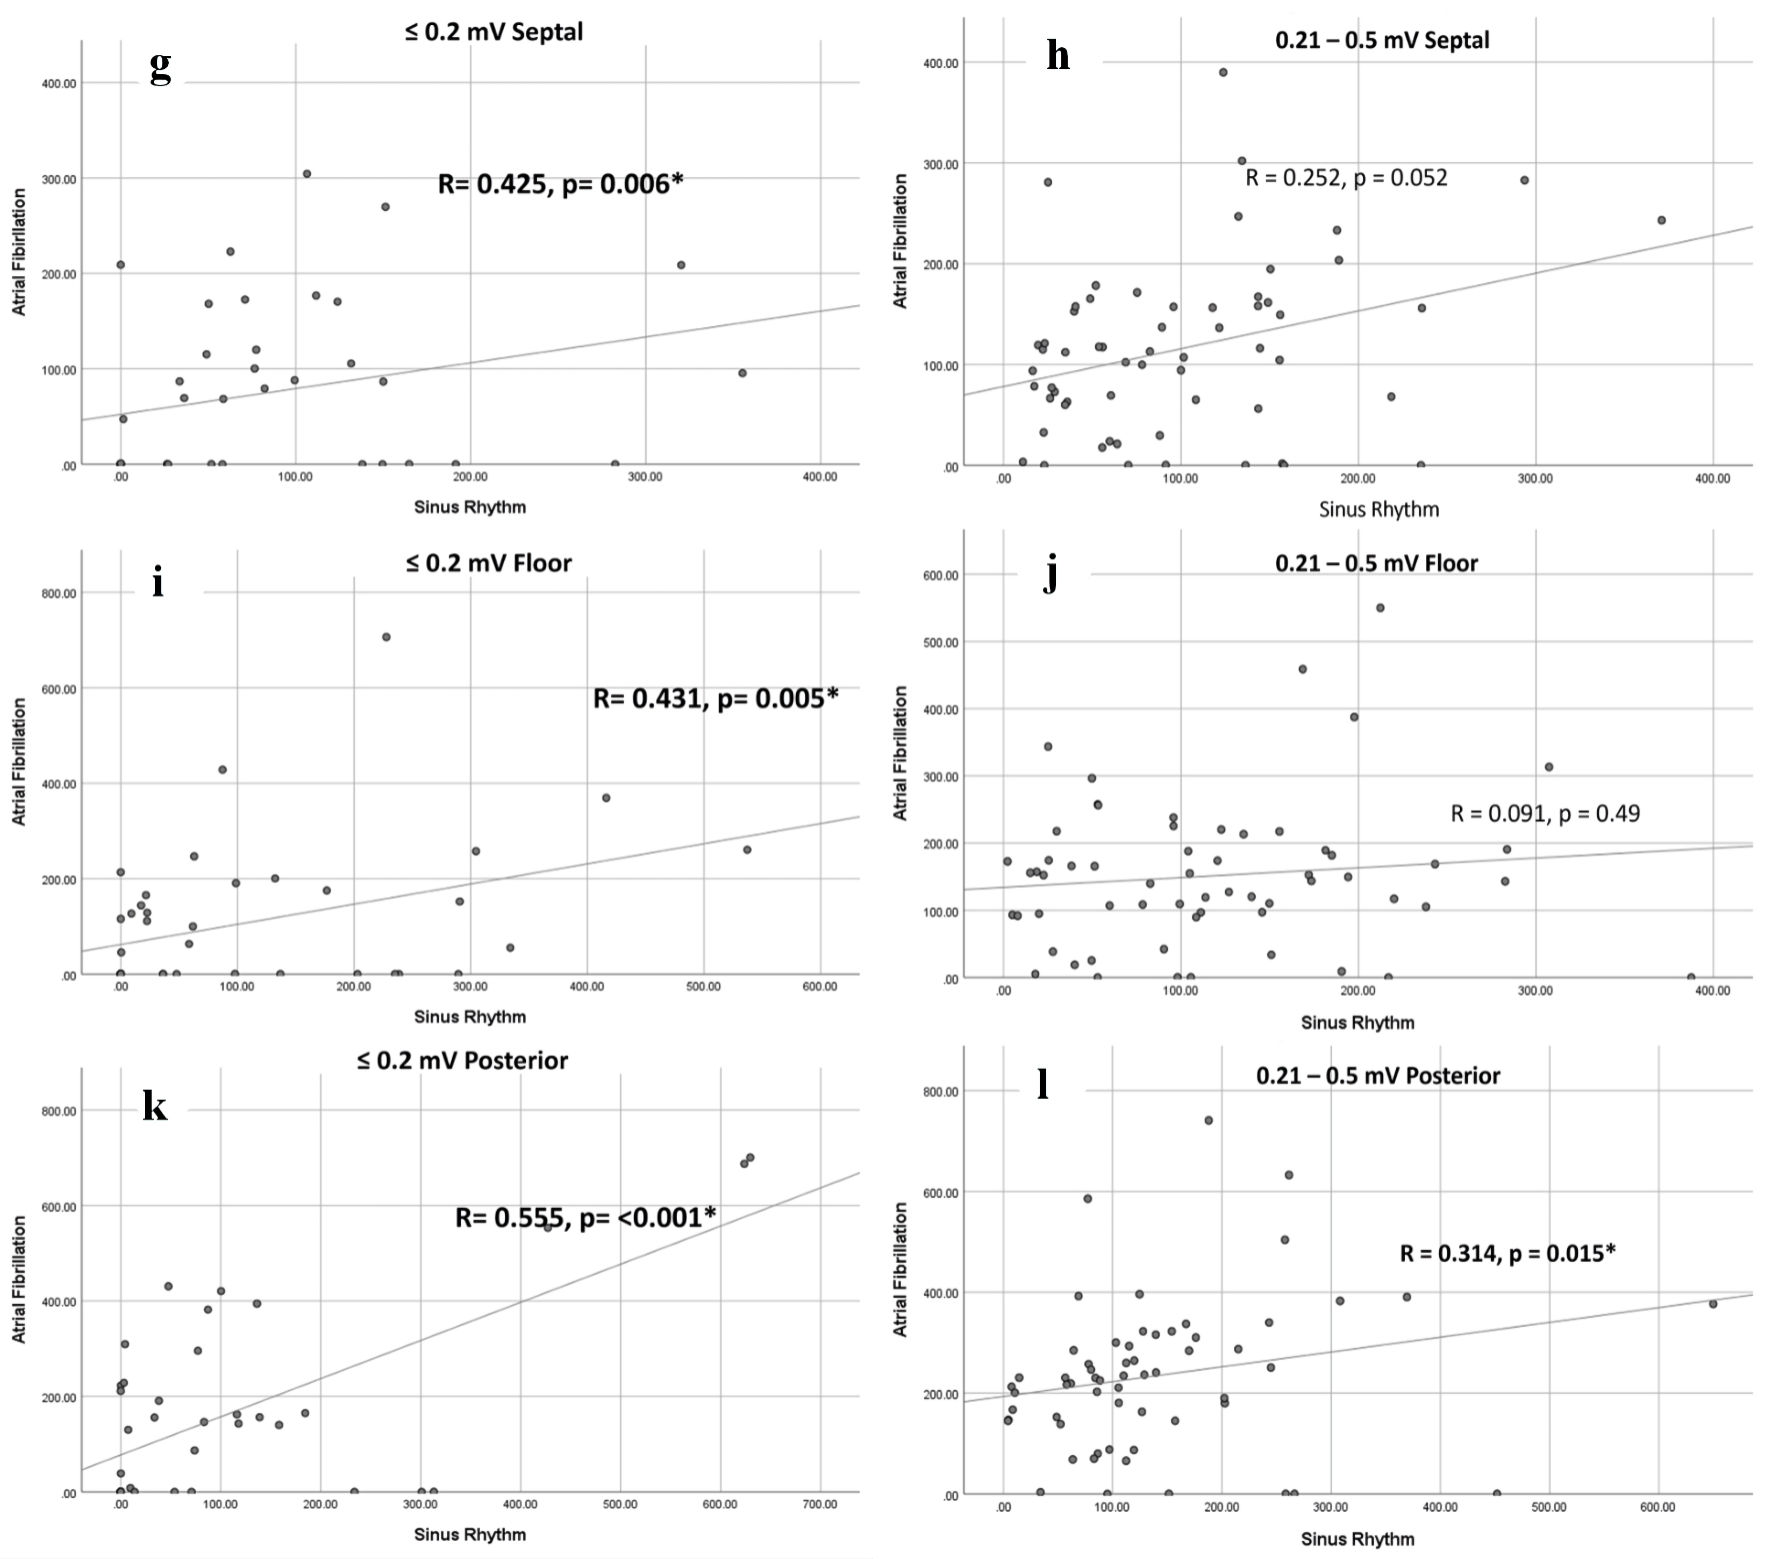
Figure 3. *Denotes significance. Correlation coefficient scatterplots. Scatterplots demonstrating correlation coefficients between rhythms at different ranges, ≤ 0.2 mV (group 1) and 0.21 - 0.5 mV (group 2). (a, b) Roof AS in group 1 and 2, respectively. (c, d) Lateral AS in group 1 and group 2, respectively. (e, f) Anterior AS in group 1 and 2, respectively. (g, h) Septal AS in group 1 and group 2, respectively. (i, j) Floor AS in group 1 and group 2, respectively. (k, l) Posterior AS in group 1 and 2, respectively. AS: anatomical segment.

Tables

Table 1. Baseline Patient Characteristics
 
Baseline characteristicsCohort
Values were described as percentage of total cohort or as mean ± SD. SD: standard deviation; AF: atrial fibrillation; IHD: ischemic heart disease; LVEF: left ventricular ejection fraction; DOAC: direct oral anticoagulant.
Male sex, n (%)7 (70%)
Age (years), mean ± SD61.7 ± 8.9
Persistent AF, n (%)10 (100%)
IHD, n (%)3 (30%)
CHA2DS2-VASc, mean ± SD1.6 ± 1.07
Hypertension, n (%)4 (40%)
Stroke, n (%)1 (10%)
Diabetes, n (%)1 (10%)
Dyslipidemia, n (%)2 (20%)
LVEF, mean ± SD47.3±4.67%
Beta-blocker, n (%)10 (100%)
DOAC, n (%)10 (100%)
Procedure time (min), mean ± SD108.8 ± 11.67
Voltage points, mean ± SD5,834.2 ± 1,108.7


Table 2. Low Voltage Area Burden
 
Voltage≤ 0.2 mV (mean area (mm2) ± SD)0.21 - 0.5 mV (mean area (mm2) ± SD)
RhythmSR (n = 40)AF (n = 40)P valueSR (n = 60)AF (n = 60)P value
*Denotes significance. Compares mean low voltage area between AF and SR for both dense scar (≤ 0.2 mV), and diseased LA tissue (0.21 - 0.5 mV). These values are compared across every anatomical segment. SD: standard deviation; SR: sinus rhythm; AF: atrial fibrillation; LA: left atrial.
Mean LA115.89 ± 113.61143.41 ± 144.230.02*105.78 ± 103.7144.00 ± 135.24< 0.001*
Roof82.72 ± 117.3283.68 ± 113.560.95115 ± 77.14150.61 ± 93.170.01*
Anterior131.8 ± 169.53126.5 ± 154.570.85158.53 ± 99.22220.87 ± 173.070.002*
Lateral70.5 ± 80.0073.36 ± 67.490.8187.52 ± 66.82137.05 ± 104.99< 0.001*
Septal80.99 ± 89.0374.16 ± 87.590.6899.123 ± 73.62115.37 ± 84.830.18
Floor105.1 ± 134.91106.42 ± 148.670.96117.62 ± 85.41151.2 ± 110.070.052
Posterior102.14 ± 157.47159.03 ± 194.650.02*138.27 ± 112.3234 ± 150.45< 0.001*


Table 3. Low Voltage Areas (LVAs) Correlation Coefficients
 
AS≤ 0.5 mVP value≤ 0.2 mVP value0.21 - 0.5 mVP value
*Denotes significance. Table demonstrating the correlation coefficient between LVAs identified in atrial fibrillation and sinus rhythm for all AS. Here we demonstrate values including coefficients for all LVAs, those consistent with dense scar (≤ 0.2 mV) and those consistent with diseased tissue (0.21 - 0.5 mV). AS: anatomical segment.
Roof0.404< 0.001*0.5140.001*0.1520.247
Lateral0.393< 0.001*0.476< 0.001*0.1650.209
Septal0.344< 0.001*0.4250.006*0.2520.052
Floor0.2910.003*0.4310.005*0.0910.49
Posterior0.437< 0.0001*0.555< 0.001*0.3140.015*
Anterior0.367< 0.001*0.4990.001*0.2350.071