

| Cardiology Research, ISSN 1923-2829 print, 1923-2837 online, Open Access |
| Article copyright, the authors; Journal compilation copyright, Cardiol Res and Elmer Press Inc |
| Journal website http://www.cardiologyres.org |
Original Article
Volume 7, Number 2, April 2016, pages 66-79
Low Density Lipoprotein and Non-Newtonian Oscillating Flow Biomechanical Parameters for Normal Human Aorta
Johannes V. Soulisa, c, d, Dimitrios K. Fytanidisa, c, Olga P. Lampria, c, George D. Giannogloub, c
aDepartment of Civil Engineering, Fluid Mechanics Division, School of Engineering, Demokrition University of Thrace, Vas. Sofias 12, 67100 Xanthi, Greece
bThe 1st Cardiology Department, Cardiovascular Engineering and Atherosclerosis Laboratory, AHEPA University Hospital, Medical School, Aristotle University of Thessaloniki, Thessaloniki, Kiriakidi 1, 54621 Thessaloniki, Greece
cThese authors contributed equally to this work.
dCorresponding Author: Johannes V. Soulis, Fluid Mechanics Division, Faculty of Engineering, Demokrition University of Thrace, Vas. Sofias 12, 67100 Xanthi, Greece
Manuscript accepted for publication April 20, 2016
Short title: Oscillating Viscosity Models and LDL in Aorta
doi: http://dx.doi.org/10.14740/cr467w
| Abstract | ▴Top |
Background: The temporal variation of the hemodynamic mechanical parameters during cardiac pulse wave is considered as an important atherogenic factor. Applying non-Newtonian blood molecular viscosity simulation is crucial for hemodynamic analysis. Understanding low density lipoprotein (LDL) distribution in relation to flow parameters will possibly spot the prone to atherosclerosis aorta regions.
Methods: The biomechanical parameters tested were averaged wall shear stress (AWSS), oscillatory shear index (OSI) and relative residence time (RRT) in relation to the LDL concentration. Four non-Newtonian molecular viscosity models and the Newtonian one were tested for the normal human aorta under oscillating flow. The analysis was performed via computational fluid dynamic.
Results: Tested viscosity blood flow models for the biomechanical parameters yield a consistent aorta pattern. High OSI and low AWSS develop at the concave aorta regions. This is most noticeable in downstream flow region of the left subclavian artery and at concave ascending aorta. Concave aorta regions exhibit high RRT and elevated LDL. For the concave aorta site, the peak LDL value is 35.0% higher than its entrance value. For the convex site, it is 18.0%. High LDL endothelium regions located at the aorta concave site are well predicted with high RRT.
Conclusions: We are in favor of using the non-Newtonian power law model for analysis. It satisfactorily approximates the molecular viscosity, WSS, OSI, RRT and LDL distribution. Concave regions are mostly prone to atherosclerosis. The flow biomechanical factor RRT is a relatively useful tool for identifying the localization of the atheromatic plaques of the normal human aorta.
Keywords: Relative residence time; Oscillatory shear index; Low density lipoprotein; Non-Newtonian models; Normal human aorta
| Introduction | ▴Top |
Increased molecular viscosity may be a cardiovascular risk factor [1]. Molecular viscosity is an important factor for development and progression of heart disease [2, 3]. According to non-Newtonian behavior, the molecular viscosity is velocity gradient-dependent. Its value varies along the course of the arterial vessels. There is a need to apply capable non-Newtonian models in order to capture the main flow characteristics at low strain rates [4]. Furthermore, little research has focused on the exact role of molecular viscosity at low strain rates under oscillating flows. In cases where either the flow slow or it is disturbed, the atherosclerosis shows preference to low wall shear stress (WSS) and/or its gradients [5]. The temporal variation during cardiac pulse wave has been proposed as an atherogenic factor [6]. Complex geometry vessels promote flow disturbances with low time-averaged WSS (AWSS) and high WSS temporal oscillations [6]. The oscillatory shear index (OSI) and the relative residence time (RRT), indicating the residence time molecules are in contact with endothelium, are promising tools for identifying regions of possible atherosclerosis localization [7].
Elevated low density lipoprotein (LDL) co-localized with atherosclerotic plaque development was reported [8]. The human aortic arch is highly complex geometry exposing high curvatures and the flow behavior requires extensive analyses. Elucidating the LDL site concentration under physiological oscillating flow is a step of paramount importance [8, 9]. The localization of atherosclerotic regions in the normal left coronary artery was reported [10]. A highly bend arterial vessel was numerically analyzed to elucidate the localization of atherosclerotic lesions under steady flow conditions [11]. Elevated LDL luminal surface did not co-locate to the sites of the lowest WSS.
Four non-Newtonian models, namely power law [12], Carreau [12], Casson [13], non-Newtonian power law [12] plus the Newtonian one are compared under oscillating flow conditions for the normal aorta. These models were previously analyzed under steady flow conditions [14]. Non-Newtonian flow models in human right coronary arteries were also examined [15]. To the best of our knowledge, little research has been done concerning the biomechanical parameters of molecular viscosity models, AWSS, OSI, and RRT in relation to the LDL distribution within the normal human aortic arch under oscillating flow. Furthermore, it is still unclear which of these factors best spot the prone to atheroma regions.
| Methods | ▴Top |
The normal human aortic arch centreline was generated using appropriate computer-aided design (CAD) software. The daughter vessels centerlines were generated and placed at the appropriate aortic arch centerline locations. Vessel cross-sections taken every 1.0 mm were set perpendicular to aorta and its daughter centerlines. The 3D geometry model is shown in Figure 1. The ascending aorta diameter at its entrance measured 3.477 cm, the descending aorta outlet was 3.076 cm, while the outlet diameters of the brachiocephalic artery, left common carotid artery and left subclavian artery segments were 1.435, 1.273, and 1.433 cm, respectively. The computational grid generator ANSYS Meshing (ANSYS Workbench 13) was utilized. The computational grid was created using tetrahedral for the main lumen volume and prismatic elements layers near endothelial wall in order to improve the accuracy and resolution of blood flow wall properties. Details of the sparse computational grid are shown in Figure 1. Mesh independence study was performed using 0.9, 1.5 and 2.0 million computational cells grids. The 1.5 million cells grid gave mesh independent solution for the examined parameters. An extended time period of five cardiac cycles was simulated in order to avoid period dependencies.
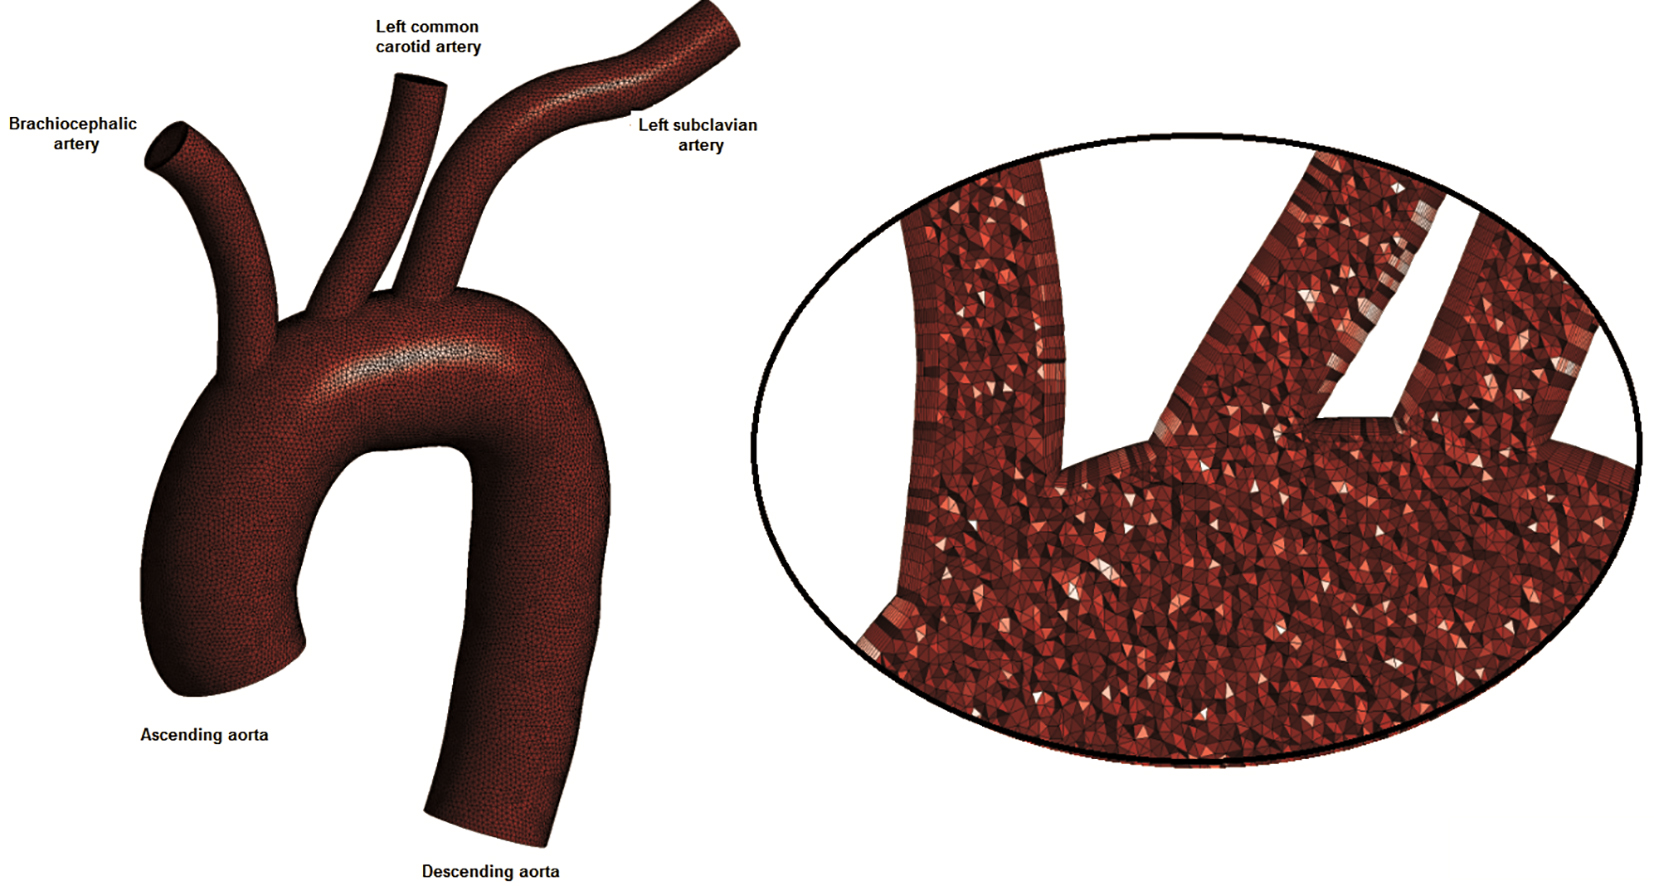 Click for large image | Figure 1. The computational model: ascending aorta, descending aorta, brachiocephalic artery, left common carotid artery and left subclavian artery. Sparse grid is shown. |
Five different blood viscosity models (the Newtonian and four non-Newtonian molecular viscosity models) were tested in the present study and are summarized in equations (a)-(e) of Figure 2.
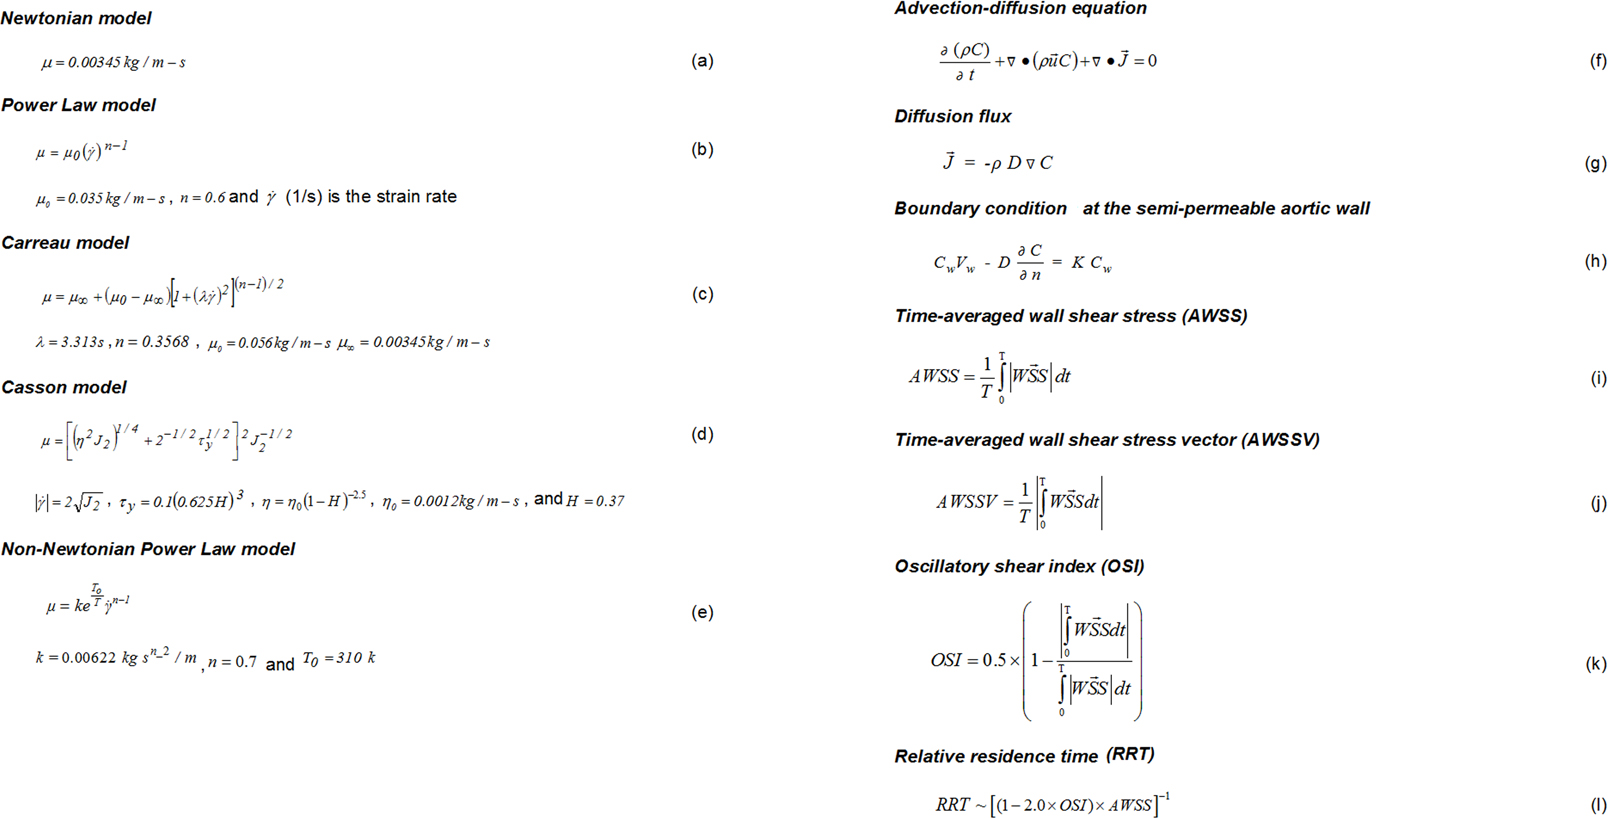 Click for large image | Figure 2. Summary of equations used in the present study. |
The numerical code Fluent solved the governing Navier-Stokes equations [10, 16]. The assumptions made about the flow were that it was 3D, unsteady, laminar, isothermal, with no external forces applied on it while the aortic arch wall was comprised of non-elastic and impermeable material. For the LDL solution problem, the flow equations were coupled with mass transport equation (semi-permeable walls) and solved under steady flow conditions. The convection-diffusion equation is presented in equation (f) of Figure 2, in which C mg/mL is the LDL concentration, and is the LDL diffusion flux, calculated using equation (g) of Figure 2.
In equation (f) and (g) (Fig. 2), D m2/s is the LDL diffusion coefficient. It was assumed the molecular diffusivity was 15.0 × 10⁻¹² m2/s [11, 17, 18]. The diffusivity was assumed isotropic throughout. Pulsatile inflow boundary condition was calculated using user-defined functions (UDFs) subroutines, written in ANSI C programming language. Convergence was achieved when all velocity component, mass and energy changes, from iteration to iteration, attained values less than 10-6.
Flow conditions
The inlet pulse wave is shown in Fig. 3, while the pulse period of this waveform is 800.0 ms. Blood outflow discharges were calculated using a slightly modified version of the Murray’s law. The power index value for the Murray’s law was set to 2.4.
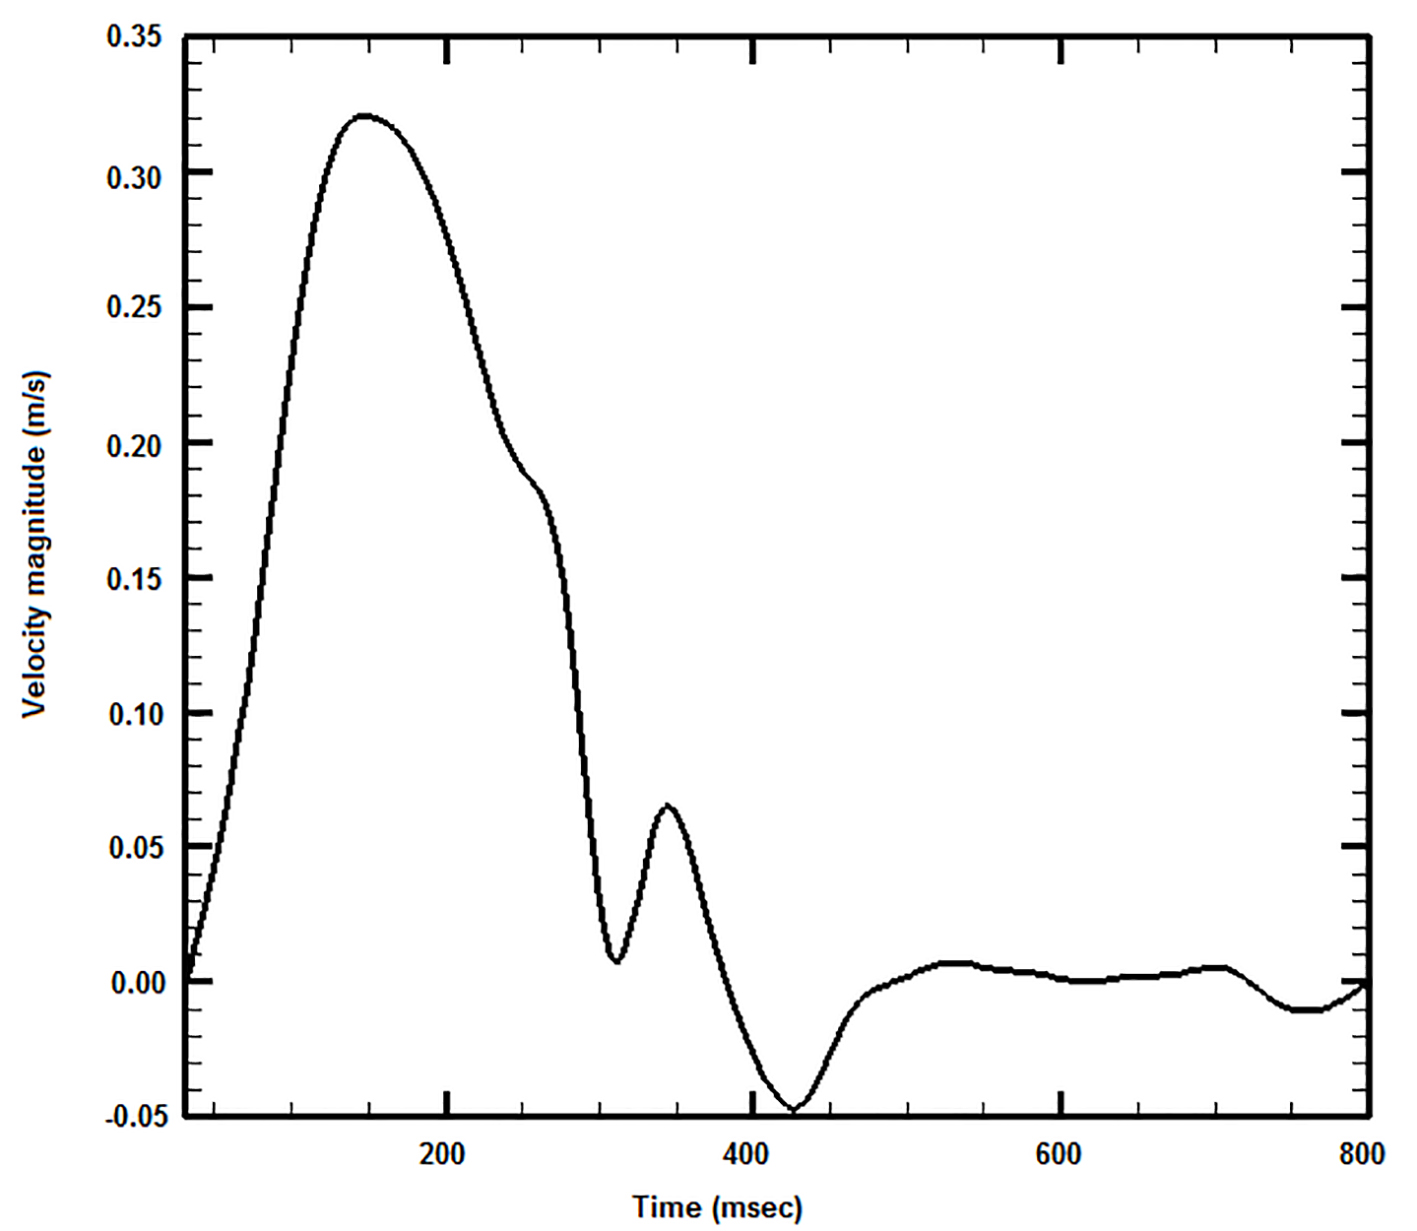 Click for large image | Figure 3. Applied blood waveform at the aortic arch inlet. |
Mass conditions
A uniform flow velocity of 0.05 m/s and constant concentration Co of LDL (1.3 mg/mL) were set at the ascending aorta orifice. At artery outlets, the gradient of LDL along the vessels was set equal to zero (Newmann condition). The boundary conditions can be described using equation (h) of Figure 2, where Cw mg/mL is the endothelial surface (wall) concentration, Vw is the infiltration velocity, and n is the direction normal to the wall. The condition described in equation (h) stated that the LDL (KCw) mass entering from endothelium to vessel walls was determined from the difference of mass carried to vessel by infiltration (CwVw) and the mass diffusing back to the main flow (D(∂C/∂n)) [10]. The infiltration velocity Vw was set to 0.6 × 10⁻⁸ m/s [19]. The endothelial permeability K was 2.0 × 10⁻¹⁰ m/s [10]. The components of the WSS possibly had different effects upon endothelial cells.
The AWSS (N/m2) is defined in equation (i) of Figure 2, where is the instantaneous WSS magnitude (N/m2) and T (s) is the pulse period. The averaged wall shear stress vector (AWSSV) (N/m2) is defined in equation (j) of Figure 2.
OSI calculated the differences between AWSS and AWSSV. OSI showed the WSS vector deflection from flow predominant direction during the cardiac cycle. Thus, OSI was calculated using equation (k) of Figure 2. The OSI values varied between 0.0 (for no cyclic variation of WSS vector) to 0.5 (for 180.0° deflection) of WSS direction. The OSI needed modification for capturing the atheromatic flow regions of low WSS and high OSI at the same site of the arterial system.
The RRT was calculated using equation (l) of Figure 2 [7]. The RRT parameter combined the effects of OSI and AWSS.
| Results | ▴Top |
All non-Newtonian models qualitatively predict similar behavior. However, these patterns differ in quantitative terms. The power law yields low molecular viscosity at low strain rates, considerably smaller than 0.00345 kg/m/s, widely accepted Newtonian molecular viscosity. In contrary, the Carreau and Casson law yield molecular viscosity higher to Newtonian law at all strain rates. At very low strain rates, the Carreau, Casson and the non-Newtonian power law models yield values approaching 0.010 kg/m/s. The Carreau and Casson law curves are very steep at the strain rate region less than 100.01/s. In the non-Newtonian power law, the steepness is relatively moderate.
AWSS (N/m2) contours are shown in Figure 4. Low AWSS values develop at the concave parts of the curved flow regions, most noticeable at the downstream flow region of the left subclavian artery as well as at the first quarter of the concave descending aorta. Increased AWSS develops at the convex part of the ascending aorta (very end of it) as well as at the first quarter of the convex part of the descending aorta. In between these two locations, the AWSS lowers its value, although these values are still higher than those at the opposite site of the aorta (concave site).
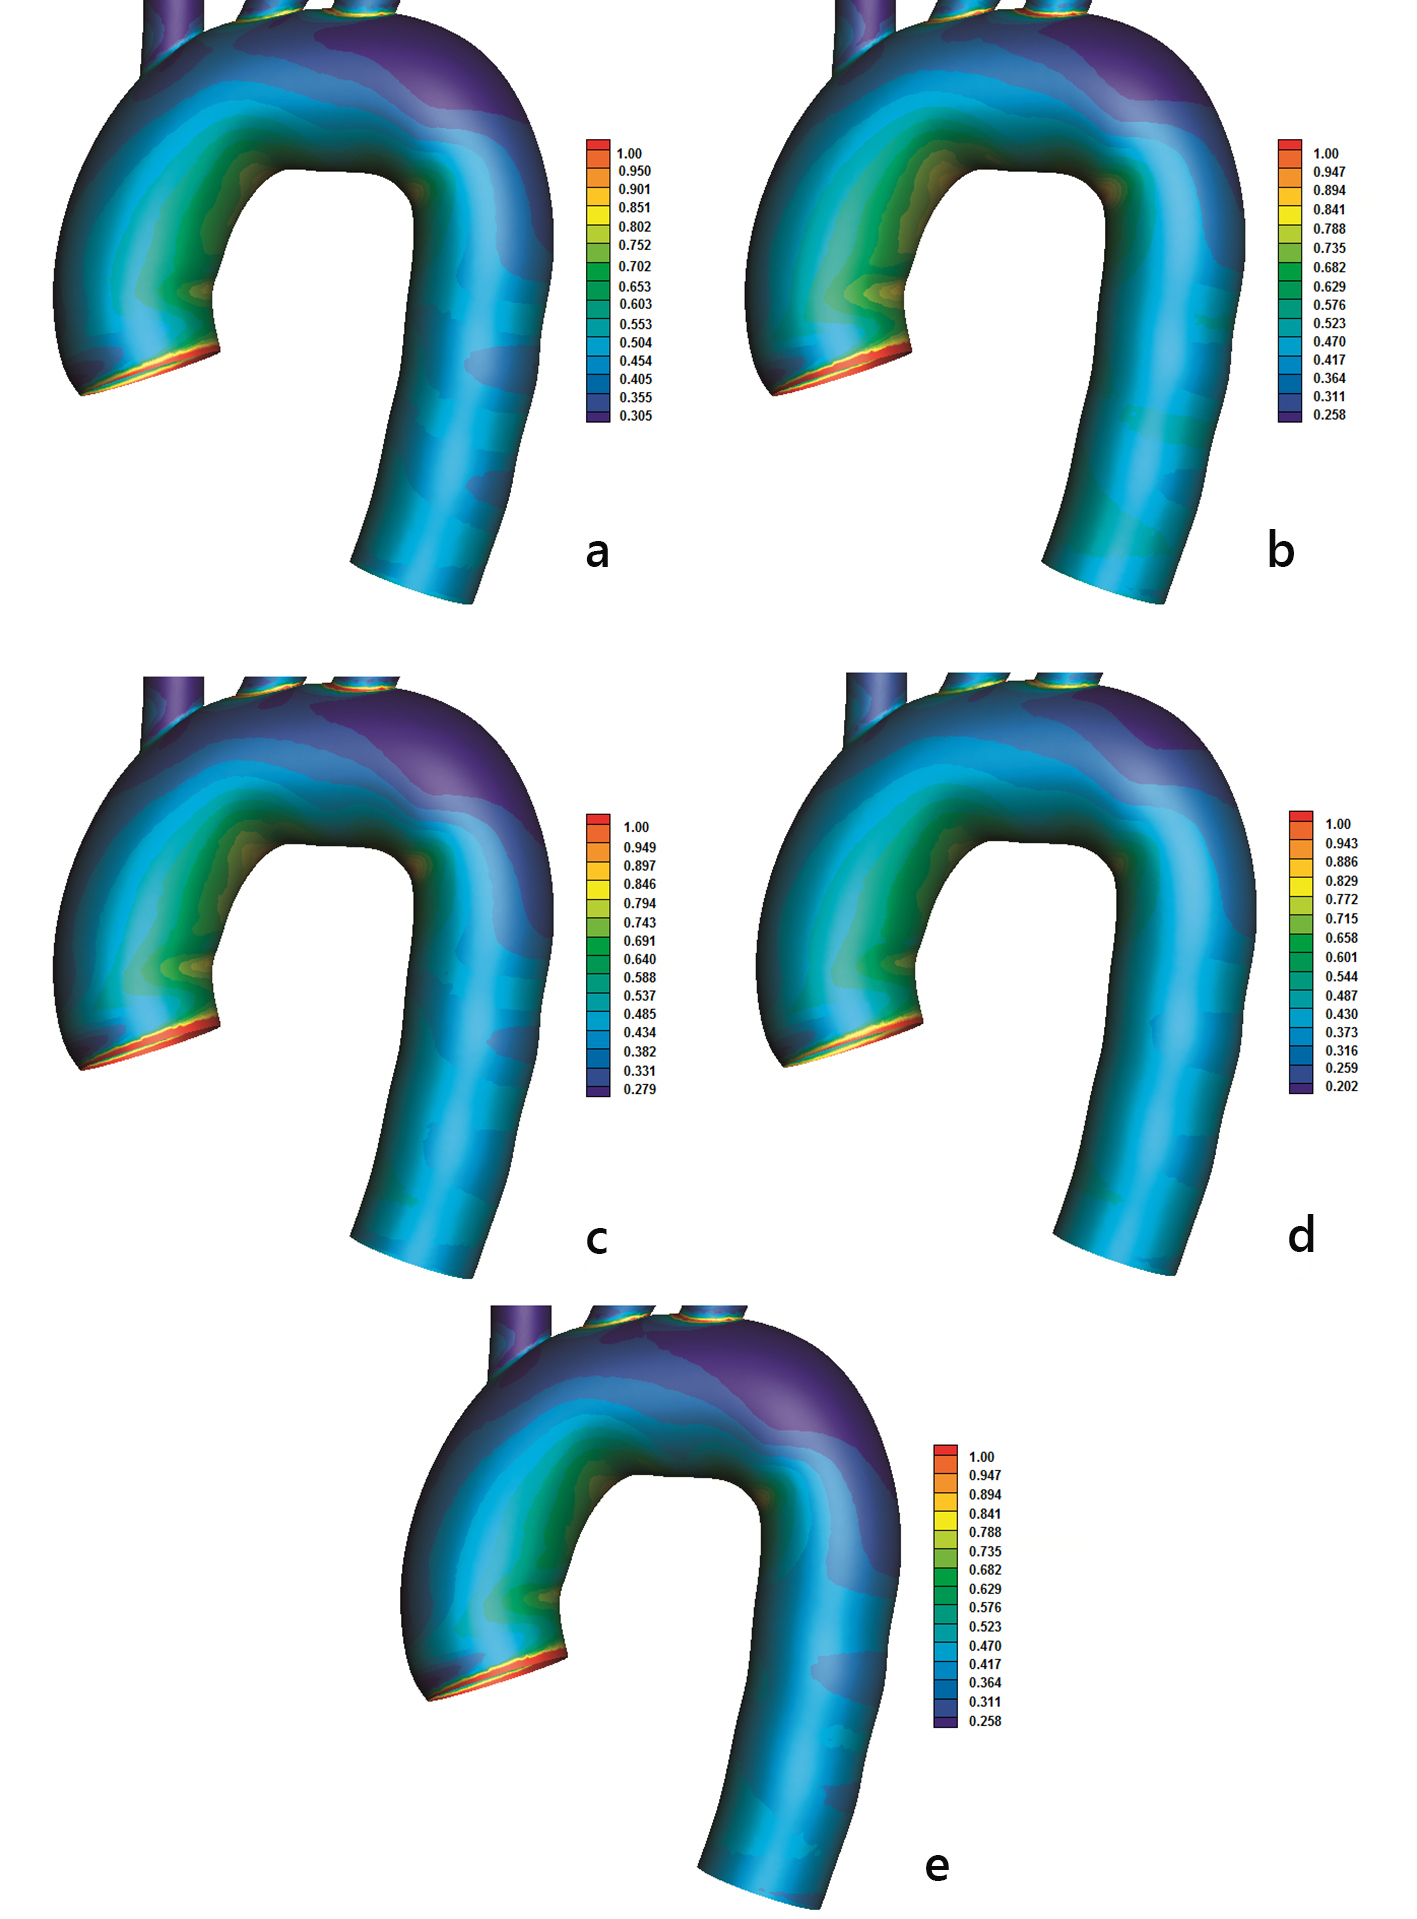 Click for large image | Figure 4. Time-averaged wall shear stress (AWSS) (N/m2) magnitude with (a) power, (b) Carreau, (c) Casson, (d) non-Newtonian power and (e) Newtonian law models. |
High OSI indicates possible atheromatic location. OSI values higher than 0.2 tends to cover large aorta endothelial regions (Fig. 5). High OSI and low AWSS develop at the concave part downstream to left subclavian artery. High OSI endothelium regions > 0.2 tend to collocate (but not always) with low AWSS regions. However, there are exceptions of this rule. For example, high OSI and AWSS values develop at the outer part of the ascending aorta (Figs. 4 and 5).
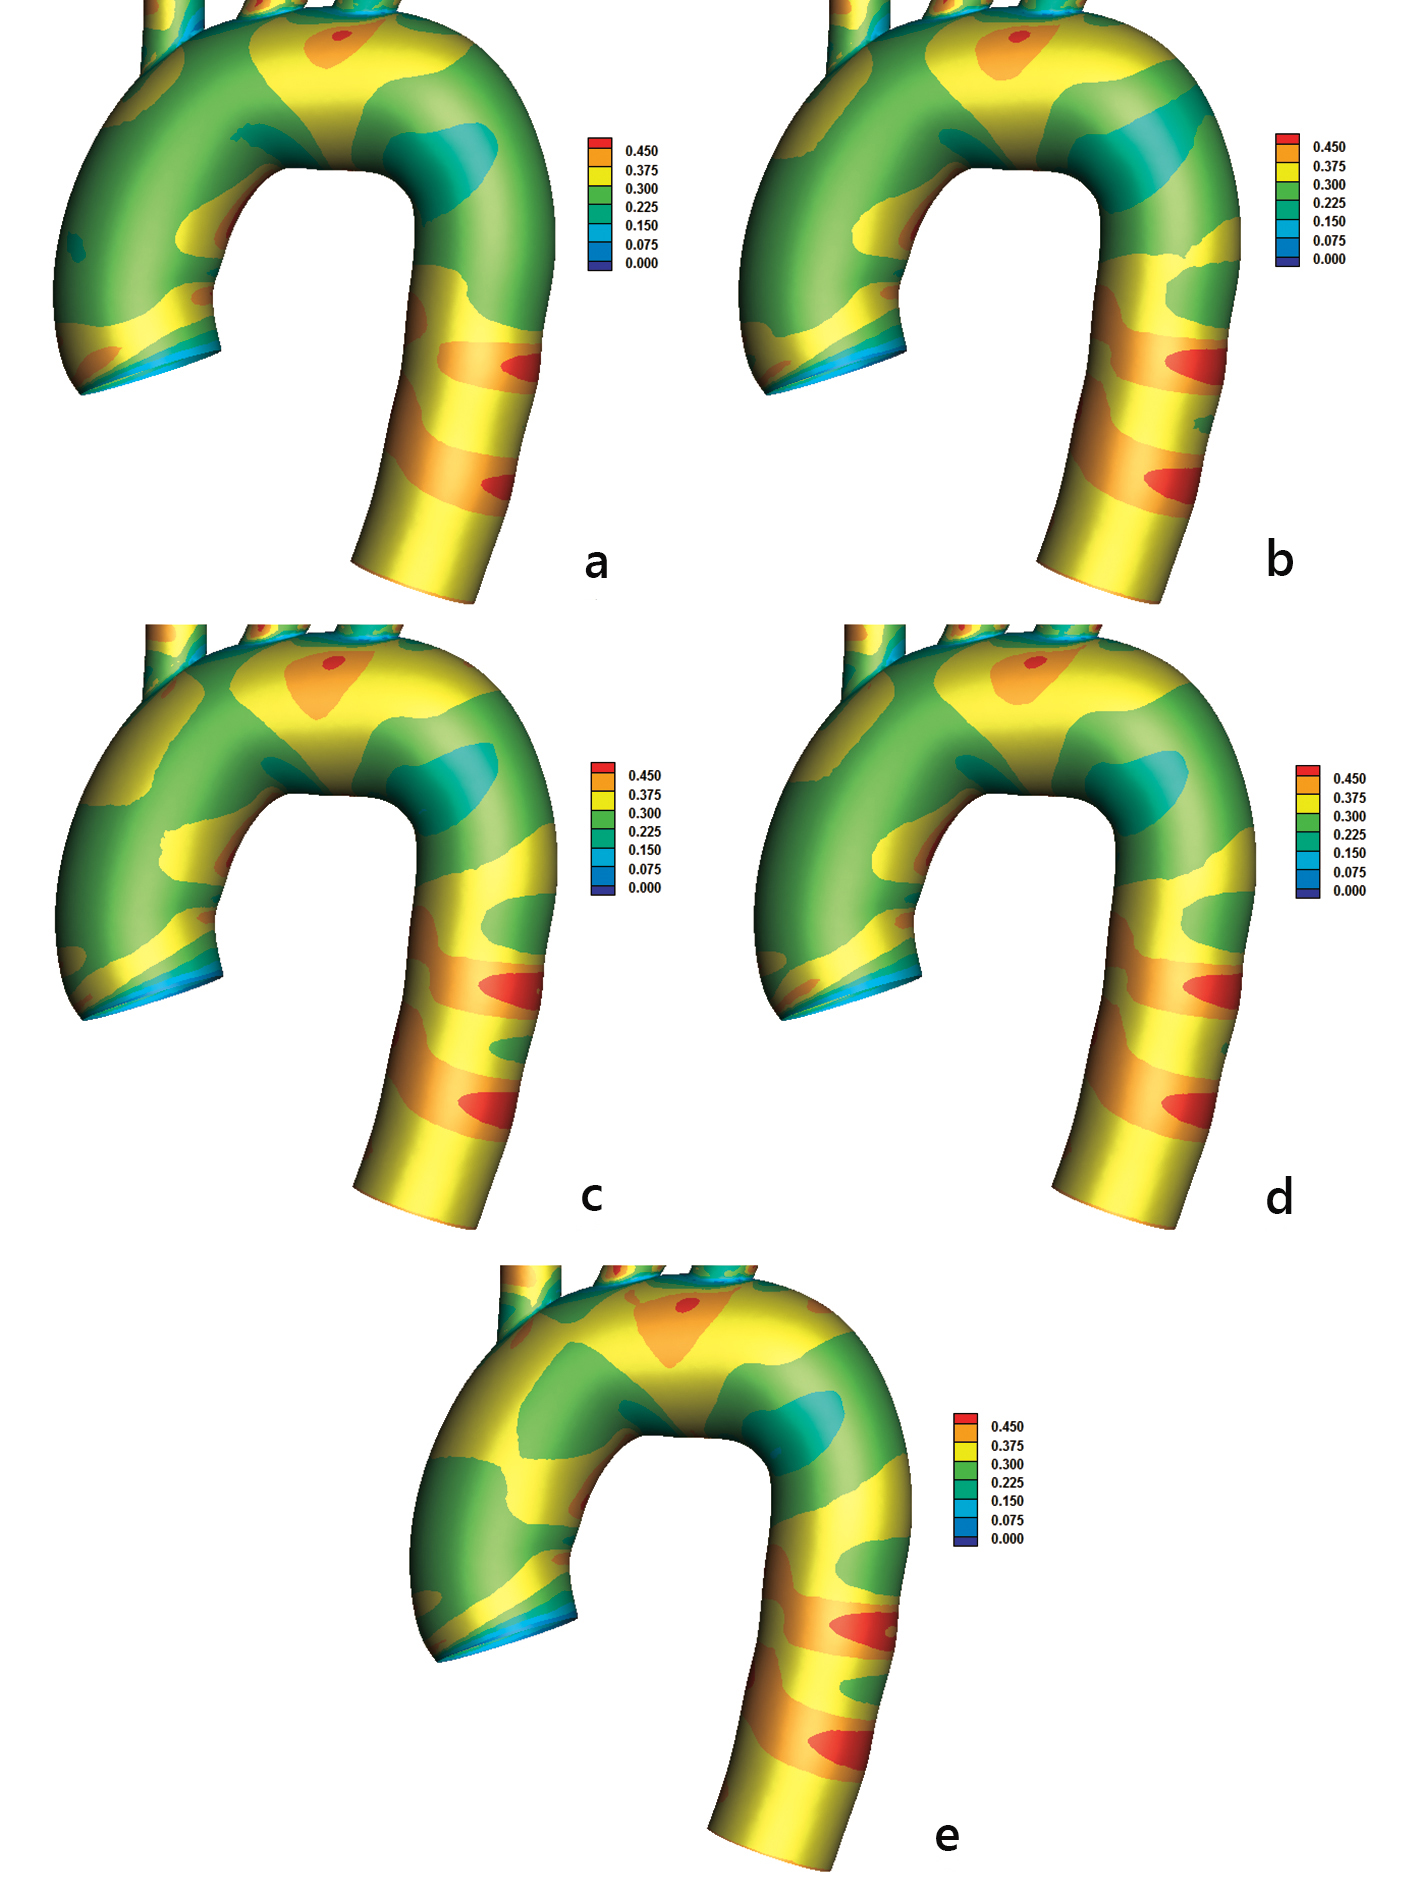 Click for large image | Figure 5. Oscillatory shear index (OSI) with (a) power, (b) Carreau, (c) Casson, (d) non-Newtonian power, and (e) Newtonian law models. |
There is a need to further investigate the actual atheromatic localization in the aorta. For this reason, the RRT factor is introduced [7]. The RRT factor combines the effects of OSI and AWSS (equation (l) of Fig. 2). High RRT indicates regions of possible atheromatic localization, denoting that the blood molecules will spend relatively more time at specific endothelium regions. High RRT value indicates that AWSS is low and at the same time OSI is high. Concave sites compared to convex ones are regions of high RRT values (Fig. 6). High RRT values > 15.0 develop at the concave part of the aortic arch downstream to left subclavian artery. Two distinct rings of high RRT, similar to the OSI rings of Figure 5, appear at the middle descending aorta part. The RRT pattern distribution (Fig. 6) is closer to AWSS than to OSI. Additionally, RRT is by definition inversely proportional to the AWSSV (equations (j), (k) and (l) of Fig. 2).
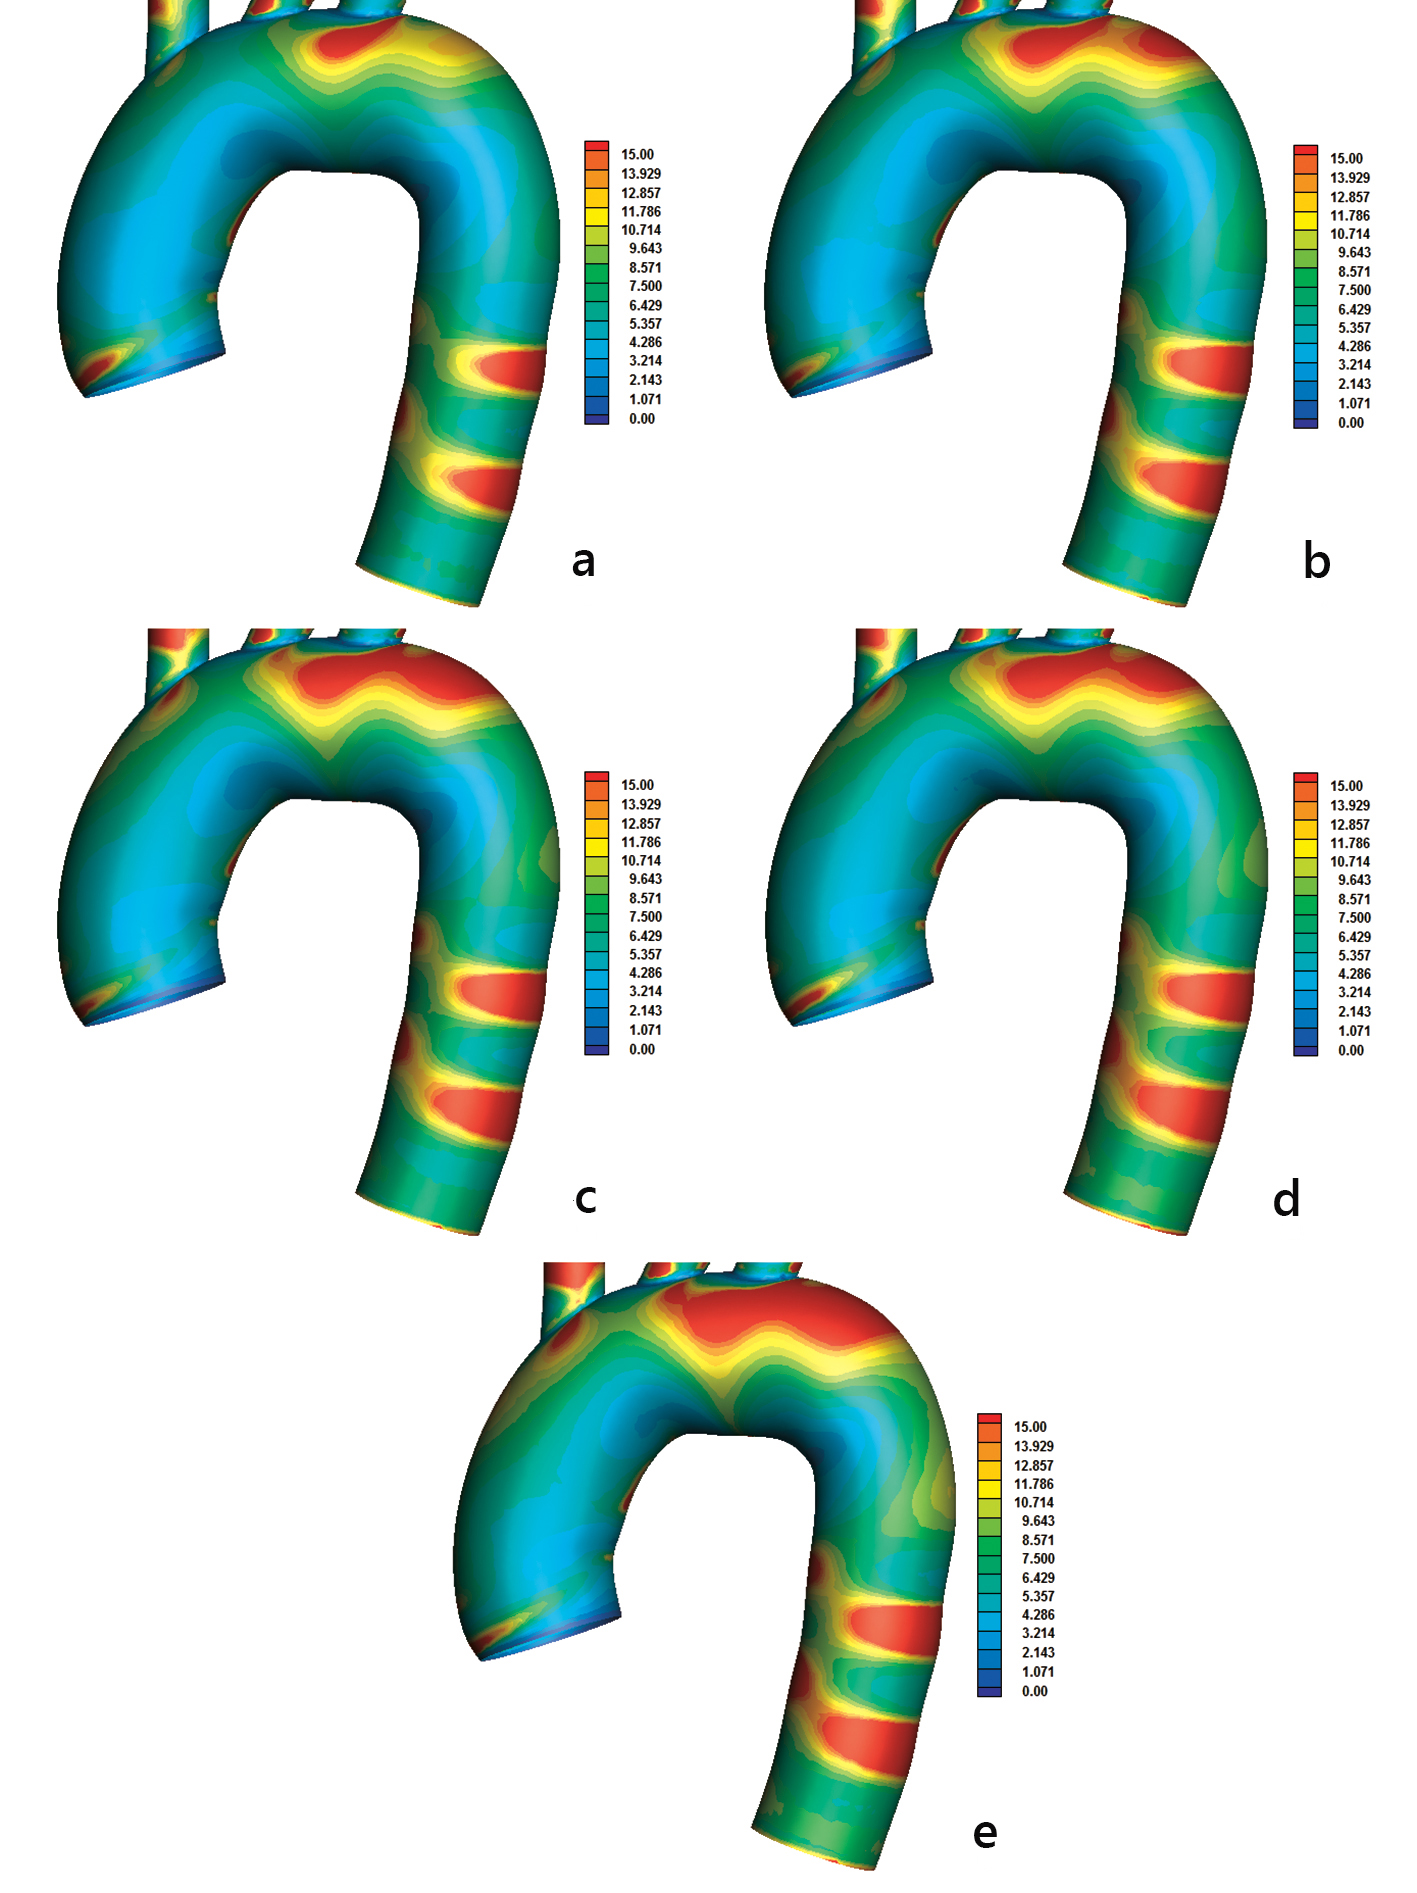 Click for large image | Figure 6. Relative residence time (RRT) with (a) power, (b) Carreau, (c) Casson, (d) non-Newtonian power, and (e) Newtonian law models. The AWSSV is inversely proportional to the RRT. |
Normalized LDL concentrations Cw/Co using non-Newtonian power law model are shown in Figure 7, revealing LDL topography. Derived results of the normalized peak LDL reach 35.0% higher than entrance for the concave site. The convex site exhibits LDL values ranging from 17.0% to 19.0%. Elevated LDL regions occur downstream to the left subclavian artery. Daughter vessels show elevated LDL concentration because of the low velocity values.
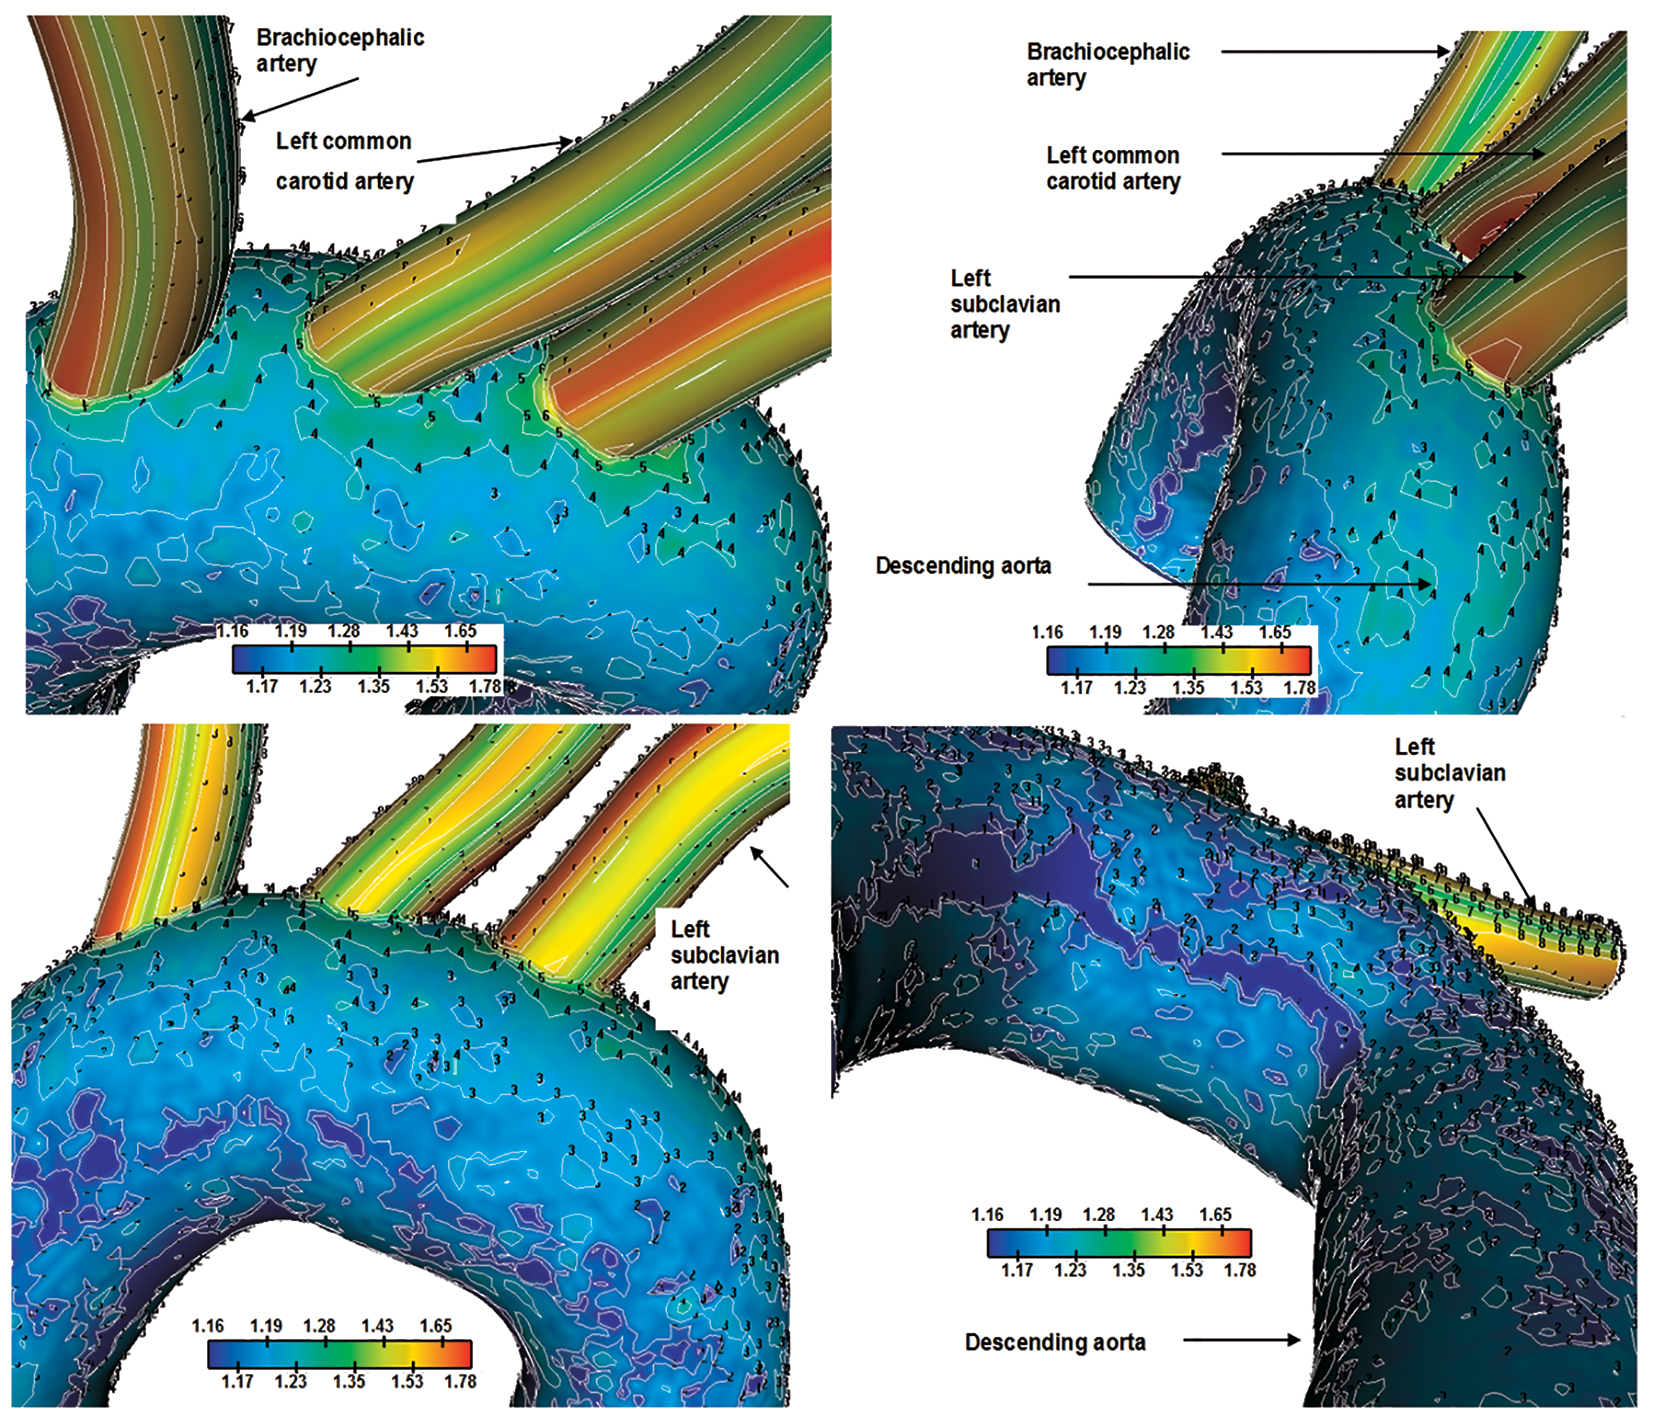 Click for large image | Figure 7. Normalized luminal surface LDL concentration Cw/Co for the aortic arch. Flow velocity 0.05 m/s and constant concentration LDL of 1.3 mg/mL are applied at the orifice of the ascending aorta. Four views. |
Endothelial LDL increases with decreasing WSS (Fig. 8). As WSS reduces to zero, the LDL increases at higher rate. High LDL occurs at 0.3 N/m2 or smaller. The LDL concentration depends on other factors as well.
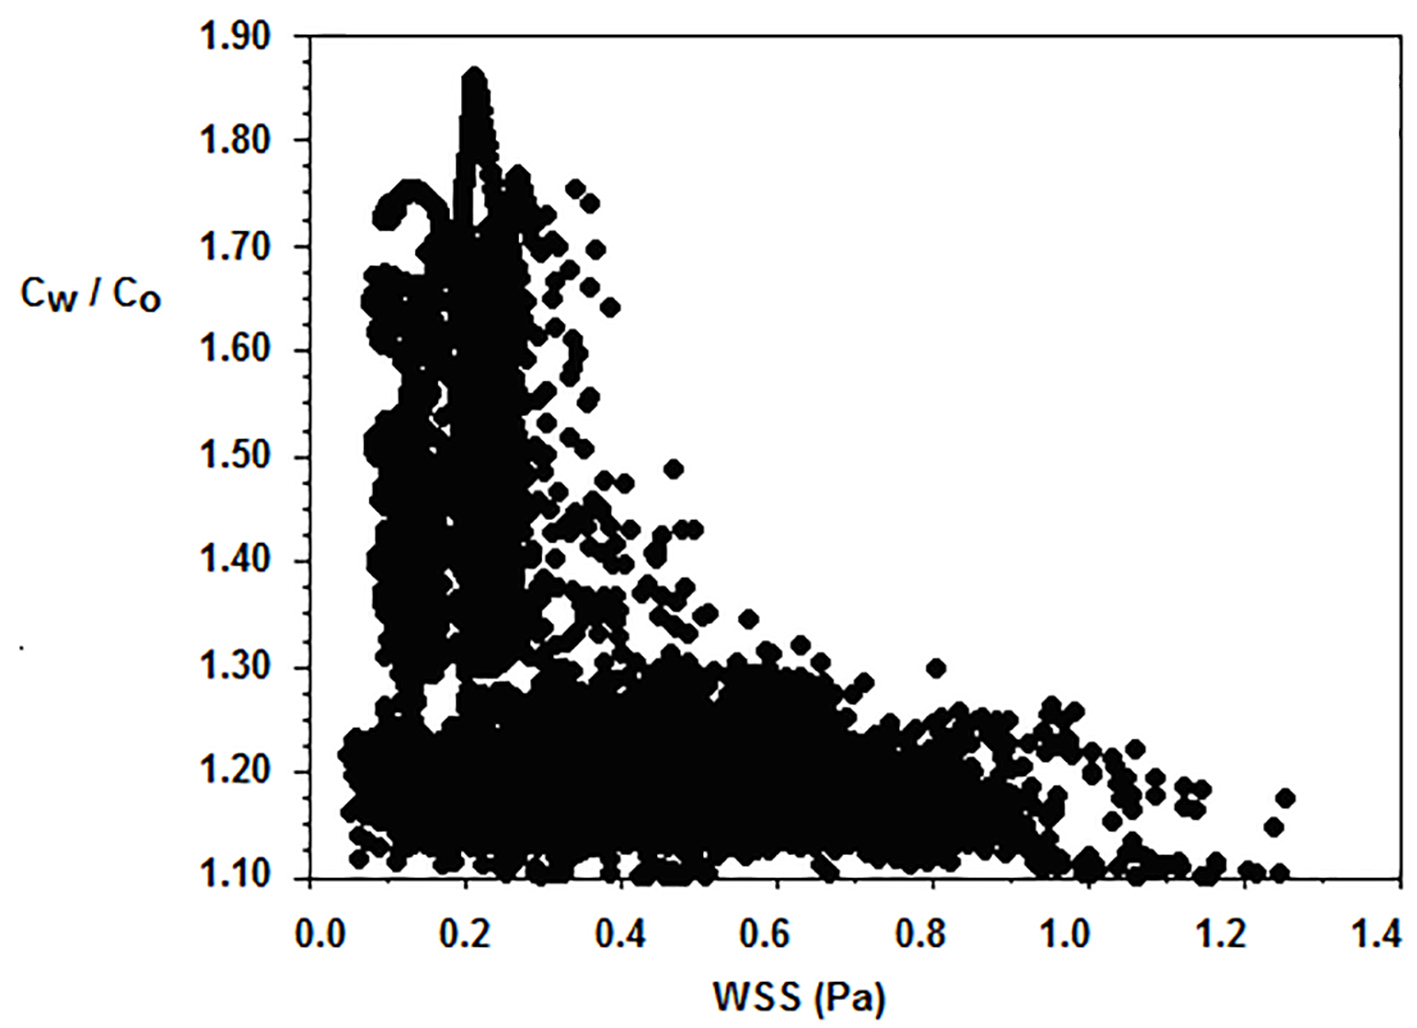 Click for large image | Figure 8. Typical luminal surface concentration Cw/Co of normalized LDL versus WSS (N/m2). Flow velocity 0.05 m/s and constant concentration LDL of 1.3 mg/mL are applied at the orifice of the ascending aorta. |
Direct comparison of the LDL with the RRT, AWSS and OSI distribution using the non-Newtonian power law is shown in Figure 9. The LDL pattern shown in Figure 9a is similar to the RRT one (Fig. 9b). High LDL endothelium regions, which are located at the concave aorta site, are well predicted with high RRT regions. Good comparison is also detected for the low LDL endothelium regions and low RRT at the convex site. The transitional region between high and low LDL distribution is also well predicted with the RRT factor. Low AWSS predicts the high LDL concentration at the concave aorta site as well as at the convex aorta site (Fig. 9c). Furthermore, the transitional zone between high and low LDL is well predicted. However, the AWSS distribution shows that the affected concave site of the aorta exhibits uniform low AWSS (without patches of high AWSS). This is not the case for the RRT distribution. The RRT takes into account the OSI values (Fig. 9d) and modifies accordingly the distribution.
 Click for large image | Figure 9. Contours using non-Newtonian power law of (a) normalized luminal surface LDL concentration Cw/Co at 0.05 m/s and constant concentration of LDL of 1.3 mg/mL applied at the orifice of the ascending aorta), (b) RRT, (c) AWSS (N/m2) and (d) OSI. |
Relationships between time AWSSV and AWSS for the applied blood flow models are shown in Figure 10. The differences show the degree deflection from blood flow predominant direction. Non-Newtonian blood flow models show that high magnitude differences between these two biomechanical quantities appear at low AWSS values < 0.8 N/m2.
 Click for large image | Figure 10. Time-averaged wall shear stress vector (AWSSV) (N/m2) versus averaged wall shear stress (AWSS) (N/m2): (a) power, (b) Carreau, (c) Casson, (d) non-Newtonian power, and (e) Newtonian law models. |
The relationships between OSI and AWSSV are shown in Figure 11. It is evident that as the AWSSV approaches zero, the OSI increases and this is captured with all models. AWSSV values of less than 0.5 N/m2 yield a steep increase to the OSI values. Therefore, high OSI is related to low AWSSV.
 Click for large image | Figure 11. Oscillatory shear index versus time-averaged wall shear stress vector (AWSSV) (N/m2): (a) power, (b) Carreau, (c) Casson, (d) non-Newtonian power, and (e) Newtonian law models. |
| Discussion | ▴Top |
The biomechanical flow parameters of AWSS, AWSSV, OSI, and RRT elucidate the endothelial surfaces prone to atherosclerosis. Four non-Newtonian oscillating molecular viscosity models plus the Newtonian were analyzed. The mass transport of the LDL is also solved in conjunction to the blood flow under steady flow. Henceforth, the comparison of the LDL distribution with the tested flow parameters during the cardiac cycle using non-Newtonian blood behavior will possibly give a better understanding in spotting the prone to atherosclerosis aorta regions.
Endothelial regions at the outer walls of the main ascending-descending aorta yield high molecular viscosity values. Low strain rates appear in these regions and are captured by the viscosity models. Molecular viscosity affects AWSS distribution and is considered (at low values) favorable for atherosclerosis genesis and development. Morphological alterations are activated via WSS magnitude and WSS orientation [20]. Low WSS values < 1.5 N/m2 are known to favor atherosclerosis.
High WSS favors endothelial cell elongation [21], while low WSS yields to polygonal shapes. The WSS interacts with the endothelial cells and subsequently with the arterial wall permeability. High AWSS develops at the convex parts of the curved flow regions. Low AWSS develops at the concave parts, most noticeable at the downstream flow region of the left subclavian artery.
Low OSI values denote minimal change in the flow direction [22]. Large OSI values cause endothelial dysfunction because the instantaneous WSS vector alters its direction during pulse wave. Endothelial regions of low AWSS and high OSI coexist in many parts. Analysis shows that low OSI and high AWSS values develop at the convex part of the ascending aorta. Nearly all non-Newtonian blood flow models capture the just described flow behavior. The inverse correlation between AWSS and OSI is further reinforced after performing statistical analysis between AWSS and OSI results for all examined flow models. Person coefficients between OSI and AWSS have negative values for all models: -0.221 (power law), -0.287 (Carreau), -0.337 (Casson), -0.272 (non-Newtonian power law) and -0.358 (Newtonian model) (Table 1). OSI tends to exhibit high values in regions where AWSSV values are low. This becomes apparent from Figure 11 as well as from the OSI-AWSSV Pearson coefficient in Table 1. These coefficients are: -0.784 (power law), -0.721 (Carreau), -0.721 (Casson), -0.784 (non-Newtonian power law) and -0.731 (Newtonian). Pearson coefficients are higher between OSI and AWSSV to OSI and AWSS and are statistically significant for a P < 0.01. Their relatively low values arise because none of the examined biomechanical parameters have a clearly linear correlation with another one. Thus, the Pearson coefficient is used as marker for macroscopic behavior estimation and not as a part of linear regression process.
 Click to view | Table 1. Pearson Correlation Factors Between Transient Blood Flow Properties |
Low AWSS regions, < 0.8 N/m2, exhibit high AWSSV variation for all viscosity models (Fig. 10). However, the positive Pearson correlation factors, which vary from 0.735 for power law to 0.836 for Casson and Newtonian (Table 1), indicate proportional relationship, when AWSS hurdles a “limit” value close to 0.8 N/m2.
High RRT, emerging from simultaneous low AWSS and high OSI, denotes that the blood molecules spend relatively more time at specific endothelium regions and as a result give rise to atheroma genesis and progression. All non-Newtonian models qualitatively predict similar RRT distribution. Concave sites develop high RRT values compared to convex sites. High RRT values < 15.0 are present at the concave part of the aortic arch downstream to left subclavian artery. RRT has negative correlation with AWSS and AWSSV, whereas its behavior is proportional to OSI for all models (Table 1). A question arises as to which of the physical parameters better describes the possible atherosclerotic aorta regions. Ground evidence is needed to support that high RRT value best describes the possible atherosclerotic aorta regions.
The backing to the above question comes from the coupled solution of flow and mass transfer equation. According to prevailing theories, low WSS and high OSI are responsible for atherosclerosis process. The RRT calculation requires relatively less central processing time since the mass flow transport is not incorporated. Therefore, it is a more flexible biomechanical factor for atherosclerosis localization. It is the contact time between LDL and endothelial surface and the subsequent interaction which really matters and this is exactly what the RRT does. Wherever and whenever the flow is disturbed the mass entering or exiting the arterial wall is substantially affected [23]. Near wall path velocities affect LDL elevation. Concave sides are mostly responsible for elevated LDL (Fig. 7). Convex sides mostly result in low LDL concentration. Low LDL regions cover relatively large endothelium areas. Results show that the RRT is, relatively, a satisfactory biomechanical factor since its distribution is closer to the LDL distribution. For the concave aorta site, the peak LDL value is 35.0% higher than its entrance value. For the convex site, this value is 18.0%.
Previous investigations [24] indicate that the flow pattern is crucial for plaque formation. However, increased LDL values are developed wherever high curvature effects are encountered. The velocity streamlines using the non-Newtonian power law model at time instants, 1) t = 0.075 s, 2) t = 0.150 s, 3) t = 0.250 s and 4) t = 0.60 s, are shown in Figure 12. The velocity streamline time and spatial variability, especially in regions where OSI and RRT attain high values, give rise to elevated LDL (not shown). Centrifugal forces acting on the flow are forcing part of the bulk of fluid to move towards concave side, noticeable at the downstream flow region of the left subclavian artery (not shown). The WSS vectors using the non-Newtonian power law model are shown in Figure 13.
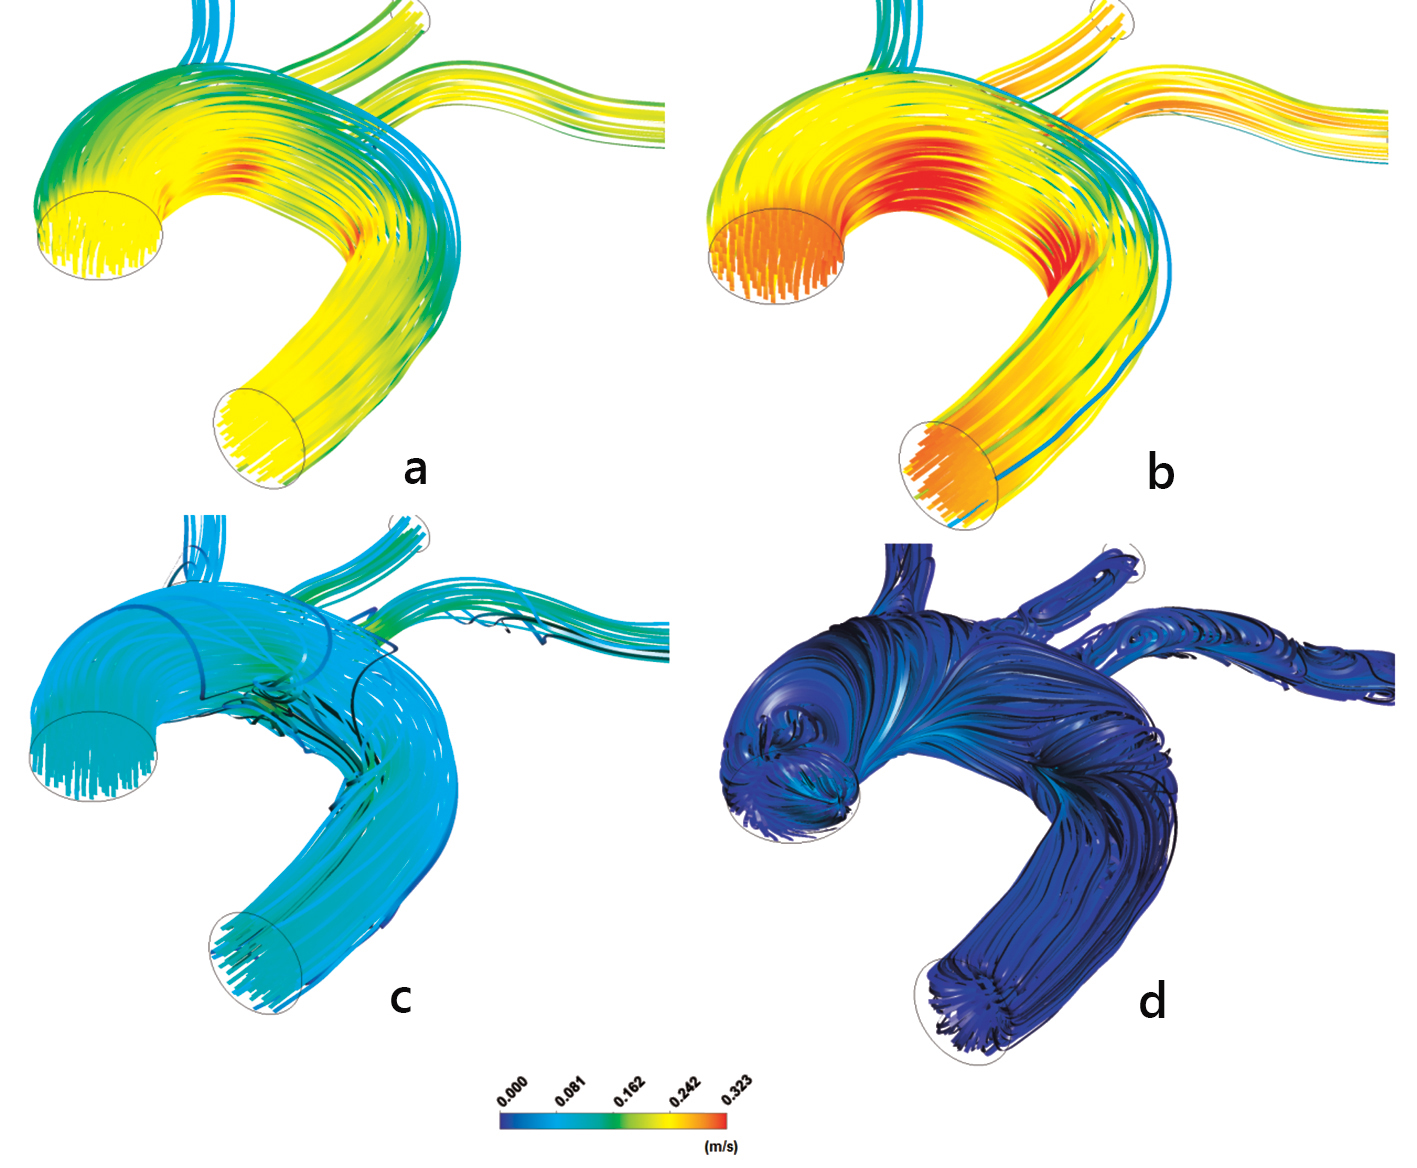 Click for large image | Figure 12. Aorta streamline velocities m/s: (a) t = 0.075 s, (b) t = 0.150 s, (c) t = 0.250 s and (d) t = 0.60 s using the non-Newtonian power law model. |
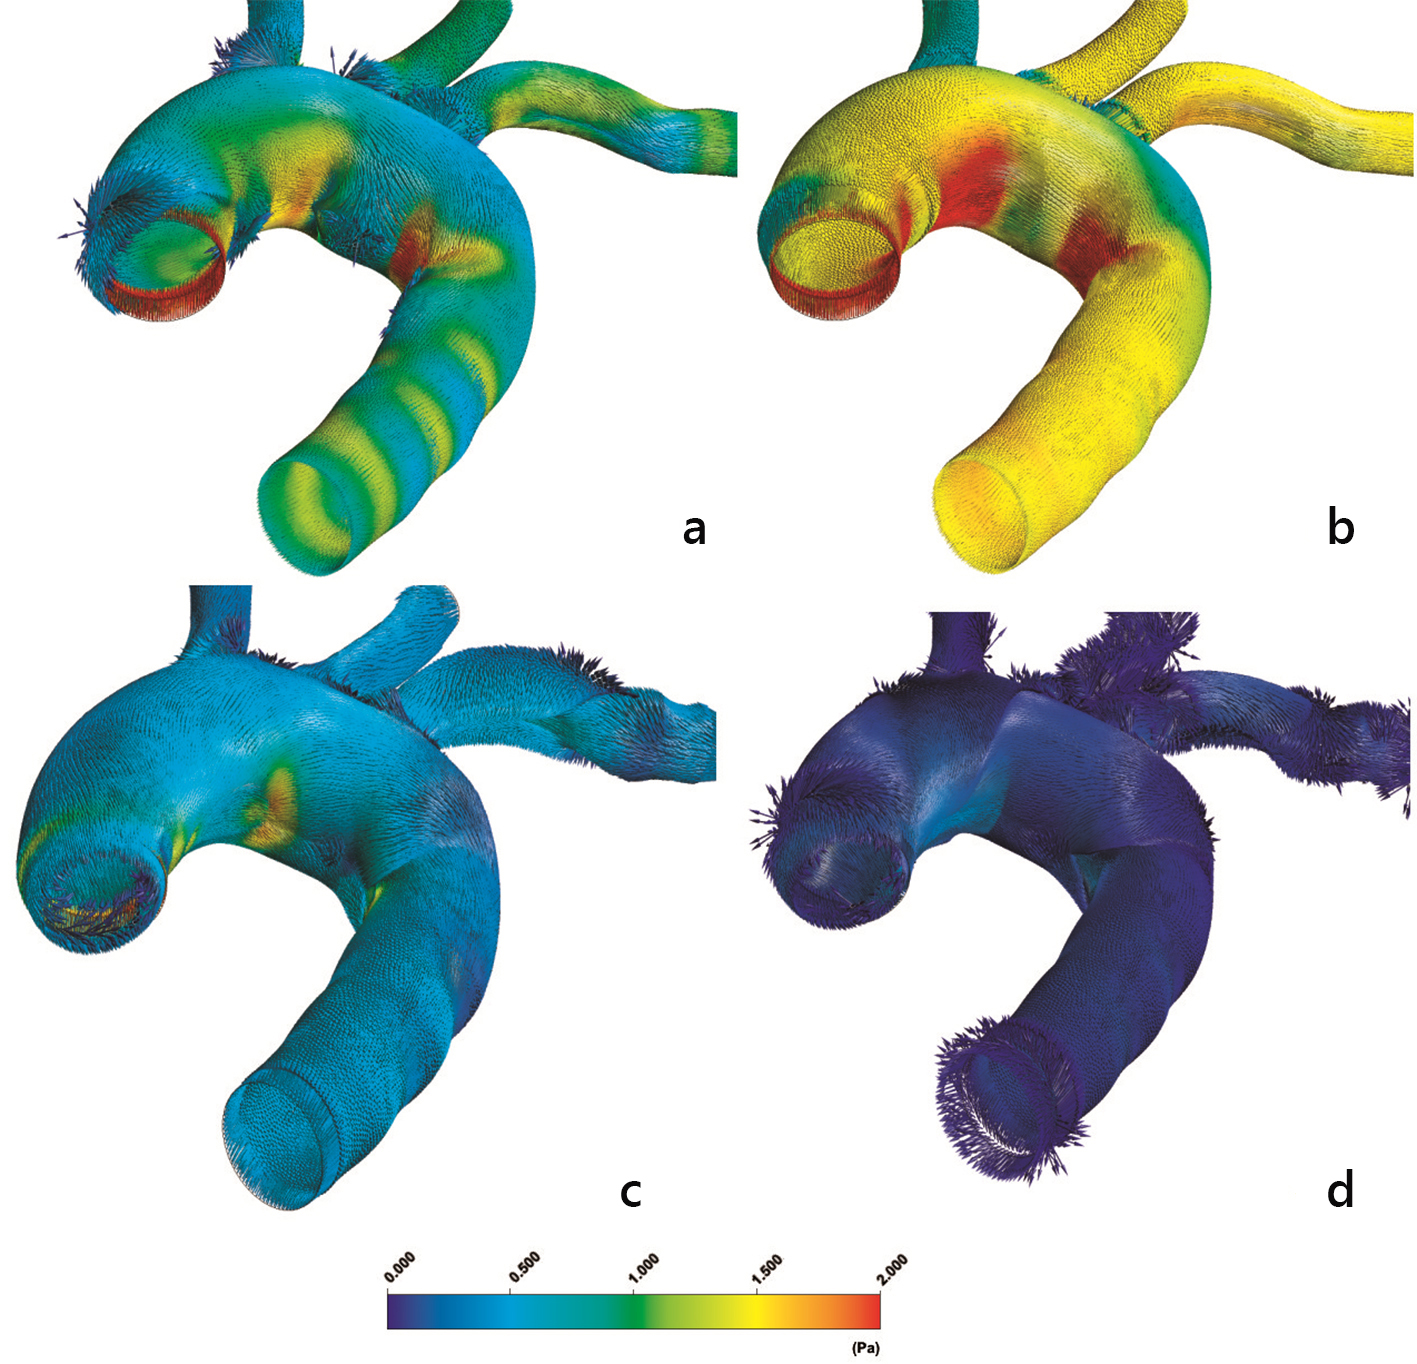 Click for large image | Figure 13. Instantaneous aorta wall shear stress vectors (WSSV) (N/m2) at (a) t = 0.075 s, (b) t = 0.150 s, (c) t = 0.250 s and (d) t = 0.60 s using the non-Newtonian power law model. |
Further analysis is needed to capture the arterial wall deflection (elastic material) during the cardiac pulse. Altered geometry seriously affects the involved biomechanical parameters. The incorporation of fluid-structure interaction with the mass transport within the human arterial wall will give a better inside into atherosclerosis genesis and development.
Conclusion
All four non-Newtonian molecular viscosity blood flow models yield a consistent aorta pattern for AWSSV, OSI, and RRT. The abilities of non-Newtonian blood flow models are mostly seen in satisfactorily capturing the molecular viscosity at low strain rate values. The non-Newtonian power law blood flow model approximates the flow parameters in a more satisfactory way. High AWSS develops at the convex parts of the curved flow regions, most noticeable at the convex part of the ascending aorta. High OSI and low AWSS develop at the concave parts of the curved flow regions, most noticeable at the downstream flow region of the left subclavian artery as well as at the concave ascending aorta. High OSI and low AWSS regions do not always collocate.
High RRT and molecular viscosity values appear in the downstream flow region of the left subclavian artery. High RRT values emerge as an appropriate tool for identifying possible plaque localization. The RRT is relatively a satisfactory biomechanical factor since its distribution is closer to the LDL.
The LDL elevation of the luminal surface side determines the amount of its quantity transported to the arterial wall. Concave aortic arch sites are regions prone to atherosclerosis. Convex parts are not. High LDL endothelium regions are well predicted with high RRT values. Equally well comparison is detected at the convex site. Furthermore, the transitional region between high and low LDL distribution is also well predicted with RRT. For the concave aorta site, the peak LDL value is 35.0% higher than its entrance value. For the convex site, this value is 18.0%.
Conflict of Interest
The authors have declared that no conflict of interest exists.
| References | ▴Top |
- Junker R, Heinrich J, Ulbrich H, Schulte H, Schonfeld R, Kohler E, Assmann G. Relationship between plasma viscosity and the severity of coronary heart disease. Arterioscler Thromb Vasc Biol. 1998;18(6):870-875.
doi pubmed - Becker RC. The role of blood viscosity in the development and progression of coronary artery disease. Cleve Clin J Med. 1993;60(5):353-358.
doi pubmed - Cho YI, Kensey KR. Effects of the non-Newtonian viscosity of blood on flows in a diseased arterial vessel. Part 1: Steady flows. Biorheology. 1991;28(3-4):241-262.
pubmed - Ghista DN, Van Vollenhoven E, Yang WJ, Reul H. Blood: Rheology, hemolysis, gas and surface interactions. 1979; S. Karger, New York.
- Farmakis TM, Soulis JV, Giannoglou GD, Zioupos GJ, Louridas GE. Wall shear stress gradient topography in the normal left coronary arterial tree: possible implications for atherogenesis. Curr Med Res Opin. 2004;20(5):587-596.
doi pubmed - Soulis JV, Giannoglou GD, Chatzizisis YS, Farmakis TM, Giannakoulas GA, Parcharidis GE, Louridas GE. Spatial and phasic oscillation of non-Newtonian wall shear stress in human left coronary artery bifurcation: an insight to atherogenesis. Coron Artery Dis. 2006;17(4):351-358.
doi pubmed - Himburg HA, Grzybowski DM, Hazel AL, LaMack JA, Li XM, Friedman MH. Spatial comparison between wall shear stress measures and porcine arterial endothelial permeability. Am J Physiol Heart Circ Physiol. 2004;286(5):H1916-1922.
doi pubmed - Ethier CR. Computational modeling of mass transfer and links to atherosclerosis. Ann Biomed Eng. 2002;30(4):461-471.
doi pubmed - Friedman MH, Deters OJ, Mark FF, Bargeron CB, Hutchins GM. Arterial geometry affects hemodynamics. A potential risk factor for athersoclerosis. Atherosclerosis. 1983;46(2):225-231.
doi - Soulis JV, Giannoglou GD, Papaioannou V, Parcharidis GE, Louridas GE. Low-Density Lipoprotein concentration in the normal Left Coronary Artery tree. Biomed Eng Online. 2008;7:26.
doi pubmed - Wada S, Karino T. Theoretical prediction of low-density lipoprotein concentration at the luminal surface of an artery with a multiple bend. Ann Biomed Eng. 2002;30:778-791.
doi pubmed - Sharma K, Bhat SV. Non-Newtonian rheology of leukemic blood and plasma: are n and k parameters of power law model diagnostic? Physiol Chem Phys Med NMR. 1992;24(4):307-312.
pubmed - Fung C. Biomechanics: Mechanical properties of living tissues, 2nd Edition. 1976. Springer, Berlin.
- Soulis JV, Giannoglou GD, Chatzizisis YS, Seralidou KV, Parcharidis GE, Louridas GE. Non-Newtonian models for molecular viscosity and wall shear stress in a 3D reconstructed human left coronary artery. Med Eng Phys. 2008;30(1):9-19.
doi pubmed - Johnston BM, Johnston PR, Corney S, Kilpatrick D. Non-Newtonian blood flow in human right coronary arteries: steady state simulations. J Biomech. 2004;37(5):709-720.
doi pubmed - ANSYS FLUENT 12.0 Documentation 2009, http://www.ansys.com.
- Wada S, Karino T. Theoretical study on flow-dependent concentration polarization of low density lipoproteins at the luminal surface of a straight artery. Biorheology. 1999;36(3):207-223.
pubmed - Lei M, Kleinstreuer C, Truskey GA. A focal stress gradient-dependent mass transfer mechanism for atherogenesis in branching arteries. Med Eng Phys. 1996;18(4):326-332.
doi - Naiki T, Sugiyama H, Tashiro R, Karino T. Flow-dependent concentration polarization of plasma proteins at the luminal surface of a cultured endothelial cell monolayer. Biorheology. 1999;36(3):225-241.
pubmed - Reidy MA, Bowyer DE. Scanning electron microscopy of arteries. The morphology of aortic endothelium in haemodynamically stressed areas associated with branches. Atherosclerosis. 1977;26(2):181-194.
doi - Davies PF, Tripathi SC. Mechanical stress mechanisms and the cell. An endothelial paradigm. Circ Res. 1993;72(2):239-245.
doi - Glor FP, Ariff B, Hughes AD, Crowe LA, Verdonck PR, Barratt DC, Mc GTSA, et al. Image-based carotid flow reconstruction: a comparison between MRI and ultrasound. Physiol Meas. 2004;25(6):1495-1509.
doi pubmed - Vorp D, Steinman D, Ethier C. Computational modeling of arterial biomechanics. Computing in Science and Engineering (Bioengineeing and Biophysics, IEEE). 2001;51-63.
- Stangeby DK, Ethier CR. Computational analysis of coupled blood-wall arterial LDL transport. J Biomech Eng. 2002;124(1):1-8.
doi
This is an open-access article distributed under the terms of the Creative Commons Attribution-NonCommercial 4.0 International License, which permits unrestricted non-commercial use, distribution, and reproduction in any medium, provided the original work is properly cited.
Cardiology Research is published by Elmer Press Inc.