

| Cardiology Research, ISSN 1923-2829 print, 1923-2837 online, Open Access |
| Article copyright, the authors; Journal compilation copyright, Cardiol Res and Elmer Press Inc |
| Journal website https://www.cardiologyres.org |
Original Article
Volume 12, Number 2, April 2021, pages 86-90
A Dashboard for Tracking Mortality After Cardiac Surgery Using a National Administrative Database
Katherine J. Grecoa, Nikhilesh Raob, Richard D. Urmana, c, e, Ethan Y. Brovmand
aDepartment of Anesthesiology, Perioperative and Pain Medicine, Brigham and Women’s Hospital, Harvard Medical School, Boston, MA, USA
bGridlex Dexur Health Research, Miami, FL, USA
cCenter for Surgery and Public Health, Brigham and Women’s Hospital, Boston, MA, USA
dDepartment of Anesthesiology and Perioperative Medicine, Tufts Medical Center, Tufts University School of Medicine, Boston, MA, USA
eCorresponding Author: Richard D. Urman, Department of Anesthesiology, Perioperative and Pain Medicine, Brigham and Women’s Hospital/Harvard Medical School, Boston, MA 02115, USA
Manuscript submitted January 16, 2021, accepted February 9, 2021, published online February 23, 2021
Short title: Dashboard to Track Cardiac Surgery Mortality
doi: https://doi.org/10.14740/cr1220
| Abstract | ▴Top |
Background: Mortality after cardiac surgery is publicly reportable and used as a quality metric by national organizations. However, detailed institutional comparisons are often limited in publicly reported ratings, while publicly reported mortality data are generally limited to 30-day outcomes. Dashboards represent a useful method for aggregating data to identify areas for quality improvement.
Methods: We present the development of a dashboard of cardiac surgery performance using cardiac surgery admissions in a national administrative dataset, allowing institutions to better analyze their clinical outcomes. We identified cardiac surgery admissions in the Medicare Limited Data Sets from April 2016 to March 2017 using diagnosis-related group (DRG) codes for cardiac valve and coronary bypass surgeries.
Results: Using these data, we created a dashboard prototype to enable hospitals to compare their individual performance against state and national benchmarks, by all cardiac surgeries, specific cardiac surgery DRGs and by specific surgeons. Mortality rates are provided at 30, 60 and 90 days post-operatively as well as 1 year. Users can filter results by state, hospital and surgeon, and visualize summary data comparing these filtered results to national metrics. Examples of using the dashboard to examine hospital and individual surgeon mortality are provided.
Conclusions: We demonstrate how this database can be used to compare data between comparator hospitals on local, state and national levels to identify trends in mortality and areas for quality improvement.
Keywords: Dashboard; Quality improvement; Cardiac surgery; Outcomes; Mortality
| Introduction | ▴Top |
Improving the quality of healthcare delivery is a vital step in providing better value to patients and the broader healthcare system [1]. Due to the increasing emphasis on quality-based payment models, there is substantial value in developing benchmarking systems that allow for institutions to compare their outcomes against comparator institutions.
Thirty-day mortality is a particularly important outcome in cardiac surgery, as this metric is frequently used by external entities to judge the quality of surgical care [2, 3]. The Department of Veterans Affairs and Society of Thoracic Surgeons produce aggregated datasets to track mortality data for quality improvement purposes in cardiac surgery. These datasets have demonstrated varying levels of utility over the past several decades in guiding improvements in mortality and other outcomes [4-7].
Dashboards are a useful way to clearly and concisely display data for quick retrieval, and they have been shown to be useful tools to improve patient outcomes in a variety of healthcare settings [8-14]. A 2009 study showed increased compliance with ventilator bundle and decreased rates of ventilator-associated pneumonia after implementation of a dashboard in a surgical intensive care unit (ICU) [15]. Similarly, introduction of a dashboard in a primary care setting improved frequency of health screening items including cancer, diabetes and smoking [16]. On a larger scale, dashboards have been implemented for tracking national data including the impact of diabetes on hospital readmissions and opioid-related adverse events [10, 11]. A common conundrum is that individual institutions are able to collect their own data and compare to national benchmarks, but lack other peer groups, such as local or regional hospitals with which to compare. In this study, we present the development of a national dashboard of cardiac surgery performance. We demonstrate its utility by presenting example data for California hospitals and its comparison on the local, state and national level.
| Materials and Methods | ▴Top |
Data source
Data were analyzed from Center for Medicare and Medicaid Services Limited Data Set (LDS) from April 2016 to March 2017. The LDS is an administrative claims database maintained by CMS, which contains all claims submitted by hospitals for services provided to Medicare beneficiaries. For each hospitalization, the claim record includes patient age, sex, date of admission and discharge, the principal diagnosis code, secondary diagnosis codes, procedure codes, discharge status, diagnosis-related group (DRG), total charges and total Medicare payments [17]. This database was queried for all cardiac surgical DRGs.
Compliance with ethical guidelines
The CMS LDS is a de-identified database that consists of a collection of billing and diagnostic codes used by participating hospitals with the goal of quality control, population monitoring and tracking procedures. The CMS LDS does not require institutional review board (IRB) approval or exempt determination or informed consent. These diagnostic and procedure codes are designated at the discretion of physicians or hospital billing departments rather than by defined clinical or radiographic diagnostic criteria. The CMS LDS does not directly involve human subjects as defined by federal regulations and guidance. This study was conducted in compliance with the ethical standards of the responsible institution on human subjects as well as with the Helsinki Declaration.
Identification of patients undergoing cardiac surgery by DRG codes
Cardiac surgery admissions in the CMS data were identified using DRG codes for cardiac valve and coronary bypass surgeries. The DRG coding methodology was used to identify DRGs 215, 216, 217, 218, 219, 220, 221, 231, 232, 233, 234, 235 and 236 for inclusion in the dashboard. Cohorts that contained fewer than 11 cases were not identified as per CMS privacy guidelines.
Dashboard design and development
The dashboard prototype was developed with the technical assistance from the Dexur Research and Analytics, a research organization specializing in the analysis of large datasets. In the creation of the dashboard, Dexur programmers created a series of queries driven by DRG codes associated with cardiac surgery admissions. The technical design involved loading the relevant DRG codes provided by the medical team and identifying outcomes in the claims data. The web pages are served from pre-calculated reports in the database. Dexur stores the information available from CMS on in-house servers at its aggregated data warehouse. Quality assurance algorithms flag outliers for manual review by data technicians. Programmers at Dexur utilized Python programing language (V 3.7.4, Python Software Foundation, Delaware, USA) and other open source tools to display information from the database in the user interface online. The dashboard is available for users to view via HTML pages from the personal computer (PC), mobile device or a tablet on an open internet connection.
| Results | ▴Top |
Dashboard functionality
The dashboard is searchable under different features such as DRG, hospitals, doctors and quality rankings. These categories can be further narrowed by International Classification of Disease (ICD) codes, mortality rates, readmission, length of stay (LOS) and cost outcomes as examples. Further, these outcomes can be searched by state, hospital and surgeon. Presented below are examples of data retrieved by searching for a DRG quality outcome. Mortality rates were retrieved by searching by state, and further by hospital and surgeons in the State of California to demonstrate different comparator groups.
Outcomes
We analyzed outcomes to demonstrate utility of data that can be retrieved from the database. For illustrative purposes, we used the database to retrieve mortality data in California to compare to other states, as well as amongst individual California hospitals, and individual surgeons in common cardiac surgical procedures by DRG code. Mortality was calculated as a percentage from CMS reported data in the database.
Mortality at 30, 60, 90 days and 1 year post-operatively in California, Texas and Florida for all cardiac surgical DRGs combined as compared to the United States overall are reported in Figure 1.
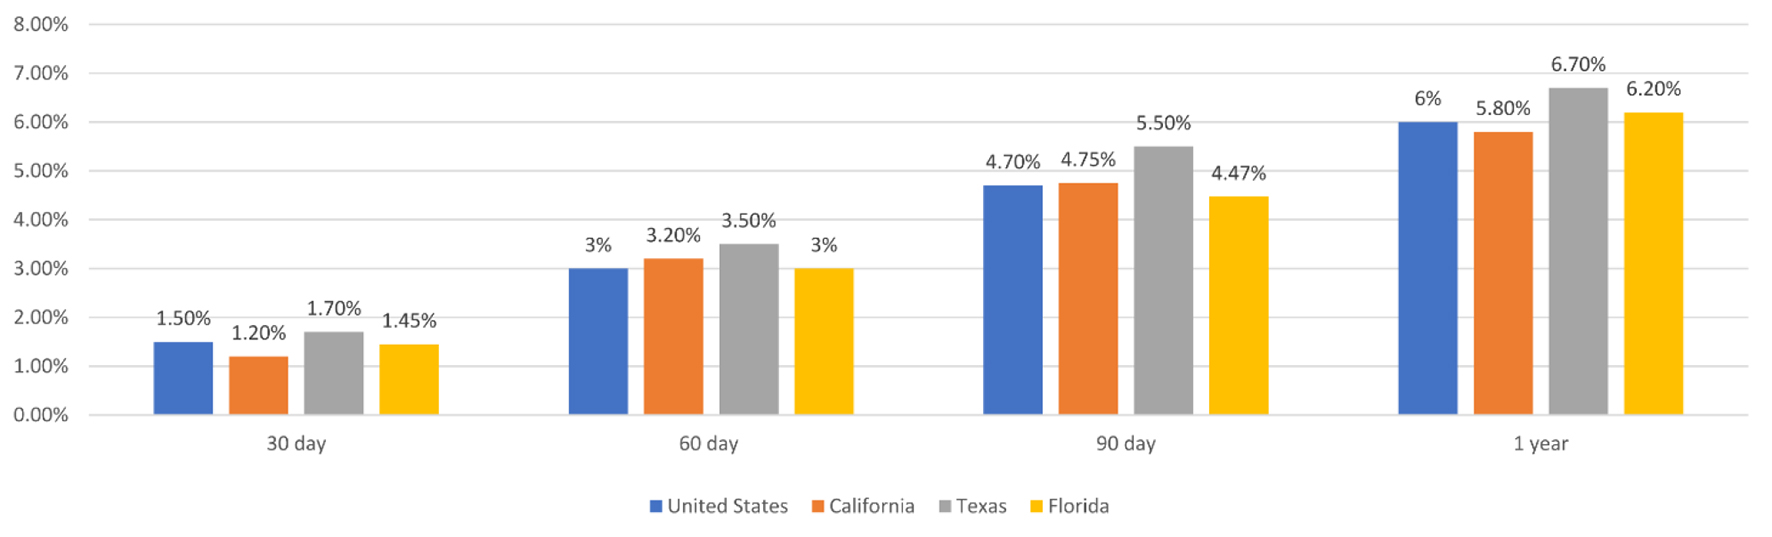 Click for large image | Figure 1. Mortality after cardiac surgery at 30, 60, 90 days, and 1 year post-operatively in California, Texas, Florida and the United States. |
To demonstrate a hospital-to-hospital comparison in appropriate comparator groups, mortality for DRG 236, coronary artery bypass grafting (CABG) in four California hospitals at 30, 60, 90 days and 1 year post-operatively, is shown in Figure 2.
 Click for large image | Figure 2. Mortality for DRG 236, coronary artery bypass grafting in four California hospitals at 30, 60, 90 days, and 1 year post-operatively. DRG: diagnosis-related group. |
To demonstrate utility at comparing performance at one hospital against state and national benchmarks, we presented mortality data for one California hospital as compared to the national and state level for cardiac surgical DRGs (216-221 and 233-236) at 30, 60, 90 days and 1 year post-operatively in Figure 3.
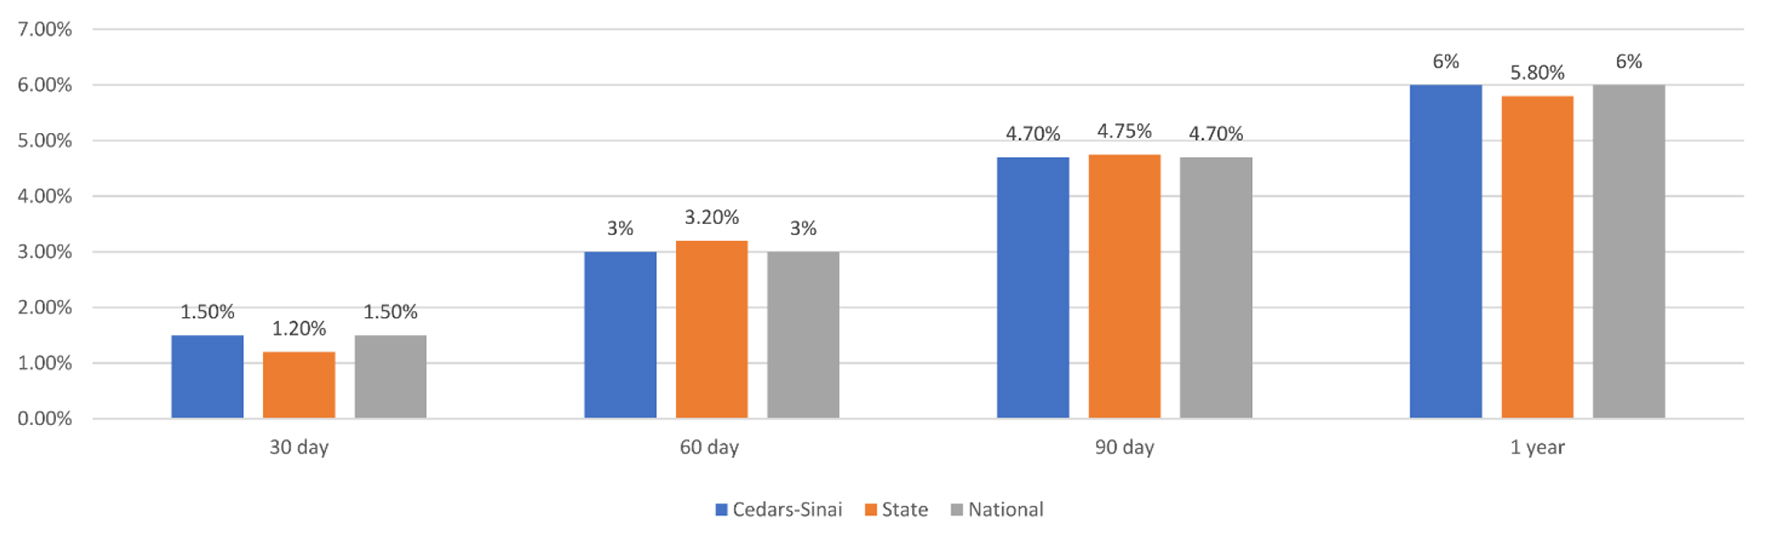 Click for large image | Figure 3. Mortality for cardiac surgical DRGs (216-221 and 233-236) at 30, 60, 90, and 1 year post-operatively in one California Hospital, in the state of California, and for the United States. DRG: diagnosis-related group. |
Finally, to demonstrate dashboard utility at comparing outcomes within one institution for surgeries performed by different surgeons, in Figure 4 we present mortality rates for two surgeons as compared to the state and national level at 30, 60, 90 days, and 1 year.
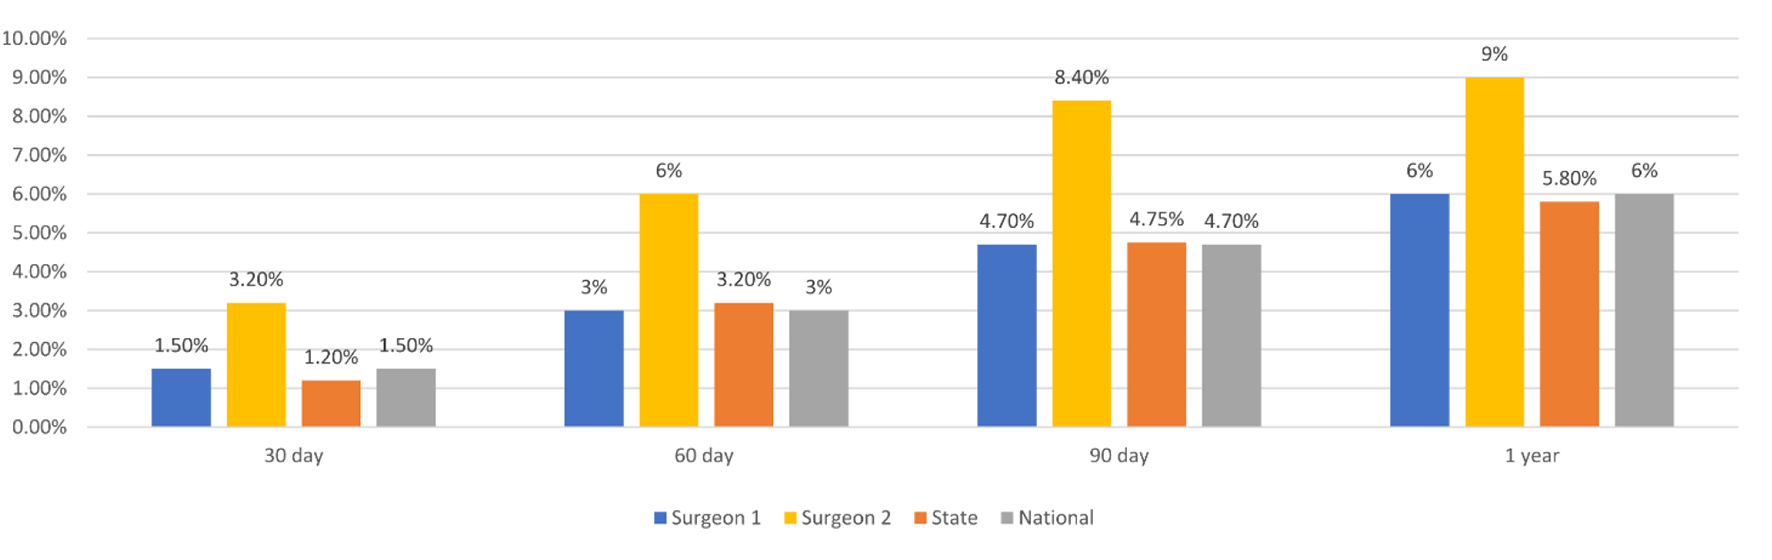 Click for large image | Figure 4. Mortality for two individual surgeons as compared to the state and national level at 30, 60, 90 days, and 1 year post-operatively. |
| Discussion | ▴Top |
In this study, we designed a first of its kind dashboard that facilitates detailed comparisons of outcomes, allowing clinicians and administrators to assess institutional performance, compare their data to that of comparator institutions and identify areas of improvement specifically for cardiac surgery. The dashboard represents a useful tool for aggregating quality improvement data for cardiac surgery [4, 18]. The database is searchable for DRG-specific quality outcomes by surgeon, hospital and state, and can be easily exported for comparison. In addition to mortality data at 30, 60, 90 days, and 1 year, this database contains searchable data related to LOS, ICU LOS, and revenue information for numerous DGRs and hospitals nationwide for data comparable at the state and national level. We demonstrate use of a dashboard to display mortality data that can be directly compared to other institutions and tracked over time to quickly identify areas of poor outcomes, including underperforming DRGs, surgeons or adverse late outcomes beyond the usual 30-day window.
With the continually changing field of cardiac surgery, institutional trends can vary significantly with regards to frequency of procedures performed, patient populations, co-morbidities and practice trends. We have demonstrated that our dashboard can easily identify trends in mortality after cardiac surgery at a particular institution as well as other comparator groups. Our database is searchable by surgeon, hospital and state, to allow users to compare data about particular surgeons and institutions against comparator hospitals, as well as the state and national trends. In Figure 1, we demonstrate that mortality after cardiac surgery can be compared between different states and also against the national rate at multiple post-operative timepoints. Further, we demonstrate in Figure 3 how mortality after cardiac surgery at just one institution can be compared with the local and state levels.
Mortality rates can be impacted by multiple metrics that may be unreported in this database, therefore exceptional data points in this database will help identify potential areas of quality improvement. For example, outcomes at a large academic institution in comparison to another academic institution of comparable size and patient population might be more meaningful than the national trend. In fact, in Figure 2 we show a sample analysis that would be helpful in showing major differences amongst hospitals for one DRG. This type of comparison can be used to identify underperforming DRGs in a particular institution. For a deeper investigation, we show in Figure 4 how individual surgeon’s mortality rates can be compared against state and national rates. If all surgeons in the same institution have comparable mortality rates, but the institution’s rates are significantly worse than a comparable hospital, this may encourage a different quality improvement intervention than if mortality rates amongst an institution’s surgeons were different. Effectiveness of these interventions can be tracked by evaluating data in comparison to other institutions over time in this database.
Dashboards have been useful in multiple settings to transparently display clinical data in real time to ultimately guide clinical decision-making [13, 14, 19-21]. Importantly, commitment to quality improvement has been shown to be associated with mortality outcomes independent of volume of cases performed [22]. This speaks to the utility in using a database that reveals detailed information by institution. Further dashboard development could allow for comparisons regarding additional outcomes metrics, such as data related to specific post-operative complications. Further studies are needed to demonstrate whether this dashboard improves outcomes over time and where improvements can be made to improve usability and effectiveness in decreasing mortality rates.
Limitations
Since this dashboard uses CMS data, outcomes data are specific to the patients in the dataset, which represent a specific patient population and may not be generalizable to all patients undergoing cardiac surgery. Users of the database will need to consider demographics when querying specific procedures and outcomes. In addition, there are surgery-specific and patient-related factors (i.e., patient severity) that can affect complication and mortality rates, and appropriate risk adjustments should be made to take these factors into account for more meaningful outcome comparisons between institutions. Additionally, the accuracy of claims data is potentially subject to errors due to lack of standardization of data collection, and regional or institutional differences in coding quality.
Conclusion
This study constructed a novel dashboard as a method to track the mortality burden for individuals undergoing cardiac surgery at hospitals across the United States. This dashboard can help hospitals administrators and quality officers better understand institutional performance compared to similar hospitals and gives clinicians a tool to benchmark hospital outcomes data in comparison to local and national trends. These data can be then guide quality improvement initiatives and track quality changes over time, decreasing costs and improving patient care.
Acknowledgments
None to declare.
Financial Disclosure
Richard D. Urman reports unrelated funding from Merck, Medtronic, AcelRx and Pfizer.
Conflict of Interest
The authors report no conflict of interest related to this work.
Informed Consent
Not applicable.
Author Contributions
Katherine J. Greco participated in study design, data collection and writing of the manuscript. Nikhilesh Rao participated in study design, data collection and writing of the manuscript. Richard D. Urman participated in study design, data collection and writing of the manuscript. Ethan Y. Brovman participated in study design, data collection and writing of the manuscript.
Data Availability
The data supporting the findings of this study are available from the corresponding author upon reasonable request.
| References | ▴Top |
- Crossing the Quality Chasm: A New Health System for the 21st Century. Washington (DC), 2001.
- Nezic D. Differences in cardiac surgery mortality rates. Eur J Cardiothorac Surg. 2017;51(3):609.
doi pubmed - Birkmeyer JD, Siewers AE, Finlayson EV, Stukel TA, Lucas FL, Batista I, Welch HG, et al. Hospital volume and surgical mortality in the United States. N Engl J Med. 2002;346(15):1128-1137.
doi pubmed - Grover FL, Cleveland JC, Jr., Shroyer LW. Quality improvement in cardiac care. Arch Surg. 2002;137(1):28-36.
doi pubmed - Khan FM, Hameed I, Milojevic M, Wingo M, Krieger K, Girardi LN, Prager RL, et al. Quality metrics in coronary artery bypass grafting. Int J Surg. 2019;65:7-12.
doi pubmed - D'Agostino RS, Jacobs JP, Badhwar V, Fernandez FG, Paone G, Wormuth DW, Shahian DM. The Society of Thoracic Surgeons Adult Cardiac Surgery Database: 2019 Update on Outcomes and Quality. Ann Thorac Surg. 2019;107(1):24-32.
doi pubmed - The Society of Thoracic Surgeons. STS National Database. Available at https://www.sts.org/registries-research-center/sts-national-database. Accessed November 3, 2020.
- Dowding D, Randell R, Gardner P, Fitzpatrick G, Dykes P, Favela J, Hamer S, et al. Dashboards for improving patient care: review of the literature. Int J Med Inform. 2015;84(2):87-100.
doi pubmed - Buttigieg SC, Pace A, Rathert C. Hospital performance dashboards: a literature review. J Health Organ Manag. 2017;31(3):385-406.
doi pubmed - Stone AB, Jones MR, Rao N, Urman RD. A dashboard for monitoring opioid-related adverse drug events following surgery using a National Administrative Database. Am J Med Qual. 2019;34(1):45-52.
doi pubmed - Wong T, Brovman EY, Rao N, Tsai MH, Urman RD. A dashboard prototype for tracking the impact of diabetes on hospital readmissions using a National Administrative Database. J Clin Med Res. 2020;12(1):18-25.
doi pubmed - Twohig PA, Rivington JR, Gunzler D, Daprano J, Margolius D. Clinician dashboard views and improvement in preventative health outcome measures: a retrospective analysis. BMC Health Serv Res. 2019;19(1):475.
doi pubmed - Fletcher GS, Aaronson BA, White AA, Julka R. Effect of a real-time electronic dashboard on a rapid response system. J Med Syst. 2017;42(1):5.
doi pubmed - Linder JA, Schnipper JL, Tsurikova R, Yu DT, Volk LA, Melnikas AJ, Palchuk MB, et al. Electronic health record feedback to improve antibiotic prescribing for acute respiratory infections. Am J Manag Care. 2010;16(12 Suppl HIT):e311-319.
- Zaydfudim V, Dossett LA, Starmer JM, Arbogast PG, Feurer ID, Ray WA, May AK, et al. Implementation of a real-time compliance dashboard to help reduce SICU ventilator-associated pneumonia with the ventilator bundle. Arch Surg. 2009;144(7):656-662.
doi pubmed - McMenamin J, Nicholson R, Leech K. Patient Dashboard: the use of a colour-coded computerised clinical reminder in Whanganui regional general practices. J Prim Health Care. 2011;3(4):307-310.
doi pubmed - Centers for Medicare and Medicaid Services. QualityNet, Data Validation. Available at: https://www.qualitynet.org/outpatient/data-management/data-validation. Accessed November 3, 2020.
- Prasad A, Helder MR, Brown DA, Schaff HV. Understanding differences in administrative and audited patient data in cardiac surgery: comparison of the university health system consortium and society of thoracic surgeons databases. J Am Coll Surg. 2016;223(4):551-557 e554.
doi pubmed - Anand V, Cave D, McCrady H, Al-Aklabi M, Ross DB, Rebeyka IM, Adatia I. The development of a congenital heart programme quality dashboard to promote transparent reporting of outcomes. Cardiol Young. 2015;25(8):1579-1583.
doi pubmed - Pandya ST, Chakravarthy K, Vemareddy A. Obstetric anaesthesia practice: Dashboard as a dynamic audit tool. Indian J Anaesth. 2018;62(11):838-843.
doi pubmed - Koopman RJ, Kochendorfer KM, Moore JL, Mehr DR, Wakefield DS, Yadamsuren B, Coberly JS, et al. A diabetes dashboard and physician efficiency and accuracy in accessing data needed for high-quality diabetes care. Ann Fam Med. 2011;9(5):398-405.
doi pubmed - Auerbach AD, Hilton JF, Maselli J, Pekow PS, Rothberg MB, Lindenauer PK. Shop for quality or volume? Volume, quality, and outcomes of coronary artery bypass surgery. Ann Intern Med. 2009;150(10):696-704.
doi pubmed
This article is distributed under the terms of the Creative Commons Attribution Non-Commercial 4.0 International License, which permits unrestricted non-commercial use, distribution, and reproduction in any medium, provided the original work is properly cited.
Cardiology Research is published by Elmer Press Inc.