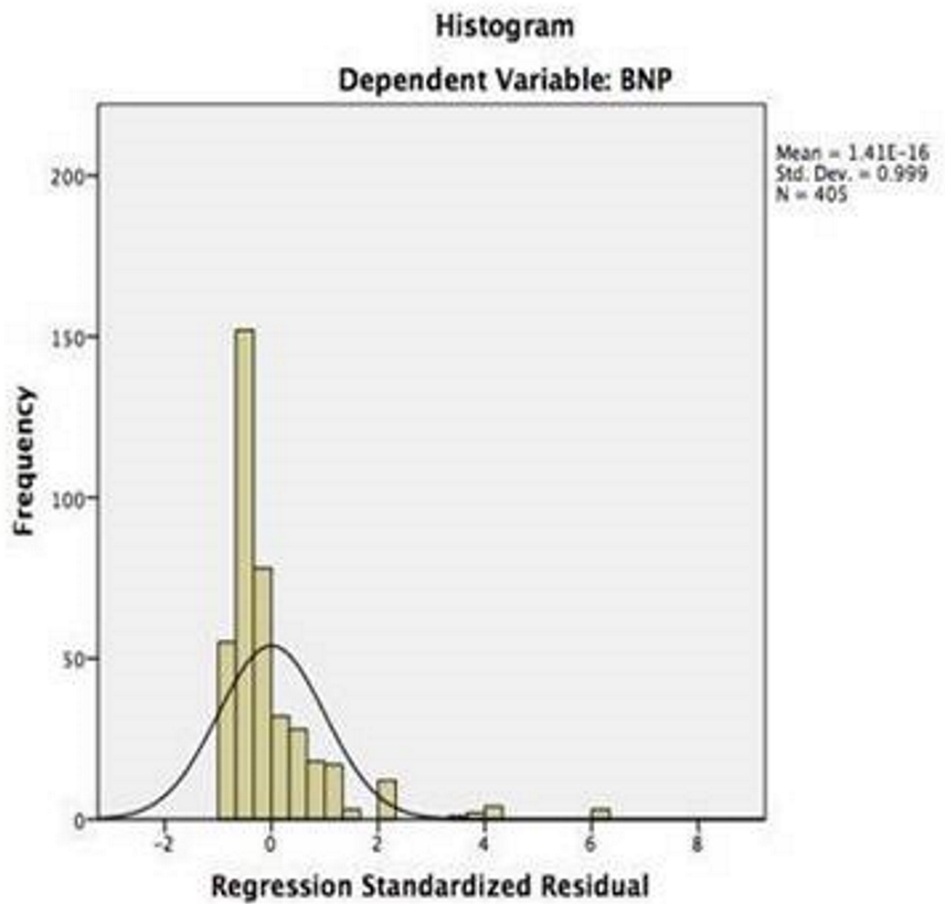
Figure 1. Normal distribution curve for the BNP across the central tendency.
| Cardiology Research, ISSN 1923-2829 print, 1923-2837 online, Open Access |
| Article copyright, the authors; Journal compilation copyright, Cardiol Res and Elmer Press Inc |
| Journal website http://www.cardiologyres.org |
Original Article
Volume 10, Number 4, August 2019, pages 211-215
Importance of Basal Metabolic Index in the Diagnosis of Heart Failure With B-Type Natriuretic Peptide
Figures
Tables
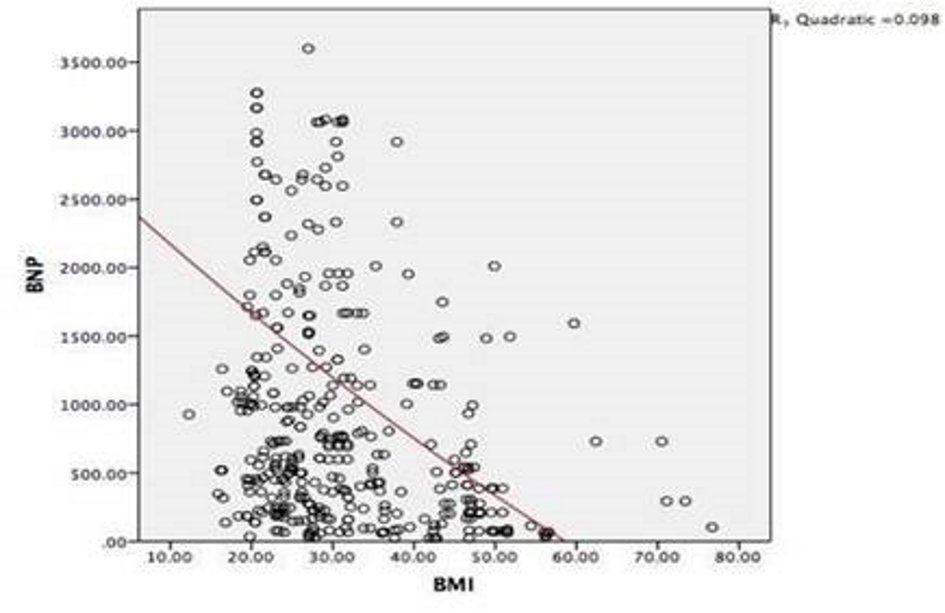
| Mean | Standard deviation | r | r2 | P value | Adjusted r2 | Standard error | |
|---|---|---|---|---|---|---|---|
| BNP | 1,158.27 | 1,536.81 | 0.16 | 0.028 | 0.001 | 0.025 | 1,517.2 |
| BMI | 33.31 | 28.19 |
| Model | Unstandardized coefficients | Standardized coefficients | t | Sig. | 95.0% CI | ||
|---|---|---|---|---|---|---|---|
| B | Standard error | Beta | Lower | Upper | |||
| BMI | -9.06 | 2.68 | -0.16 | -3.38 | .001 | -14.335 | -3.795 |
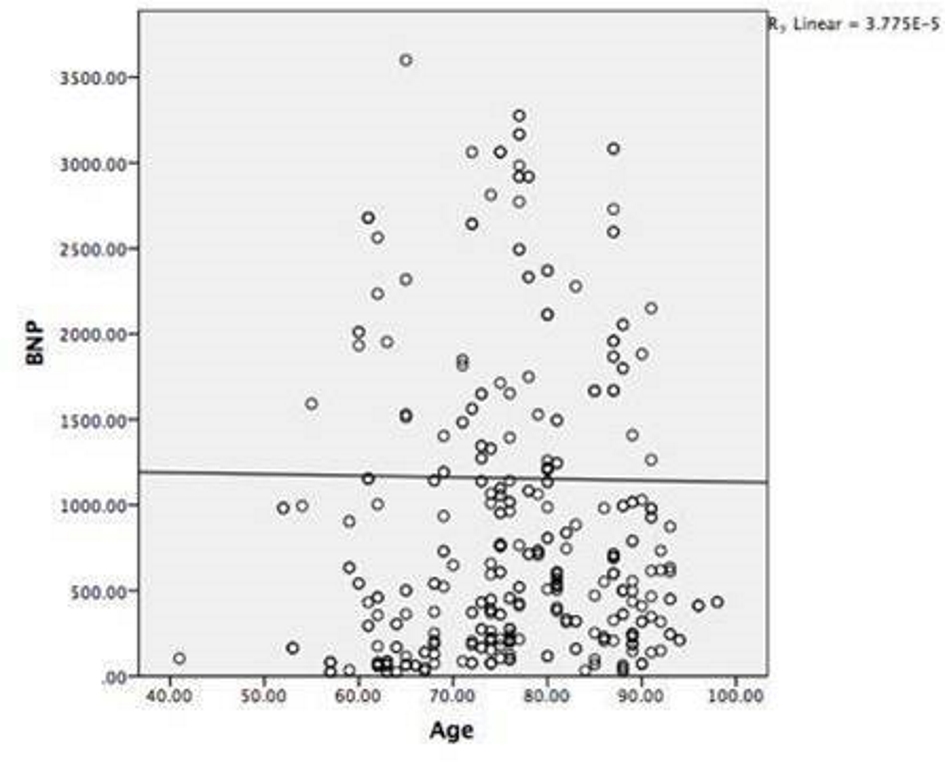
| Mean | Standardized deviation | r | P value | r2 | Adjusted r2 | |
|---|---|---|---|---|---|---|
| BNP | 1,155.7259 | 1,535.76869 | -0.006 | 0.451 | 0.000 | -0.002 |
| Age | 76.5136 | 10.19527 |
| Model | Unstandardized coefficients | Standardized coefficients | t | Sig. | 95.0% CI | ||
|---|---|---|---|---|---|---|---|
| B | Standard error | Beta | Lower | Upper | |||
| Age | -0.92 | 7.50 | -0.006 | -0.12 | 0.90 | -15.67 | 13.82 |