Figures
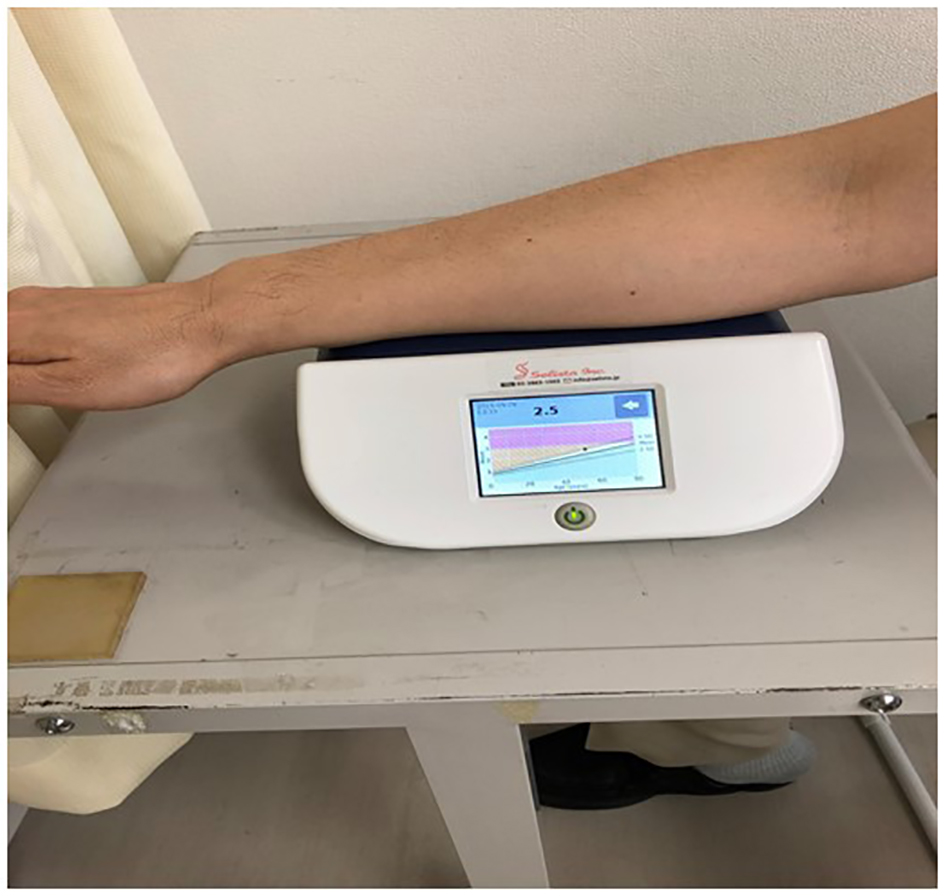
Figure 1. Measuring method of skin AF. Skin AF was automatically measured using a commercial instrument. With patients seated, all measurements were taken at the volar side of the lower arm, approximately 10 - 15 cm below the elbow. AF was defined as the average light intensity per nanometer between 300 and 420 nm. The skin AF levels were expressed in arbitrary unit. AF: autofluorescence.
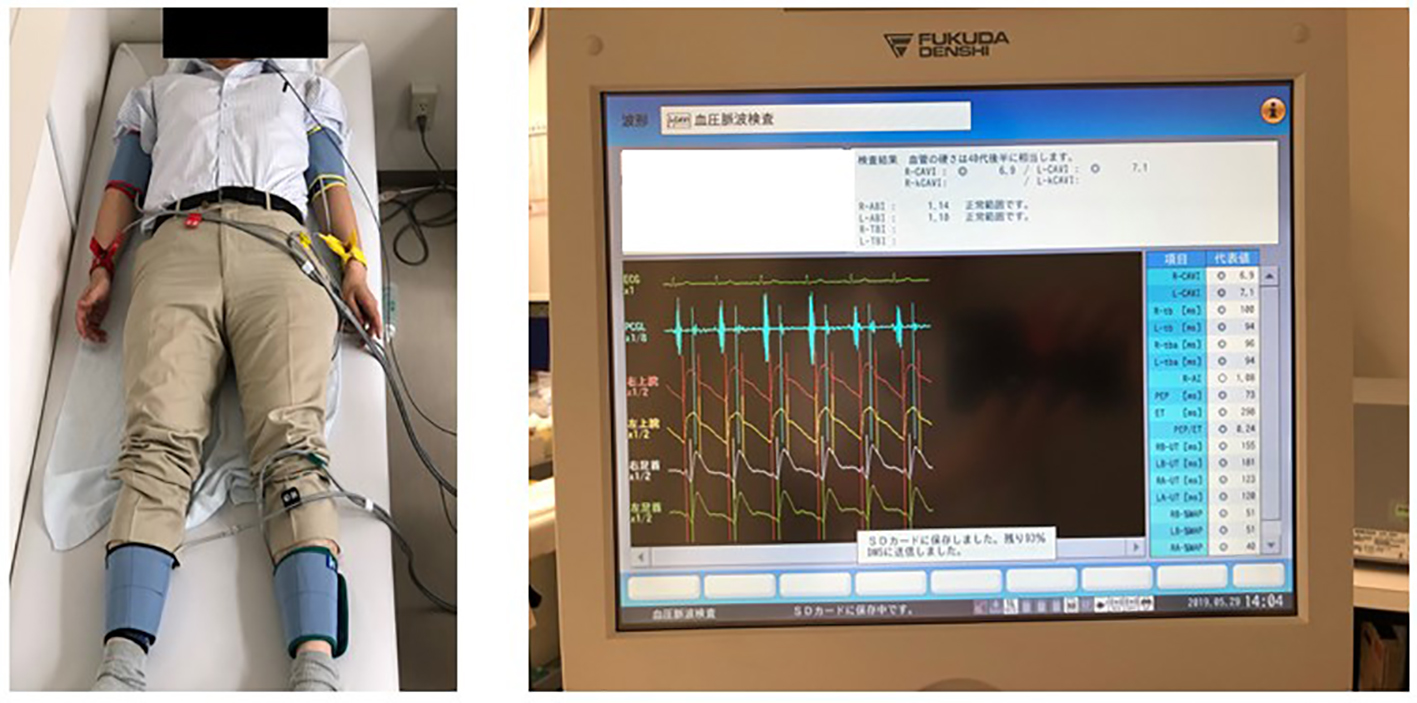
Figure 2. Measuring method of CAVI. The brachial and ankle pulse waves were determined using inflatable cuffs with the pressure maintained between 30 and 50 mm Hg to ensure that the cuff pressure had a minimal effect on the systemic hemodynamics. Blood and pulse pressures were determined simultaneously with the subjects lying supine, after they had first rested for 10 min in a quiet room. CAVI was calculated using the following formula: CAVI = a{(2ρ/ΔP) × ln (Ps/Pd)PWV2} + b, where a and b are constants, ρ is blood density and ΔP is Ps - Pd. CAVI: cardio-ankle vascular index; Ps: systolic blood pressure; Pd: diastolic blood pressure; PWV: pulse wave velocity.
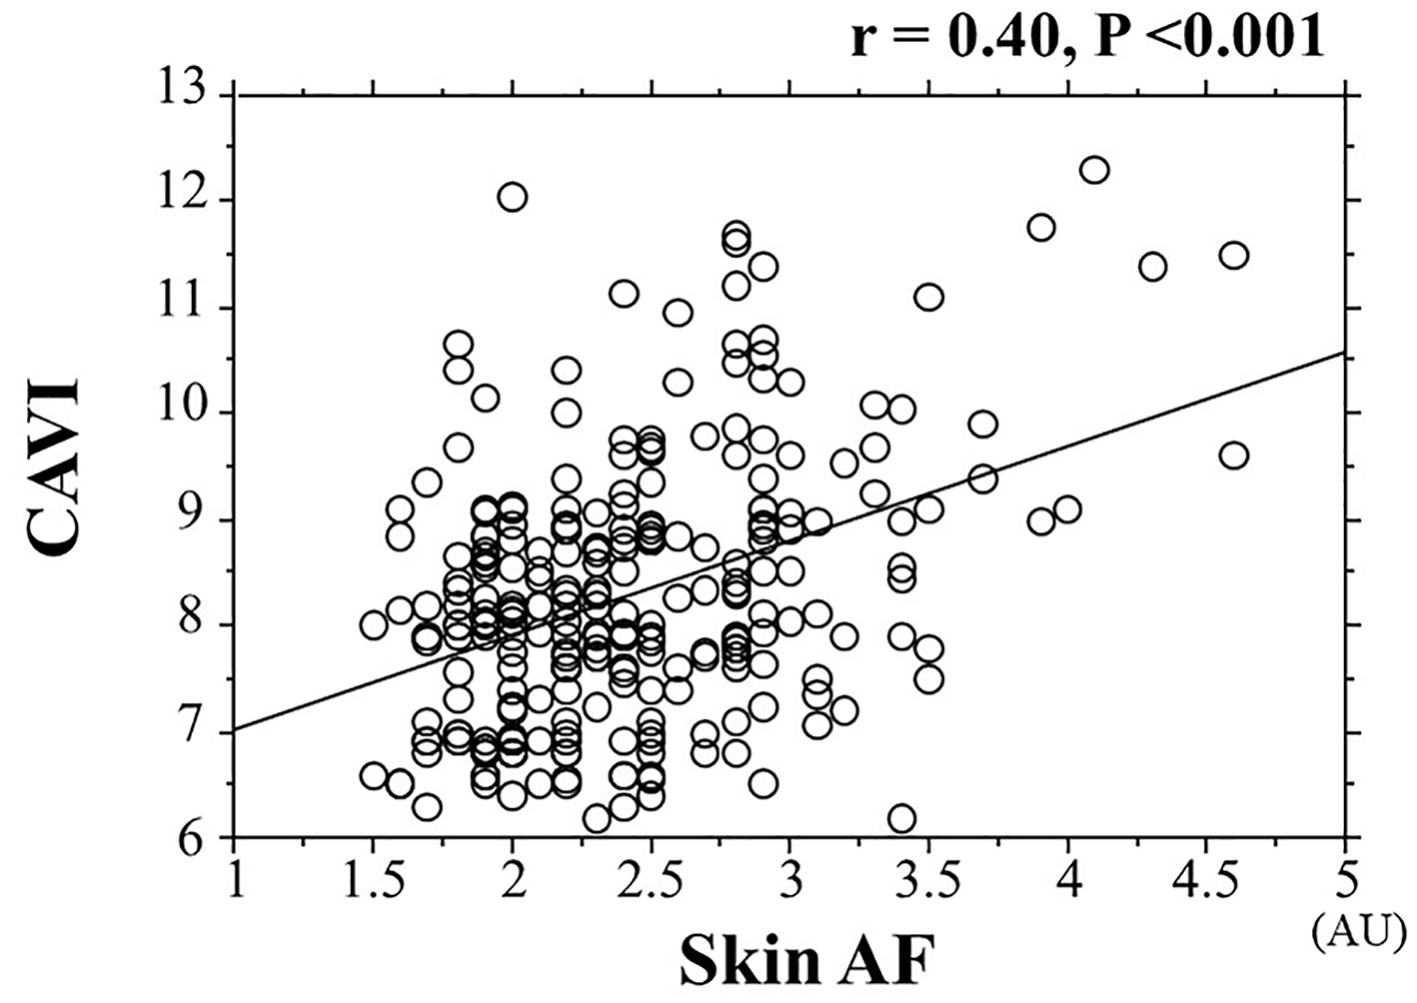
Figure 3. Correlation between skin AF and CAVI. AF: autofluorescence; CAVI: cardio-ankle vascular index; AU: arbitrary unit.
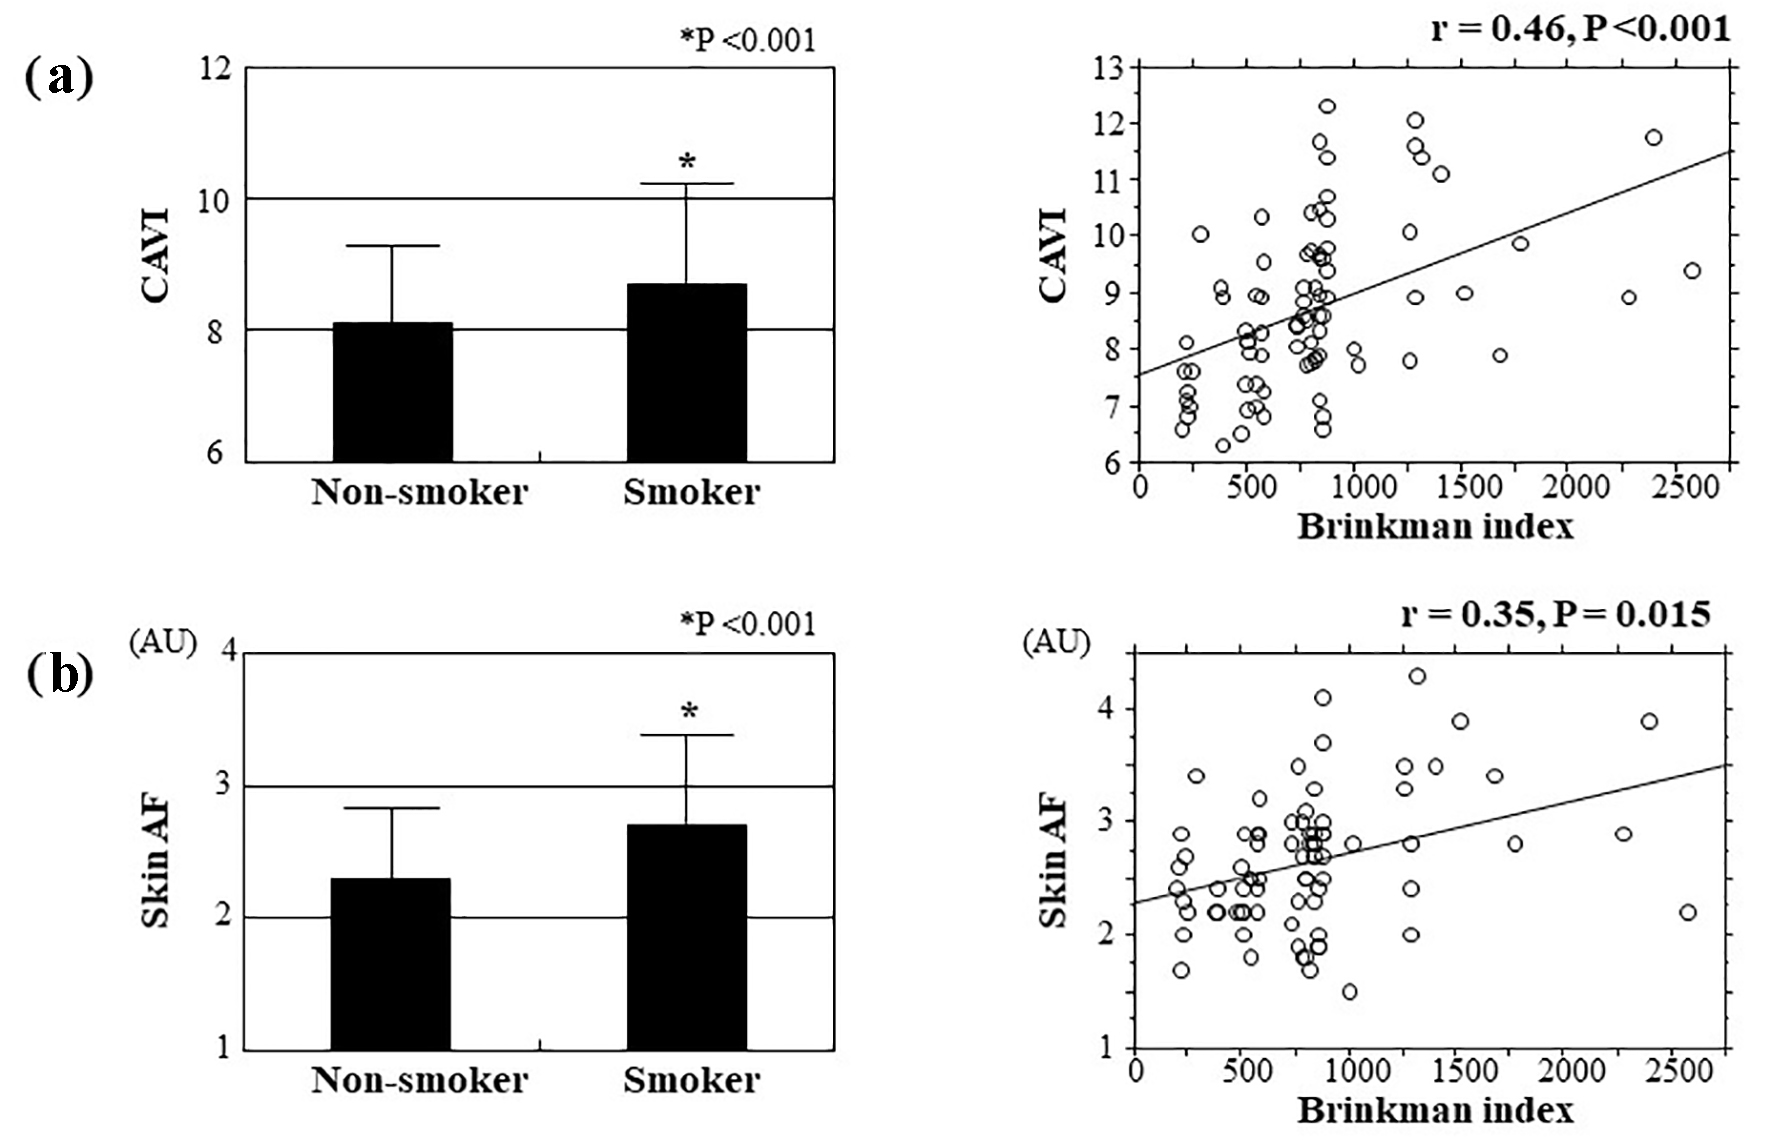
Figure 4. Relations between smoking habits and CAVI and skin AF. Both CAVI (smoker vs. non-smoker: 8.7 ± 1.4 vs. 8.1 ± 1.1, respectively, P < 0.001) and skin AF (smoker vs. non-smoker: 2.7 ± 0.6 AU vs. 2.3 ± 0.5 AU, respectively, P < 0.001) were significantly higher in patients who are smokers than in those who are non-smokers. In addition, both CAVI and skin AF were significantly positively correlated with Brinkman index as a marker of smoking exposure. (a) Relations between smoking habits and CAVI. (b) Relations between smoking habits and skin AF. CAVI: cardio-ankle vascular index; AF: autofluorescence; AU: arbitrary unit.
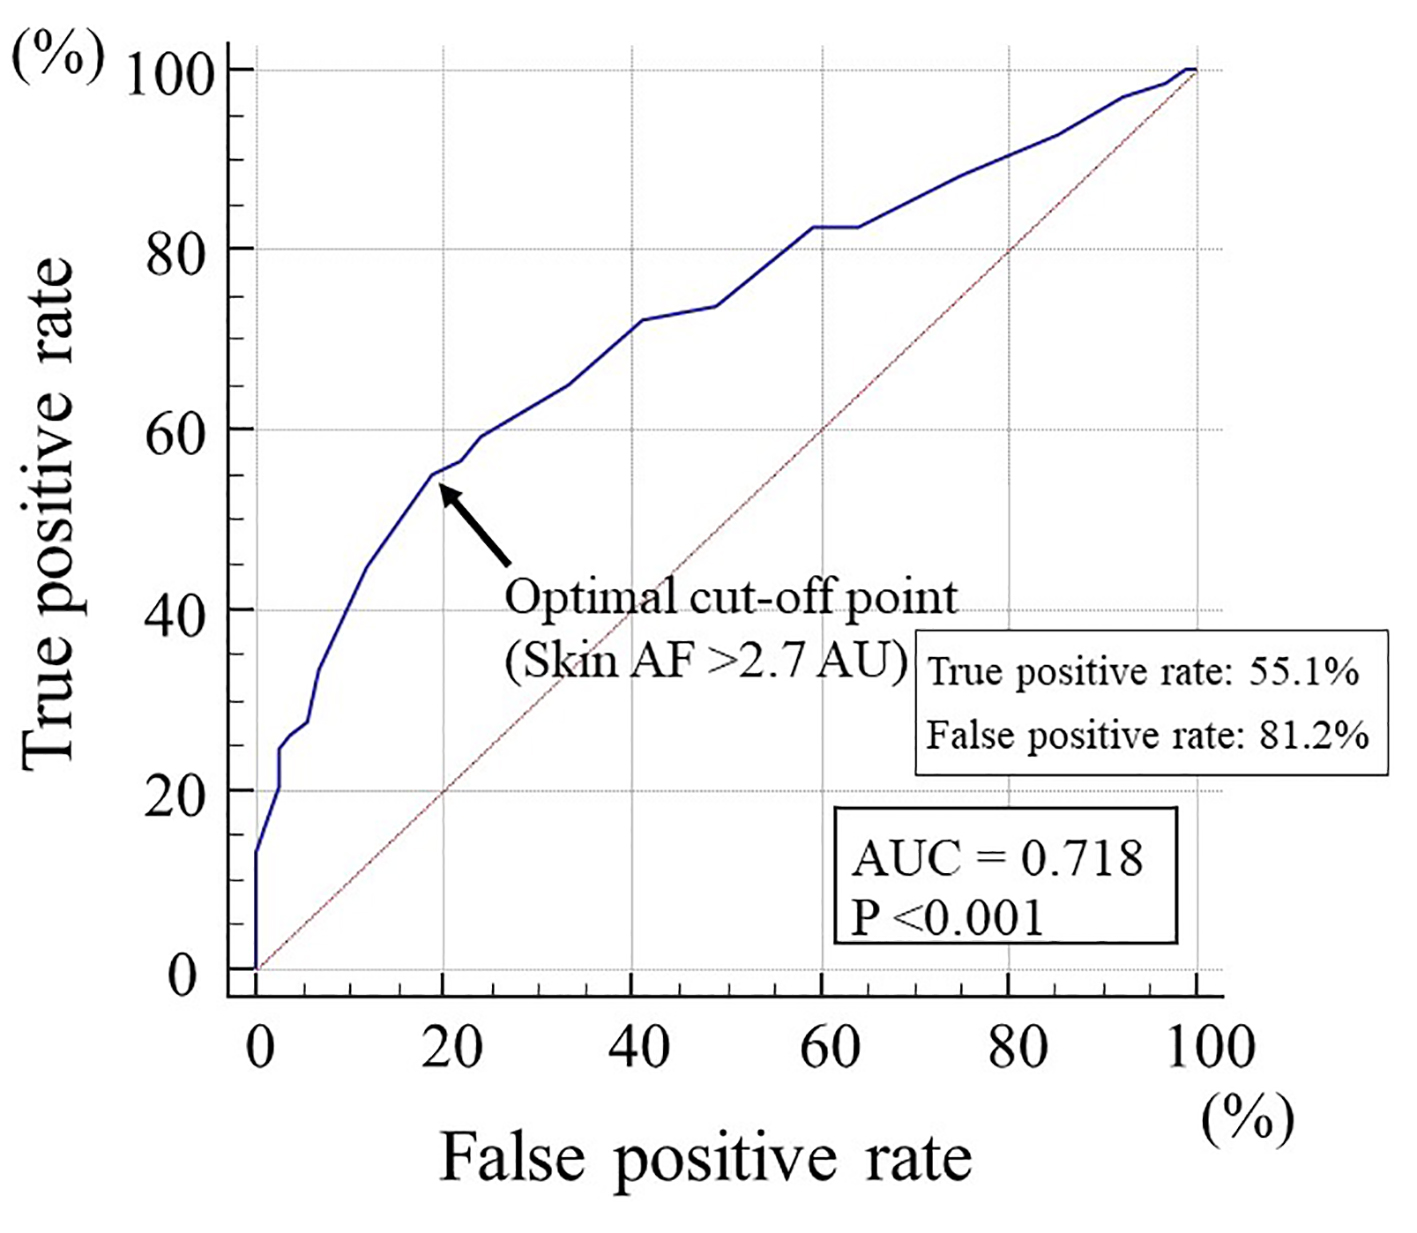
Figure 5. The receiver-operating characteristic curve analysis for the detection of high CAVI based on skin AF. The maximum Youden’s index indicated that skin AF of > 2.7 AU was the optimal cut-off point to determine the high CAVI of ≥ 9.0. AF: autofluorescence; CAVI: cardio-ankle vascular index; AU: arbitrary unit; AUC: area under the curve.
Tables
Table 1. Patient Characteristics
| Continuous values are mean ± SD. LDL: low-density lipoprotein; HDL: high-density lipoprotein; HOMA-IR: homeostasis assessment insulin resistance; hs-CRP: high-sensitivity C-reactive protein; AF: autofluorescence; AU: arbitrary unit; CAVI: cardio-ankle vascular index. |
| n | 261 |
| Age (years) | 58 ± 7 |
| Body mass index (kg/m2) | 25.1 ± 3.1 |
| West circumference (cm) | 90 ± 5 |
| Smoker, n (%) | 80 (31) |
| Systolic blood pressure (mm Hg) | 141 ± 17 |
| Diastolic blood pressure (mm Hg) | 84 ± 13 |
| Pulse rate (/min) | 72 ± 11 |
| Laboratory findings | |
| Total cholesterol (mg/dL) | 226 ± 43 |
| LDL-cholesterol (mg/dL) | 141 ± 40 |
| Triglyceride (mg/dL) | 204 ± 59 |
| HDL-cholesterol (mg/dL) | 44 ± 14 |
| Fasting blood glucose (mg/dL) | 113 ± 18 |
| HOMA-IR | 2.8 ± 1.4 |
| Log-hs-CRP (mg/dL) | -1.1 ± 0.5 |
| Skin AF (AU) | 2.4 ± 0.6 |
| CAVI | 8.3 ± 1.3 |
Table 2. Relationships Among CAVI, Skin AF and Various Clinical Parameters
| r |
|---|
| CAVI | Skin AF |
|---|
| r expressed correlation coefficient. *P < 0.05, **P < 0.01, ***P < 0.001. CAVI: cardio-ankle vascular index; AF: autofluorescence; LDL: low-density lipoprotein; HDL: high-density lipoprotein; HOMA-IR: homeostasis assessment insulin resistance; hs-CRP: high-sensitivity C-reactive protein; Mets: metabolic syndrome. |
| Age | 0.48*** | 0.21*** |
| Body mass index | 0.10 | 0.08 |
| West circumference | 0.05 | 0.03 |
| Systolic blood pressure | 0.12* | 0.08 |
| Diastolic blood pressure | 0.08 | 0.10 |
| Pulse rate | 0.06 | 0.02 |
| Total cholesterol | 0.03 | 0.02 |
| LDL cholesterol | 0.05 | 0.02 |
| Triglyceride | 0.03 | 0.03 |
| HDL cholesterol | -0.06 | -0.03 |
| Fasting blood glucose | 0.18** | 0.10 |
| HOMA-IR | 0.24*** | 0.34*** |
| Log-hs-CRP | 0.33*** | 0.34*** |
| Number of Mets components | 0.13* | 0.09 |
Table 3. Multiple Regression Analysis
| Explanatory factor | β | P value |
|---|
| (A) Subordinate factor is CAVI: R2 = 0.39; P < 0.001. (B) Subordinate factor is skin AF: R2 = 0.29; P < 0.001. AF: autofluorescence; hs-CRP: high-sensitivity C-reactive protein; HOMA-IR: homeostatic model assessment of insulin resistance; Mets: metabolic syndrome; CAVI: cardio-ankle vascular index. |
| (A) | | |
| Age | 0.39 | < 0.001 |
| Skin AF | 0.18 | 0.002 |
| Smoker | 0.16 | 0.003 |
| Log-hs-CRP | 0.15 | 0.005 |
| HOMA-IR | 0.11 | 0.045 |
| Systolic blood pressure | 0.06 | 0.258 |
| Fasting blood glucose | 0.05 | 0.465 |
| Number of Mets components | 0.03 | 0.570 |
| (B) | | |
| HOMA-IR | 0.24 | < 0.001 |
| CAVI | 0.21 | 0.002 |
| Log-hs-CRP | 0.19 | 0.007 |
| Smoker | 0.18 | 0.008 |
| Age | 0.06 | 0.343 |