Figures
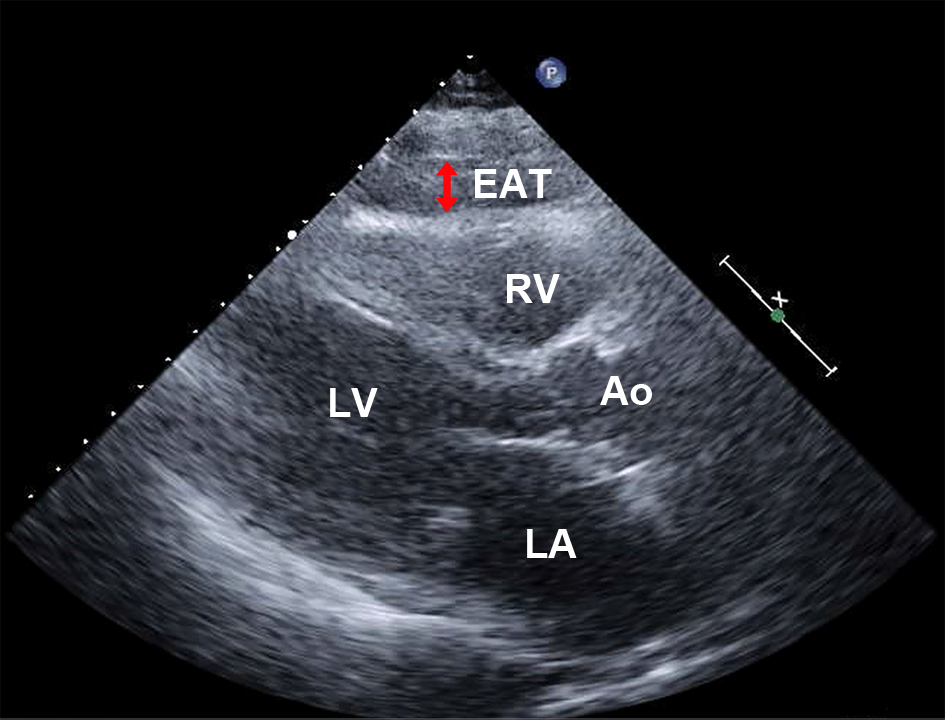
Figure 1. Measurement of the EAT using echocardiography. EAT was detected as an echo-free space between the outer wall of the right ventricle and visceral layer of the pericardium during the end-diastolic cardiac cycle (double arrow). Ao: aorta; EAT: epicardial adipose tissue; LA: left atrium; LV: left ventricle; RV: right ventricle.
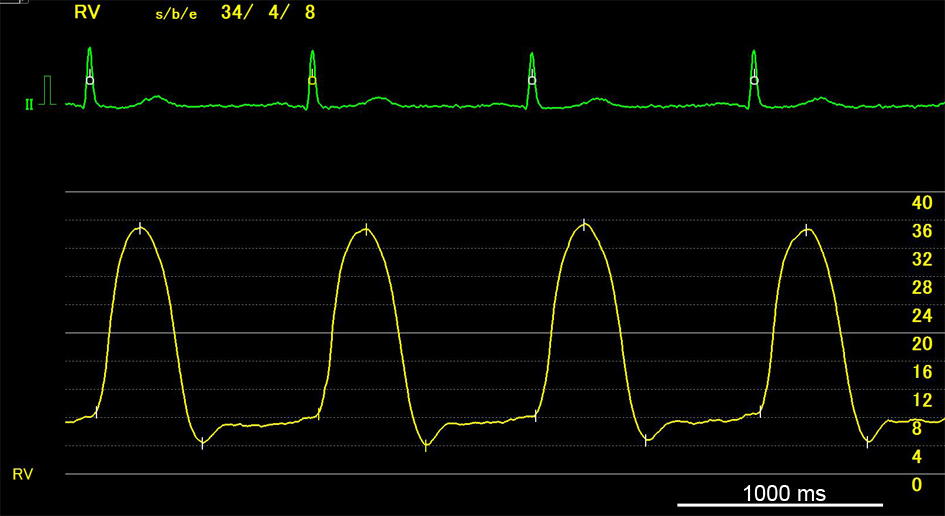
Figure 2. A representative plateau pattern of the right ventricular waveform.
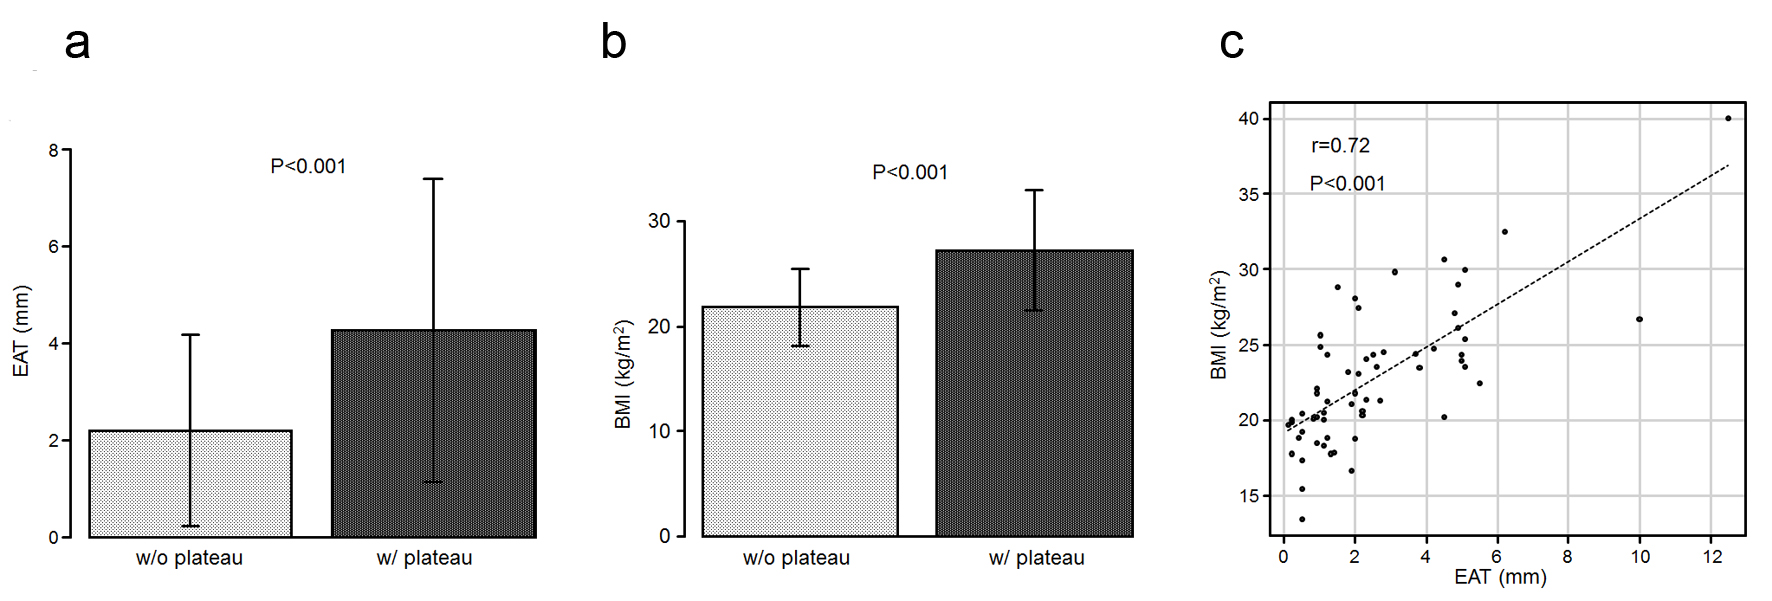
Figure 3. (a) The EAT values in the patients who exhibited a plateau pattern (w/plateau) are significantly higher than those in the patients who did not (w/o plateau). (b) The mean BMI values are higher in the patients with a plateau than in those without it. (c) Scatter plots between the EAT and BMI. BMI: body mass index; EAT: epicardial adipose tissue.
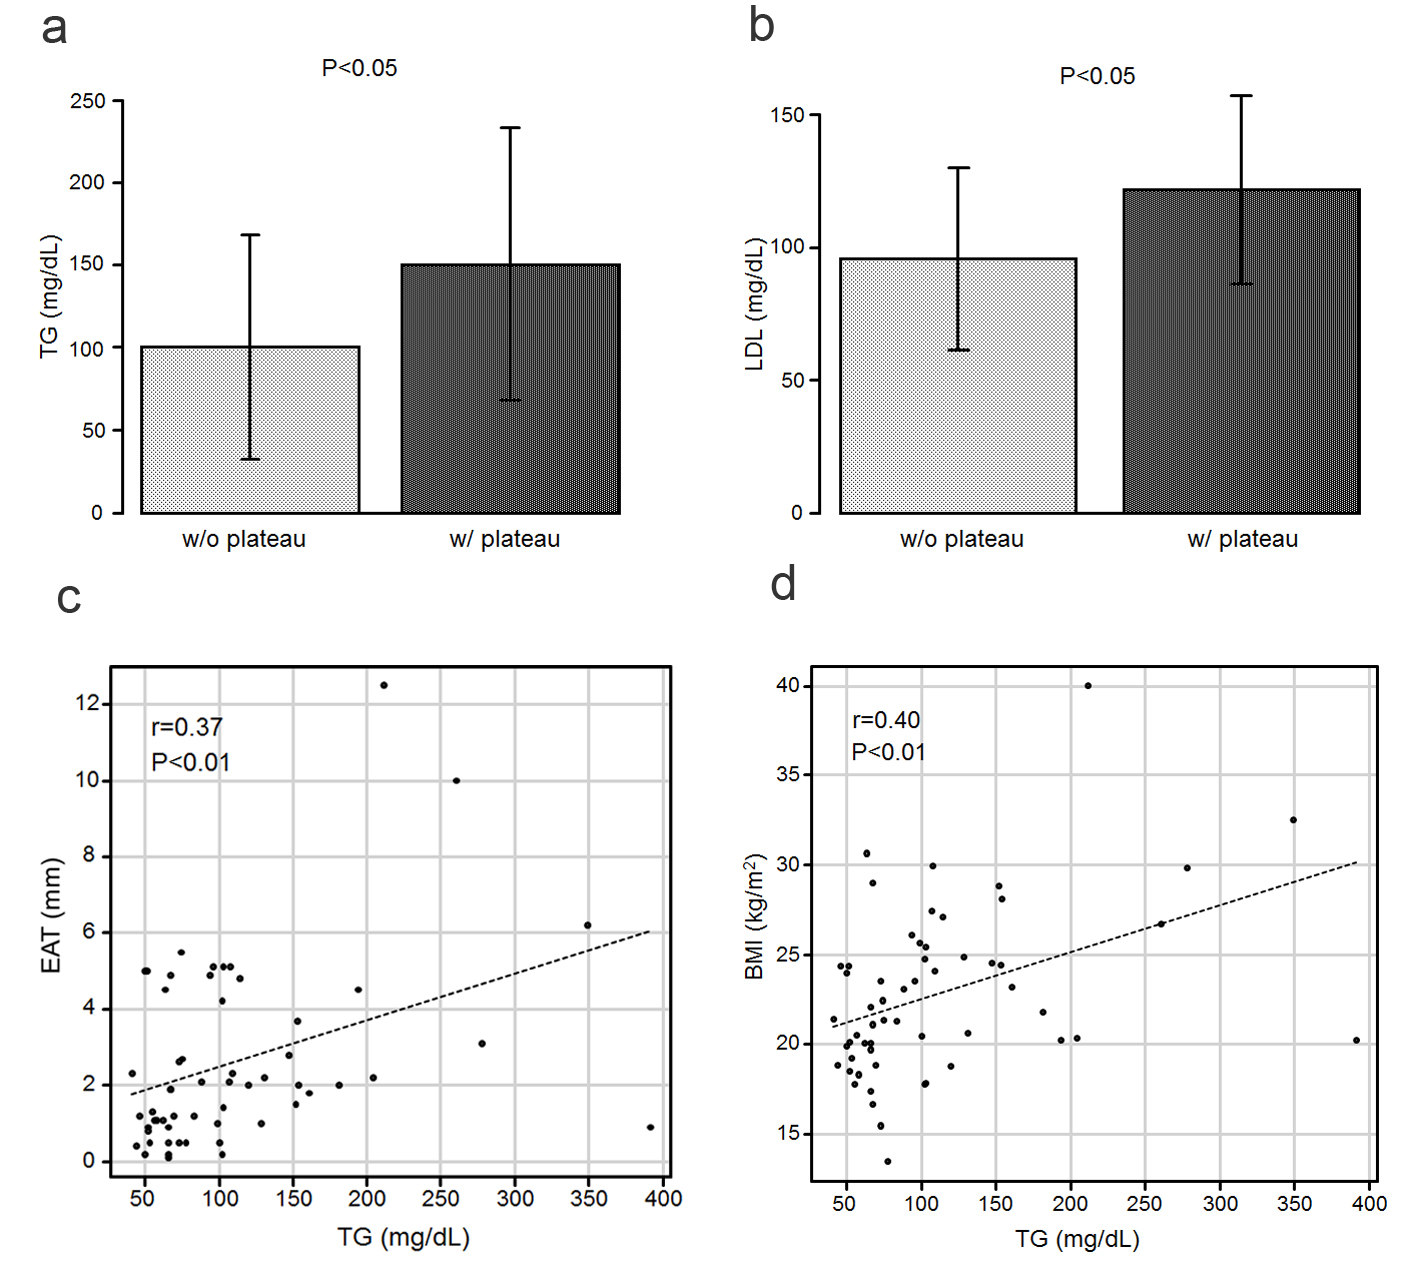
Figure 4. (a) The TG levels in the patients who exhibited a plateau pattern (w/plateau) are significantly higher than in those who did not (w/o plateau). (b) The LDL-C levels in the patients with a plateau are significantly higher than those in the patients without a plateau. (c) Scatter plots between the TG level and EAT. (d) Scatter plots between the TG level and BMI. BMI: body mass index; EAT: epicardial adipose tissue; LDL-C: low-density lipoprotein cholesterol; TG: triglyceride.
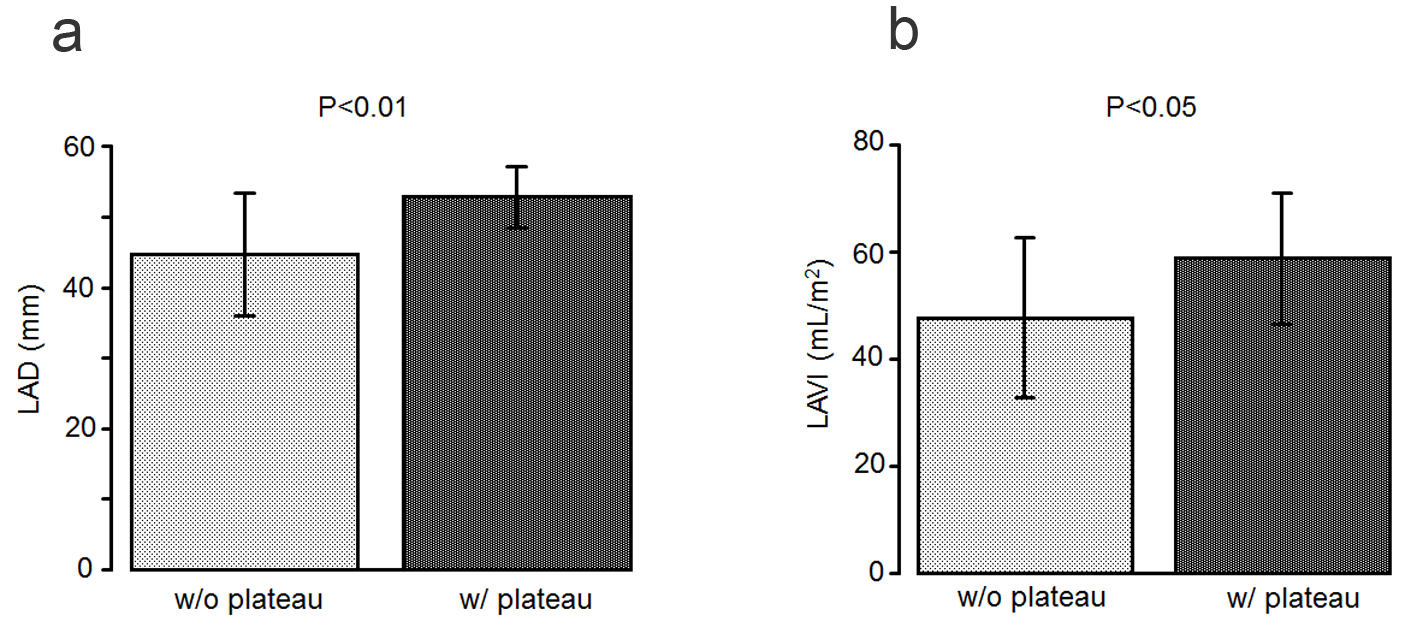
Figure 5. (a) The left atrial diameter is significantly larger in the patients with a plateau pattern (w/plateau) than in those without it (w/o plateau). (b) The left atrial volume index is significantly higher in the patients with a plateau pattern than in those without it.
Tables
Table 1. Comparison of the Clinical and Laboratory Characteristics of Patients Without and With a Plateau Pattern
| Without a plateau (n = 49) | With a plateau (n = 11) | P value |
|---|
| Data are expressed as the mean ± SD or n (%). BMI: body mass index; BP: blood pressure; EAT: epicardial adipose tissue; HbA1c: glycated hemoglobin; HDL-C: high-density lipoprotein cholesterol; LDL-C: low-density lipoprotein cholesterol; PPG: postprandial plasma glucose; TC: total cholesterol; TG: triglyceride. |
| Age (years) | 69.3 ± 13.4 | 69.9 ± 16.8 | 0.90 |
| Male | 28 (57%) | 5 (45%) | 0.52 |
| Weight (kg) | 55.5 ± 12.2 | 69.0 ± 14.2 | < 0.01 |
| Height (m) | 1.58 ± 0.09 | 1.59 ± 0.08 | 0.89 |
| BMI (kg/m2) | 21.8 ± 3.6 | 27.2 ± 5.7 | < 0.001 |
| EAT (mm) | 2.19 ± 1.97 | 4.26 ± 3.13 | < 0.01 |
| Systolic BP (mm Hg) | 129.2 ± 23.5 | 133.2 ± 23.0 | 0.61 |
| Diastolic BP (mm Hg) | 67.7 ± 13.6 | 76.7 ± 16.0 | 0.06 |
| Heart rate (beats/min) | 70.8 ± 14.3 | 73.6 ± 15.1 | 0.56 |
| TC (mg/dL) | 170.3 ± 42.2 | 196.2 ± 47.9 | 0.08 |
| HDL-C (mg/dL) | 57.7 ± 18.5 | 51.1 ± 27.3 | 0.34 |
| LDL-C (mg/dL) | 95.8 ± 34.1 | 121.8 ± 35.6 | < 0.05 |
| TG (mg/dL) | 100.2 ± 67.9 | 150.4 ± 82.6 | < 0.05 |
| HbA1c (%) | 6.4 ± 1.59 | 6.2 ± 0.77 | 0.75 |
| PPG (mg/dL) | 126 ± 62.8 | 120 ± 27.9 | 0.79 |
Table 2. Comparison of the Right Cardiac Catheterization Characteristics of Patients Without and With a Plateau Pattern
| Without a plateau (n = 49) | With a plateau (n = 11) | P value |
|---|
| Data are expressed as the mean ± SD. PA: pulmonary artery; PCWP: pulmonary capillary wedge pressure; RA: right atrium; RV: right ventricle. |
| Cardiac output (L/min) | 4.93 ± 1.37 | 5.18 ± 1.73 | 0.61 |
| Cardiac index (L/min/m2) | 3.21 ± 0.94 | 2.97 ± 0.82 | 0.46 |
| Main PA systolic pressure (mm Hg) | 33.5 ± 12.8 | 35.7 ± 10.1 | 0.63 |
| Main PA diastolic pressure (mm Hg) | 15.9 ± 7.19 | 16.3 ± 6.5 | 0.88 |
| Main PA mean pressure (mm Hg) | 23.0 ± 9.51 | 23.8 ± 9.11 | 0.81 |
| Right PA systolic pressure (mm Hg) | 33.3 ± 12.4 | 35.7 ± 10.0 | 0.56 |
| Right PA diastolic pressure (mm Hg) | 16.4 ± 7.11 | 15.7 ± 6.88 | 0.75 |
| Right PA mean pressure (mm Hg) | 22.9 ± 9.39 | 23.7 ± 9.18 | 0.79 |
| Mean PCWP (mm Hg) | 14.4 ± 7.61 | 14.3 ± 6.63 | 0.96 |
| RV systolic pressure (mm Hg) | 33.0 ± 11.7 | 33.2 ± 10.9 | 0.94 |
| RV diastolic pressure (mm Hg) | 5.67 ± 4.39 | 4.54 ± 2.20 | 0.41 |
| RV end-diastolic pressure (mm Hg) | 9.00 ± 4.07 | 9.18 ± 3.68 | 0.89 |
| Mean RA (mm Hg) | 6.59 ± 3.85 | 6.81 ± 3.06 | 0.85 |
Table 3. Comparison of the Echocardiographic Characteristics of Patients Without and With a Plateau Pattern
| Without a plateau (n = 49) | With a plateau (n = 11) | P value |
|---|
| Data are expressed as the mean ± SD. DT: mitral deceleration time; e’: mitral annulus early peak velocity; EF: ejection fraction; IVC ex: inferior vena cava expiration; IVC in: inferior vena cava inspiration; IVCCI: IVC collapsibility index; IVSd: interventricular septum diameter; LAD: left atrial diameter; LAVI: left atrial volume index; LVDd: left ventricular end-diastolic diameter; LVDs: left ventricular end-systolic diameter; LVMI: left ventricular mass index; PWd: posterior wall diameter; RWT: relative wall thickness. |
| LVDd (mm) | 51.2 ± 9.87 | 48.5 ± 8.53 | 0.40 |
| LVDs (mm) | 37.8 ± 12.2 | 35.0 ± 10.6 | 0.48 |
| IVSd (mm) | 10.9 ± 2.16 | 11.4 ± 1.17 | 0.42 |
| PWd (mm) | 10.4 ± 1.92 | 11.1 ± 0.50 | 0.27 |
| EF (%) | 49.4 ± 20.5 | 50.1 ± 19.5 | 0.91 |
| LVMI (g/m2) | 141.4 ± 70.6 | 115.7 ± 32.9 | 0.26 |
| RWT | 0.435 ± 0.096 | 0.476 ± 0.069 | 0.21 |
| E/A ratio | 1.28 ± 0.69 | 1.60 ± 0.92 | 0.40 |
| DT (ms) | 187.5 ± 60.4 | 173.0 ± 48.0 | 0.52 |
| e’ (cm/s) | 5.66 ± 2.16 | 7.15 ± 1.81 | 0.11 |
| E/e’ (ratio) | 16.3 ± 7.95 | 16.5 ± 6.14 | 0.95 |
| LAD (mm) | 44.7 ± 8.69 | 52.8 ± 4.30 | < 0.01 |
| LAVI (mL/m2) | 47.6 ± 14.9 | 58.7 ± 12.1 | < 0.05 |
| IVC ex (mm) | 15.8 ± 4.68 | 17.8 ± 6.75 | 0.25 |
| IVC in (mm) | 6.87 ± 4.99 | 10.0 ± 8.49 | 0.09 |
| IVCCI | 58.9 ± 20.1 | 50.2 ± 24.9 | 0.25 |