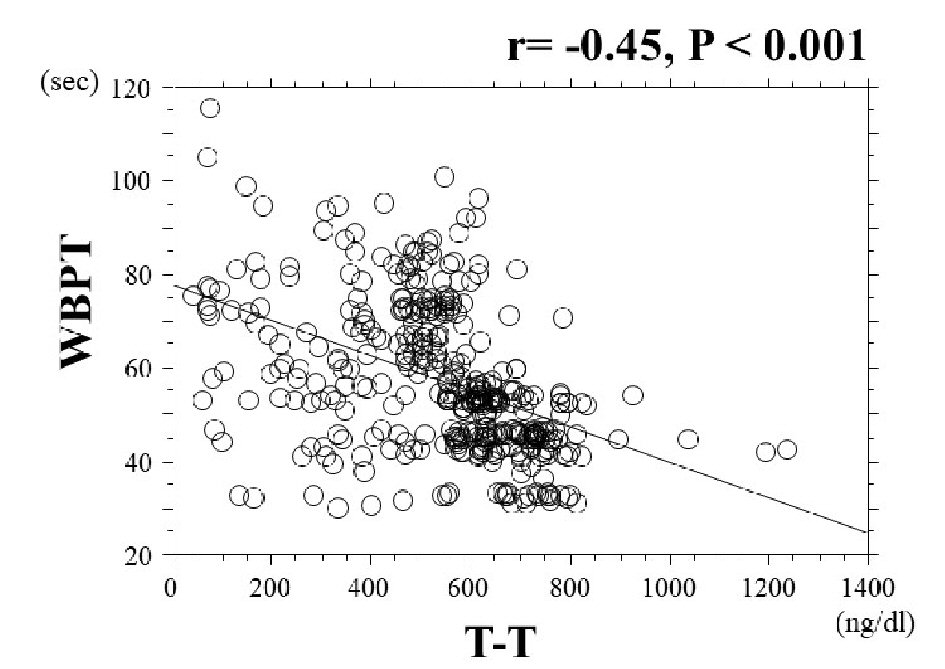
Figure 1. The association between T-T and WBPT. There was a significantly negative correlation between T-T and WBPT (r = -0.45, P < 0.001). T-T: total testosterone; WBPT: whole blood passage time.
| Cardiology Research, ISSN 1923-2829 print, 1923-2837 online, Open Access |
| Article copyright, the authors; Journal compilation copyright, Cardiol Res and Elmer Press Inc |
| Journal website http://www.cardiologyres.org |
Original Article
Volume 10, Number 2, April 2019, pages 106-113
Clinical Significance of Low Blood Testosterone Concentration in Men as a Cardiovascular Risk Factor From the Perspective of Blood Rheology
Figures
Tables
| Data are expressed mean ± SD. BP: blood pressure; LDL: low-density lipoprotein; HDL: high-density lipoprotein; FBG: fasting blood glucose; HOMA-IR: homeostatic model assessment of insulin resistance; HbA1c: hemoglobin A1c; AF: autofluorescence; d-ROMs: derivatives of reactive oxygen metabolites; T-T: total testosterone; WBPT: whole blood passage time; RAS: renin-angiotensin system. | |
| N | 382 |
| Age (years) | 64 ± 10 |
| Body mass index (kg/m2) | 23.6 ± 3.8 |
| Current smoker; n (%) | 127 (33) |
| Hypertension; n (%) | 289 (76) |
| Systolic BP (mm Hg) | 141 ± 18 |
| Diastolic BP (mm Hg) | 89 ± 24 |
| Dyslipidemia; n (%) | 197 (52) |
| Total cholesterol (mg/dL) | 212 ± 42 |
| LDL cholesterol (mg/dL) | 139 ± 38 |
| Triglyceride (mg/dL) | 138 ± 69 |
| HDL cholesterol (mg/dL) | 45 ± 14 |
| Diabetes mellitus; n (%) | 123 (32) |
| FBG (mg/dL) | 110 ± 14 |
| HOMA-IR | 2.2 ± 1.2 |
| HbA1c (%) | 6.2 ± 1.0 |
| Skin AF (arbitrary units) | 2.7 ± 0.5 |
| White blood cell (/µL) | 6,116 ± 1,563 |
| Hematocrit (%) | 42.3 ± 4.1 |
| Platelet (104/µL) | 24 ± 6 |
| d-ROMs test (U. Carr) | 320 ± 96 |
| T-T (ng/dL) | 567.9 ± 189.0 |
| WBPT (s) | 57.5 ± 15.9 |
| Medications | |
| RAS inhibitor; n (%) | 142 (37) |
| Statin; n (%) | 120 (31) |
| Anti-diabetic drugs; n (%) | 84 (22) |
| WBPT | T-T | |
|---|---|---|
| r | r | |
| Data are expressed mean ± SD. *P < 0.05; **P < 0.01; ***P < 0.001. WBPT: whole blood passage time; T-T: total testosterone; BP: blood pressure; LDL: low-density lipoprotein; HDL: high-density lipoprotein; FBG: fasting blood glucose; HOMA-IR: homeostatic model assessment of insulin resistance; HbA1c: hemoglobin A1c; AF: autofluorescence; d-ROMs: derivatives of reactive oxygen metabolites; RAS: renin-angiotensin system. | ||
| Age | -0.03 | 0.03 |
| Body mass index | 0.22*** | -0.16** |
| Current smoker (Yes = 1, No = 0) | 0.18* | -0.06 |
| Hypertension (Yes = 1, No = 0) | 0.05 | -0.07 |
| Systolic BP | 0.09 | -0.07 |
| Diastolic BP | 0.06 | -0.04 |
| Dyslipidemia (Yes = 1, No = 0) | 0.05 | 0.04 |
| Total cholesterol | 0.04 | 0.03 |
| LDL cholesterol | 0.04 | 0.04 |
| Triglyceride | 0.14** | -0.12* |
| HDL cholesterol | -0.16** | 0.11* |
| Diabetes mellitus (Yes = 1, No = 0) | 0.15** | -0.12* |
| FBG | 0.07 | -0.11* |
| HOMA-IR | 0.13* | -0.36*** |
| HbA1c | 0.10 | -0.12* |
| Skin AF | 0.49*** | -0.31*** |
| White blood cell | 0.09 | -0.03 |
| Hematocrit | 0.24*** | 0.03 |
| Platelet | 0.07 | 0.06 |
| d-ROMs test | 0.28*** | -0.25*** |
| RAS inhibitor (Yes = 1, No = 0) | -0.08 | 0.05 |
| Statin (Yes = 1, No = 0) | -0.07 | 0.04 |
| Anti-diabetic drugs (Yes = 1, No = 0) | 0.09 | 0.07 |
| Explanatory factor | β | P value |
|---|---|---|
| (A) Subordinate factor is WBPT; R2 = 0.33; P < 0.001. (B) Subordinate factor is T-T; R2 = 0.30; P < 0.001. AF: autofluorescence; T-T: total testosterone; d-ROMs: derivatives of reactive oxygen metabolites; HOMA-IR: homeostatic model assessment of insulin resistance; WBPT: whole blood passage time. | ||
| (A) Skin AF | 0.32 | < 0.001 |
| T-T | -0.25 | < 0.001 |
| Body mass index | 0.17 | < 0.001 |
| d-ROMs test | 0.14 | 0.005 |
| Hematocrit | 0.13 | 0.007 |
| Current smoker | 0.08 | 0.083 |
| (B) WBPT | -0.30 | < 0.001 |
| HOMA-IR | -0.28 | < 0.001 |
| Skin AF | -0.15 | 0.004 |
| d-ROMs test | -0.12 | 0.010 |
| Body mass index | -0.07 | 0.139 |
| T-T (ng/dL) | P value | ||
|---|---|---|---|
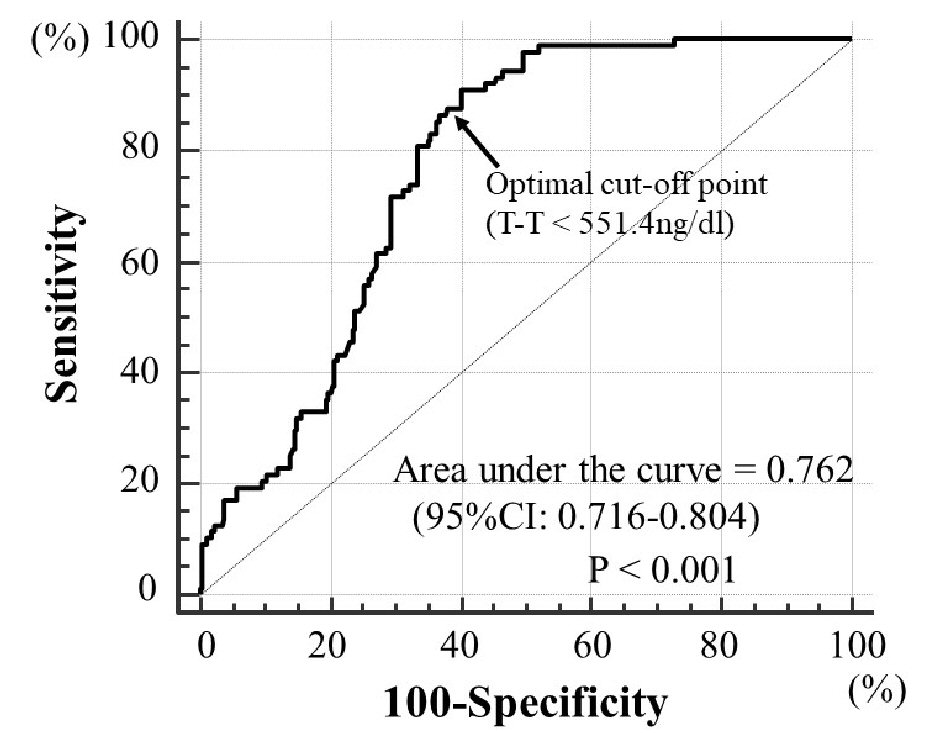
| High T-T (n = 232) ≥ 551.4 | Low T-T (n = 150) < 551.4 | ||
| Data are expressed mean ± SD. T-T: total testosterone; BP: blood pressure; LDL: low-density lipoprotein; HDL: high- density lipoprotein; FBG: fasting blood glucose; HOMA-IR: homeostatic model assessment of insulin resistance; HbA1c: hemoglobin A1c; AF: autofluorescence; d-ROMs: derivatives of reactive oxygen metabolites; WBPT: whole blood passage time; RAS: renin-angiotensin system. | |||
| Age (years) | 64 ± 11 | 64 ± 10 | 0.573 |
| Body mass index (kg/m2) | 23.2 ± 3.8 | 24.2 ± 3.8 | 0.028 |
| Current smoker; n (%) | 75 (32) | 52 (35) | 0.673 |
| Hypertension; n (%) | 172 (74) | 117 (78) | 0.424 |
| Systolic BP (mm Hg) | 140 ± 17 | 142 ± 19 | 0.159 |
| Diastolic BP (mm Hg) | 88 ± 22 | 90 ± 26 | 0.231 |
| Dyslipidemia; n (%) | 121 (52) | 76 (51) | 0.776 |
| Total cholesterol (mg/dL) | 213 ± 41 | 210 ± 44 | 0.431 |
| LDL cholesterol (mg/dL) | 140 ± 37 | 138 ± 38 | 0.534 |
| Triglyceride (mg/dL) | 136 ± 64 | 148 ± 77 | 0.078 |
| HDL cholesterol (mg/dL) | 46 ± 15 | 42 ± 12 | 0.012 |
| Diabetes mellitus; n (%) | 64 (28) | 59 (39) | 0.016 |
| FBG (mg/dL) | 107 ± 13 | 113 ± 14 | 0.018 |
| HOMA-IR | 1.9 ± 1.1 | 2.6 ± 1.2 | < 0.001 |
| HbA1c (%) | 6.1 ± 1.0 | 6.4 ± 1.1 | 0.025 |
| Skin AF (arbitrary units) | 2.6 ± 0.5 | 2.9 ± 0.5 | < 0.001 |
| White blood cell (/µL) | 6,080 ± 1,524 | 6,171 ± 1,624 | 0.583 |
| Hematocrit (%) | 42.3 ± 4.1 | 42.2 ± 4.1 | 0.894 |
| Platelet (104/µL) | 24 ± 6 | 24 ± 6 | 0.956 |
| d-ROMs test (U. Carr) | 305 ± 94 | 342 ± 95 | < 0.001 |
| WBPT (s) | 51.8 ± 12.9 | 66.2 ± 16.2 | < 0.001 |
| Medications | |||
| RAS inhibitor; n (%) | 91 (39) | 51 (34) | 0.266 |
| Statin; n (%) | 77 (33) | 43 (29) | 0.354 |
| Anti-diabetic drugs; n (%) | 53 (22) | 31 (21) | 0.617 |