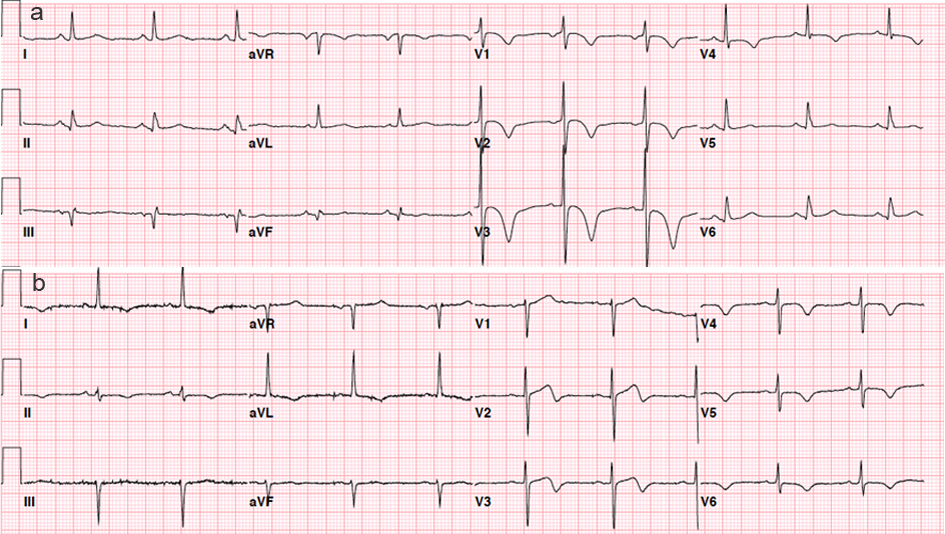
Figure 1. Electrocardiograms with symmetrically inverted T waves (≥ 0.10 mV) (Fig. 1a) and biphasic T waves in both leads V2 and V3 (Fig. 1b).
| Cardiology Research, ISSN 1923-2829 print, 1923-2837 online, Open Access |
| Article copyright, the authors; Journal compilation copyright, Cardiol Res and Elmer Press Inc |
| Journal website http://www.cardiologyres.org |
Original Article
Volume 10, Number 3, June 2019, pages 135-141
Prevalence and Clinical Implication of Wellens’ Sign in Patients With Non-ST-Segment Elevation Myocardial Infarction
Figure
Tables
| Wellens’ sign (n = 24) | Control (n = 250) | P value | |
|---|---|---|---|
| Data are expressed as a number (percent) or median (interquartile range). eGFR: estimated glomerular filtration rate. | |||
| Demographics | |||
| Age (years) | 68 (58 - 79) | 64 (55 - 72) | 0.24 |
| Female | 15 (62.5) | 97 (38.8) | 0.024 |
| Body mass index (kg/m2) | 26.3 (24.6 - 28.9) | 27.5 (24.1 - 30.8) | 0.24 |
| Hypertension | 15 (62.5) | 177 (70.8) | 0.4 |
| Diabetes mellitus | 6 (25.0) | 82 (32.8) | 0.43 |
| Hyperlipidemia | 10 (41.7) | 141 (56.4) | 0.17 |
| Chronic kidney disease | 7 (29.2) | 59 (23.6) | 0.54 |
| History of coronary artery disease | 6 (25.0) | 50 (20.0) | 0.56 |
| Family history of coronary artery disease | 3 (12.5) | 61 (24.4) | 0.31 |
| Current smoker | 4 (16.7) | 68 (27.2) | 0.26 |
| Previous myocardial infarction | 1 (4.2) | 31 (12.4) | 0.33 |
| Thrombolysis in myocardial infarction risk score | |||
| Low risk (0 - 2) | 8 (33.3) | 54 (21.6) | 0.47 |
| Intermediate risk (3 - 4) | 12 (50.0) | 147 (58.8) | 0.47 |
| High risk (5 - 7) | 4 (16.7) | 49 (19.6) | 0.47 |
| Symptom, presence of chest pain at emergency room | 19 (79.2) | 219 (87.6) | 0.22 |
| Hemodynamic and laboratory data | |||
| Systolic blood pressure (mm Hg) | 141 (122 - 159) | 140 (123 - 156) | 0.78 |
| Diastolic blood pressure (mm Hg) | 76 (73 - 98) | 80 (72 - 91) | 0.77 |
| Heart rate (beat/min) | 82 (64 - 88) | 75 (66 - 89) | 0.85 |
| Hemoglobin (g/L) | 13.0 (12.1 - 14.3) | 13.5 (12.2 - 14.5) | 0.45 |
| White blood cell count (109/L) | 8.2 (6.9 - 11.0) | 8.5 (6.7 - 10.3) | 0.83 |
| eGFR (mL/min/1.73 m2) | 69 (54 - 88) | 80 (61 - 93) | 0.19 |
| Elevated first troponin | 22 (91.7) | 212 (84.8) | 0.54 |
| Peak troponin I (µg/L) | 0.67 (0.11 - 4.36) | 0.94 (0.14 - 6.45) | 0.33 |
| Killip class on admission | |||
| Killip class I on admission | 21 (87.5) | 229 (91.6) | 0.094 |
| Killip class II on admission | 1 (4.2) | 18 (7.2) | 0.094 |
| Killip class III on admission | 1 (4.2) | 2 (0.8) | 0.094 |
| Killip class IV on admission | 1 (4.2) | 1 (0.4) | 0.094 |
| Left ventricular ejection fraction (%) | 53 (45 - 60) | 60 (55 - 65) | 0.013 |
| Wellens’ sign (n = 24) | Control (n = 250) | P value | |
|---|---|---|---|
| Data are expressed as a number (percent) or median (interquartile range). | |||
| Heart rate (beat/min) | 81 (73 - 95) | 79 (71 - 92) | 0.74 |
| Atrial fibrillation | 2 (8.3) | 7 (2.8) | 0.18 |
| Biphasic T wave at leads V2 and V3 | 10 (41.7) | 0 (0.0) | < 0.001 |
| Symmetrically inverted T wave (≥ 0.10 mV) in leads V2 and V3 | 14 (58.3) | 0 (0.0) | < 0.001 |
| Symmetrically inverted T wave (≥ 0.20 mV) in leads V2 and V3 | 11 (45.8) | 0 (0.0) | < 0.001 |
| Symmetrically inverted T wave (≥ 0.30 mV) in leads V2 and V3 | 4 (16.7) | 0 (0.0) | < 0.001 |
| Biphasic or symmetrically inverted T wave (≥ 0.10 mV) in lead V1 | 14 (58.3) | 71 (28.4) | 0.002 |
| Biphasic or symmetrically inverted T wave (≥ 0.10 mV) in lead V4 | 18 (75.0) | 25 (10.0) | < 0.001 |
| Biphasic or symmetrically inverted T wave (≥ 0.10 mV) in lead V5 | 12 (50.0) | 30 (12.0) | < 0.001 |
| Biphasic or symmetrically inverted T wave (≥ 0.10 mV) in lead V6 | 8 (33.3) | 27 (10.8) | 0.005 |
| ST segment depression (≥ 0.05 mV) | 1 (4.2) | 81 (32.4) | 0.004 |
| Anterior ST depression (V1 - V4) | 1 (4.2) | 27 (10.8) | 0.49 |
| Lateral ST depression (I, aVL,V5, and V6) | 1 (4.2) | 67 (26.8) | 0.014 |
| Inferior ST depression (II, III, and aVF) | 0 (0.0) | 35 (14.0) | 0.053 |
| Sensitivity | Specificity | PPV | NPV | Accuracy | |
|---|---|---|---|---|---|
| PPV: positive predictive value; NPV: negative predictive value. | |||||
| Biphasic T wave in leads V2 and V3 | 12.30% | 99.00% | 80.00% | 78.40% | 78.50% |
| Symmetrically inverted T wave (≥ 0.10 mV) in leads V2 and V3 | 12.30% | 97.10% | 57.10% | 78.10% | 77.00% |
| Symmetrically inverted T wave (≥ 0.20 mV) in leads V2 and V3 | 9.20% | 97.60% | 54.50% | 77.60% | 76.70% |
| Symmetrically inverted T wave (≥ 0.30 mV) in leads V2 and V3 | 3.10% | 99.00% | 50% | 76.70% | 76.30% |
| Either biphasic or symmetrically inverted T wave (≥ 0.10 mV) in leads V2 and V3 | 24.60% | 96.20% | 66.70% | 80.40% | 79.20% |
| Wellens’ sign (n = 24) | Control (n = 250) | P value | |
|---|---|---|---|
| Data are expressed as a number (percent) or median (interquartile range). | |||
| Angiographic findings | |||
| Interval to angiography from presentation (day) | 0.99 (0.31 - 1.63) | 1.09 (0.60 - 1.95) | 0.38 |
| Early invasive strategy within 24 h | 13 (54.2) | 114 (45.6) | 0.42 |
| Non-obstructive coronary artery disease | 6 (25.0) | 54 (21.6) | 0.7 |
| Multi-vessel disease | 7 (29.2) | 122 (48.8) | 0.066 |
| Three-vessel disease | 1 (4.2) | 45 (18.0) | 0.093 |
| Left main disease | 0 (0.0) | 12 (4.8) | 0.61 |
| Left main and/or three-vessel disease | 1 (4.2) | 51 (20.4) | 0.057 |
| Left anterior descending artery disease (stenosis ≥ 70%) | 16 (66.7) | 130 (52.0) | 0.17 |
| Left anterior descending artery culprit | 16 (66.7) | 49 (19.6) | < 0.001 |
| Proximal left anterior descending artery culprit | 8 (33.3) | 36 (14.4) | 0.035 |
| Mid left anterior descending artery culprit | 8 (33.3) | 13 (5.2) | < 0.001 |
| Left circumflex artery disease (stenosis ≥ 70%) | 5 (20.8) | 109 (43.6) | 0.031 |
| Left circumflex artery culprit | 2 (8.3) | 58 (23.2) | 0.093 |
| Right coronary artery disease (stenosis ≥ 70%) | 5 (20.8) | 117 (46.8) | 0.014 |
| Right coronary artery culprit | 0 (0.0) | 65 (26.0) | 0.004 |
| Pre-procedural thrombolysis in myocardial infarction flow | |||
| 0/1 | 1 (4.2) | 50 (20.0) | 0.058 |
| 2/3 | 23 (95.8) | 200 (80.0) | 0.058 |
| In-hospital procedure | |||
| In-hospital percutaneous coronary intervention | 16 (66.7) | 159 (63.6) | 0.77 |
| In-hospital coronary artery bypass grafting | 1 (4.2) | 18 (7.2) | 1 |
| Intra-aortic balloon pump | 1 (4.2) | 4 (16) | 0.37 |
| Intubation | 1 (4.2) | 2 (0.8) | 0.24 |
| In-hospital outcomes | |||
| All-cause mortality | 0 (0.0) | 1 (0.4) | 1 |
| Recurrent myocardial infarction | 0 (0.0) | 1 (0.4) | 1 |