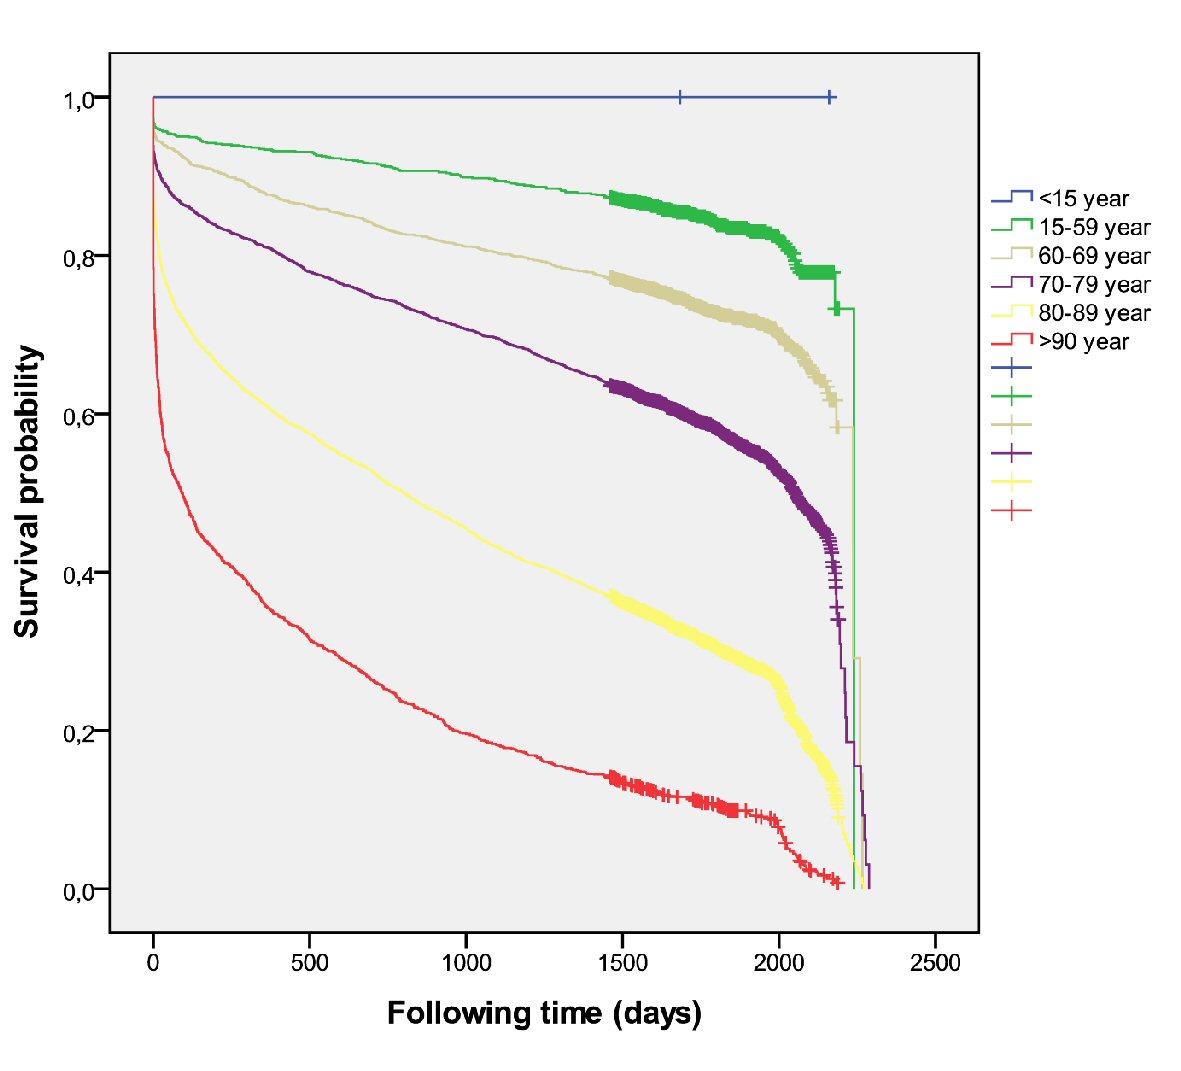
Figure 1. Overall mortality according to age (all cases).
| Cardiology Research, ISSN 1923-2829 print, 1923-2837 online, Open Access |
| Article copyright, the authors; Journal compilation copyright, Cardiol Res and Elmer Press Inc |
| Journal website http://www.cardiologyres.org |
Original Article
Volume 10, Number 2, April 2019, pages 89-97
Long-Term Survival After Stroke According to Reperfusion Therapy, Cardiovascular Therapy and Gender
Figures
Tables
| Variable | Thrombolytic therapy | Thrombolytic therapy and/or thrombectomy | Medical therapy alone | |||||||||
|---|---|---|---|---|---|---|---|---|---|---|---|---|
| Women | Men | P | All | Women | Men | P | All | Women | Men | P | All | |
| Cases number | 521 (49.2) | 538 (50.8) | 0.335 | 1,059 | 165 (43.9) | 211 (56.1) | 0.011 | 376 | 6,530 (50.0) | 6,521 (50.0) | 13,051 | |
| Age (average) ± SD | 77.87 ± 8.4 | 73.12 ± 9.9 | < 0.001 | 75.45 ± 9.5 | 70.48 ± 11.2 | 68.64 ± 11. | 0.11 | 69.45 ± 11.1 | 80.3 ± 10.1 | 74.4 ± 11.1 | < 0.001 | 77.4 ± 11.0 |
| Age groups | < 0.001 | 0.019 | < 0.001 | |||||||||
| < 15 years old | 0 | 0 | - | 0 | 0 | 1 | 1 | 0 | 1 | 1 | ||
| 15 - 59 | 20 (3.8) | 54 (10.0) | < 0.001 | 75 | 27 (16.4) | 34 (16.1) | 61 | 302 (4.6) | 661 (10.1) | 963 | ||
| 60 - 69 | 58 (11.1) | 118 (21.9) | < 0.001 | 176 | 36 (21.8) | 63 (29.9) | 99 | 532 (8.1) | 1,335 (20.5) | 1,867 | ||
| 70 - 79 | 176 (33.8) | 214 (39.8) | < 0.001 | 390 | 64 (38.8) | 90 (42.7) | 154 | 1,655 (25.3) | 2,080 (31.9) | 3735 | ||
| 80 - 89 | 244 (46.8) | 144 (26.8) | < 0.001 | 388 | 38 (23.0) | 23 (10.9) | 61 | 3,052 (46.7) | 2,094 (32.1) | 5,146 | ||
| > 90 years old | 23 (4.4) | 8 (1.5) | < 0.001 | 31 | - | - | - | 989 (15.1) | 350 (5.4) | 1,339 | ||
| Primary outcome (mortality at 5 years) | 274 (52.6) | 249 (46.3) | 0.023 | 523 (49.4) | 57 (34.5) | 92 (43.6) | 0.047 | 149 (39.6) | 4,005 (61.3) | 3,447 (52.9) | < 0.001 | 7,452 (57.1) |
| Cumulated proportion survival at 5 years | 0.38 | 0.47 | 0.023 | 0.42 | 0.56 | 0.49 | 0.116 | 0.52 | 0.29 | 0.37 | < 0.001 | 0.33 |
| Hemorrhagic stroke post- | 6 | 4 | 0.075 | 10 | 1 | 3 | 0.587 | 4 | 72 | 150 | 0.075 | 222 (97.7) |
| Variables | Thrombolytic therapy | Thrombolytic therapy and/or thrombectomy | Medical therapy alone | |||||||||
|---|---|---|---|---|---|---|---|---|---|---|---|---|
| Women | Men | P | All | Women | Men | P | All | Women | Men | P | All | |
| ACEI: angiotensin converting enzyme inhibitor; AII-RA: angiotensin II receptor antagonists. | ||||||||||||
| Anticoagulants (%) | 34 (6.5) | 35 (6.5) | 0.544 | 69 (6.5) | 33 (20.0) | 28 (13.3) | 0.053 | 61 (16.2) | 949 (14.5) | 782 (12.0) | < 0.001 | 1731 (13.3) |
| Antiaggregants (%) | 246 (47.2) | 297 (55.2) | 0.006 | 543 (51.3) | 61 (37.0) | 104 (49.3) | 0.011 | 165 (43.9) | 3,216 (49.2) | 3,722 (57.1) | < 0.001 | 6,938 (53.2) |
| Statins (%) | 221 (42.4) | 282 (52.4) | 0.001 | 503 (47.5) | 75 (45.5) | 123 (58.3) | 0.009 | 198 (52.7) | 2,777 (42.5) | 3,255 (49.9) | < 0.001 | 6,032 (46.2) |
| Antidiabetics (%) | 98 (18.8) | 141 (26.2) | 0.002 | 239 (22.6) | 33 (20.0) | 52 (24.6) | 0.173 | 85 (22.6) | 1,698 (26.0) | 2,138 (32.8) | < 0.001 | 3,836 (29.4) |
| Diuretics (%) | 203 (39.0) | 144 (26.8) | < 0.001 | 347 (32.8) | 58 (35.2) | 50 (23.7) | 0.01 | 108 (28.7) | 2,953 (45.2) | 2,038 (31.3) | < 0.001 | 4,991 (38.2) |
| ACEIs (%) | 176 (33.8) | 172 (32.0) | 0.287 | 348 (32.9) | 57 (34.5) | 74 (35.1) | 0.502 | 131 (34.8) | 2,425 (37.1) | 2,652 (40.7) | < 0.001 | 5,077 (38.9) |
| AII-RA | 178 (34.2) | 153 (28.4) | 0.026 | 331 (31.3) | 47 (28.5) | 61 (28.9) | 0.511 | 108 (28.7) | 1,975 (30.2) | 1,706 (26.2) | < 0.001 | 3,681 (28.2) |
| Beta-blocker | 176 (33.8) | 176 (32.7) | 0.381 | 352 (33.2) | 49 (29.7) | 75 (35.3) | 0.139 | 124 (33.0) | 1,798 (27.5) | 1,616 (24.8) | < 0.001 | 3,414 (26.2) |