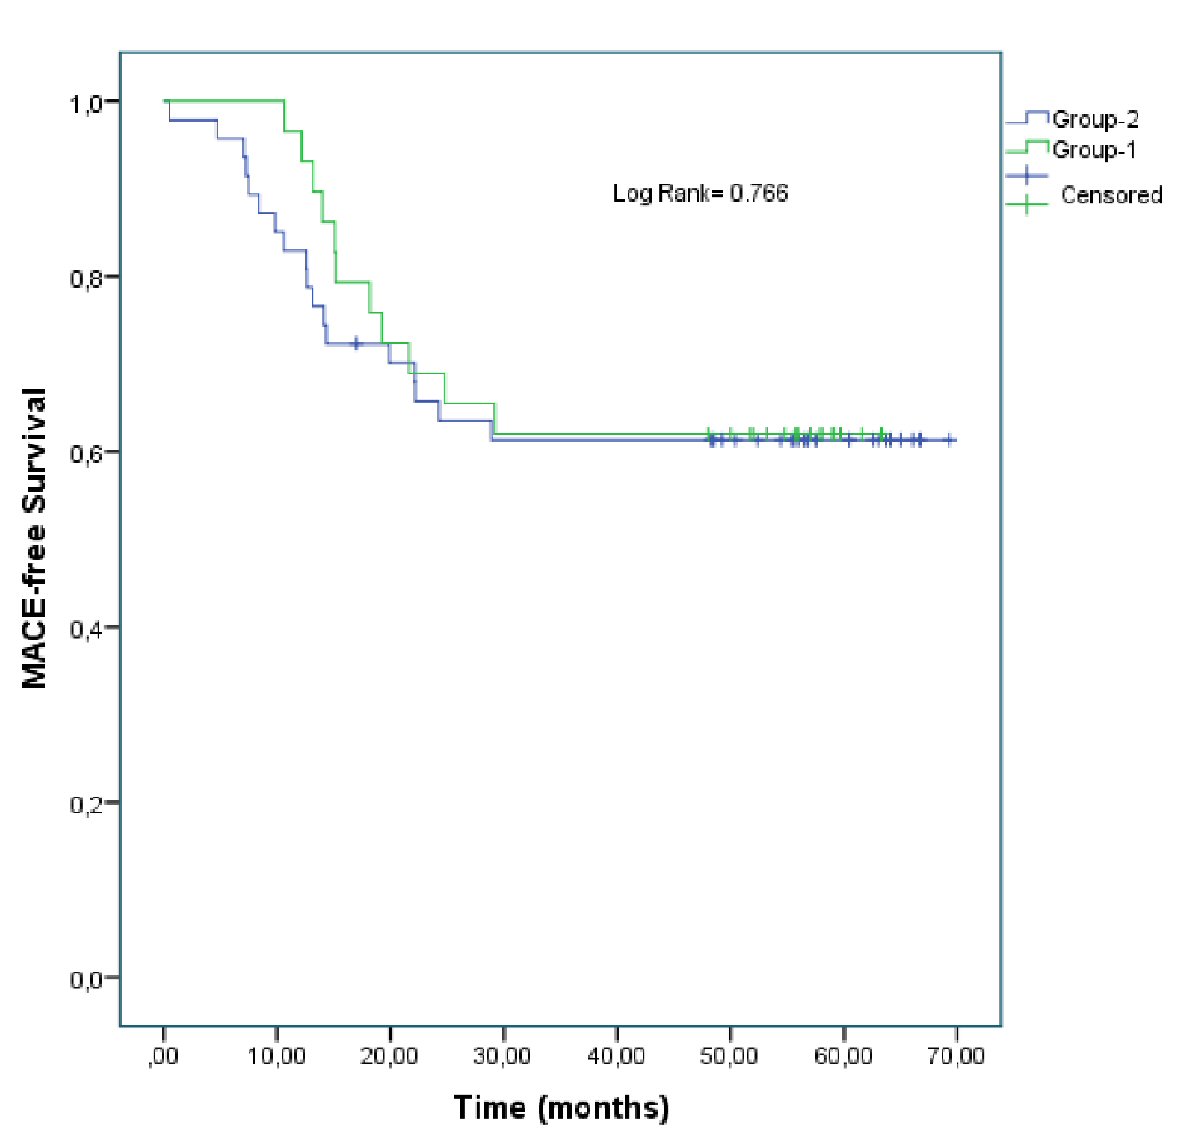
Figure 1. Kaplan-Meier analysis freedom from MACE.
| Cardiology Research, ISSN 1923-2829 print, 1923-2837 online, Open Access |
| Article copyright, the authors; Journal compilation copyright, Cardiol Res and Elmer Press Inc |
| Journal website http://www.cardiologyres.org |
Original Article
Volume 10, Number 1, February 2019, pages 34-39
Timing of Coronary Angiography After Successful Fibrinolytic Therapy in ST-Segment Elevated Myocardial Infarction
Figure
Tables
| Variable | All patients ( n = 76) | Group-1 (n = 29) | Group-2 (n = 47) | P |
|---|---|---|---|---|
| BP: blood pressure; CAD: coronary artery disease; HDL-C: high density lipoprotein cholesterol; LDLC-C: low density lipoprotein cholesterol; LVEF: left ventricular ejection fraction. | ||||
| Age (years), (mean ± SD) | 56 ± 11.4 | 54.8 ± 11.2 | 57.4 ± 11.5 | 0.354 |
| Female, n, (%) | 21 (27.6) | 6 (20.7) | 15 (31.9) | 0.424 |
| Hospitalization time (days) | 7.0 ± 4.0 | 7.3 ± 5.8 | 6.8 ± 2.4 | 0.661 |
| Hypertension, n, (%) | 27 (35.5) | 12 (41.4) | 15 (31.9) | 0.402 |
| Diabetes mellitus, n, (%) | 13 (17.1) | 9 (31.0) | 4 (8.5) | 0.025 |
| Hyperlipidemia, n, (%) | 14 (18.4) | 4 (13.8) | 10 (21.3) | 0.414 |
| Current smoker, n, (%) | 66 (86.8) | 24 (82.8) | 42 (89.4) | 0.408 |
| History of CAD, n, (%) | 9 (11.8) | 2 (6.9) | 7 (14.9) | 0.469 |
| Family history of CAD, n, (%) | 17 (22.4) | 11 (37.9) | 6 (12.8) | 0.001 |
| Systolic BP (mm Hg) | 137 ± 27 | 134 ±17 | 140 ± 32 | 0.344 |
| Diastolic BP (mm Hg) | 80 ± 16 | 79 ±11 | 82 ± 19 | 0.521 |
| Heart rate (per minute) | 76 ± 14 | 73 ±14 | 78 ± 14 | 0.176 |
| Hemoglobin (g/dL) | 14 ±1.6 | 14 ±1.4 | 14 ± 1.7 | 0.51 |
| Hematocrit (%) | 41.3 | 41.4 ± 3.8 | 41.3 ± 4.7 | 0.87 |
| Creatinine (mg/dL) | 0.89 ± 0.23 | 0.91 ± 0.27 | 0.88 ± 0.2 | 0.67 |
| Aspartate aminotransferase (U/L) | 27.3 ± 20.9 | 51 ± 92 | 59 ± 78 | 0.95 |
| Alanine aminotransferase (U/L) | 50.3 ± 83 | 28 ± 20.3 | 27 ± 21 | 0.83 |
| Total cholesterol (mg/dL) | 191 ± 40 | 192 ± 42 | 191 ± 37 | 0.93 |
| LDL-C (mg/dL) | 121 ± 36 | 119 ± 34 | 122 ± 37 | 0.66 |
| HDL-C (mg/dL) | 38 ± 10 | 38 ± 11 | 39 ± 9 | 0.68 |
| Triglyceride (mg/dL) | 179 ± 95 | 194 ± 123 | 169 ± 74 | 0.27 |
| LVEF (%) | 48.6 ±9.6 | 53.4 ± 8.7 | 46.0 ± 9.2 | 0.003 |
| Variable | All patients ( n = 76) | Group-1 (n = 29) | Group-2 (n = 47) | P |
|---|---|---|---|---|
| CAG: coronary angiography; FT: fibrinolytic treatment; PCI: percutaneous coronary intervention. | ||||
| Symptom onset to first medical contact | ||||
| < 1 h | 47 (61.8) | 19 (65.5) | 28 (59.6) | 0.873 |
| 1 - 3 h | 23 (30.3) | 8 (27.6) | 15 (31.9) | |
| > 3 h | 6 (7.9) | 2 (6.9) | 4 (8.5) | |
| Coronary angiography performed | 70 (100) | 29 (100) | 47 (109 | NS |
| Time from FT to CAG | 8.86 ± 10.4 | 2.17 ± 0.38 | 12.9 ± 11.5 | < 0.001 |
| PCI performed | 69 (90.8) | 26 (89.7) | 43 (91.5) | 0.788 |
| Femoral access | 70 (100) | 29 (100) | 47 (109 | NS |
| All patients (n = 76) | Grup-1 (n = 29) | Grup-2 (n = 47) | |
|---|---|---|---|
| aOne patient in Group-2 died at the fourth month. ACEI: angiotensin converting enzyme inhibitor. | |||
| Medication at discharge | |||
| Aspirin, n, (%) | 76 (100) | 29 (100) | 47 (100) |
| Clopidogrel, n, (%) | 76 (100) | 29 (100) | 47 (100) |
| Statins, n, (%) | 75 (98) | 29 (100) | 46 (98) |
| ACEI, n, (%) | 68 (89) | 26 (90) | 42 (90) |
| Beta blockers, n, (%) | 71 (93) | 26 (90) | 45 (96) |
| PPI, n, (%) | 68 (89) | 28 (96) | 40 (85) |
| Medication at 6 monthsa | |||
| Aspirin, n, (%) | 75 (100) | 29 (100) | 46 (100) |
| Clopidogrel, n, (%) | 73 (97) | 29 (100) | 44 (95) |
| Statins, n, (%) | 75 (100) | 29 (100) | 46 (100) |
| ACEI, n, (%) | 68 (90) | 25 (86) | 42 (93) |
| Beta blockers, n, (%) | 72 (96) | 27 (93) | 45 (97) |
| PPI, n, (%) | 68 (90) | 25 (86) | 43 (95) |
| Variable | All patients ( n = 76) | Group-1 (n = 29) | Group-2 (n = 47) | P |
|---|---|---|---|---|
| NS: non-significant; MACE: major adverse cardiac events. | ||||
| Short-term follow-up (6 months) | ||||
| Death, n, (%) | 1 (1.3) | 0 | 1 (2.1) | NS |
| Re-infarction, n, (%) | 7 (9.2) | 2 (6.9) | 7 (10.6) | 0.295 |
| Heart failure, n, (%) | 11 (14.5) | 3 (10.3) | 8 (17) | 0.422 |
| MACE, n, (%) | 14 (18.4) | 4 ( 13.8) | 10 (21.3) | 0.661 |
| Long- term follow-up (median 57 months) | ||||
| Death, n, (%) | 6 (7.9) | 1 (3.4) | 5 (10.6) | 0.398 |
| Re-infarction, n, (%) | 15 (19.7) | 5 (17.2) | 10 (21.3) | 0.668 |
| Heart failure, n, (%) | 13 (17.1) | 7 (24.1) | 6 (12.8) | 0.201 |
| MACE, n, (%) | 29 (38.2) | 11 (37.9) | 18 (38.3) | 0.974 |