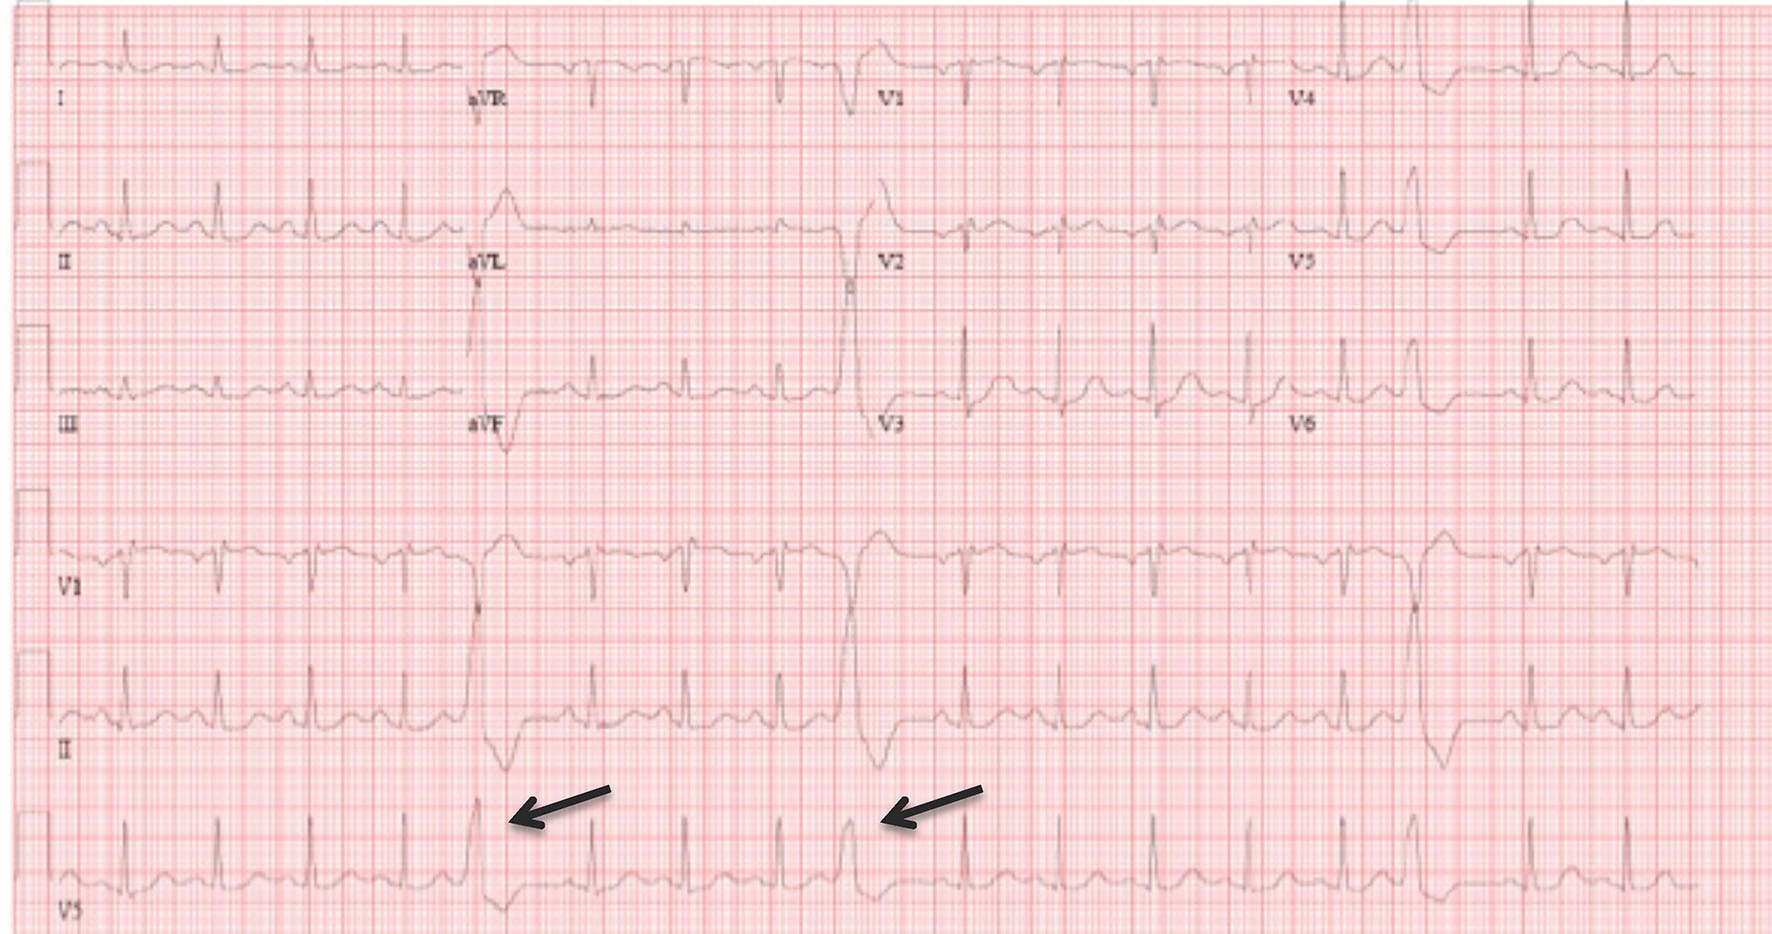
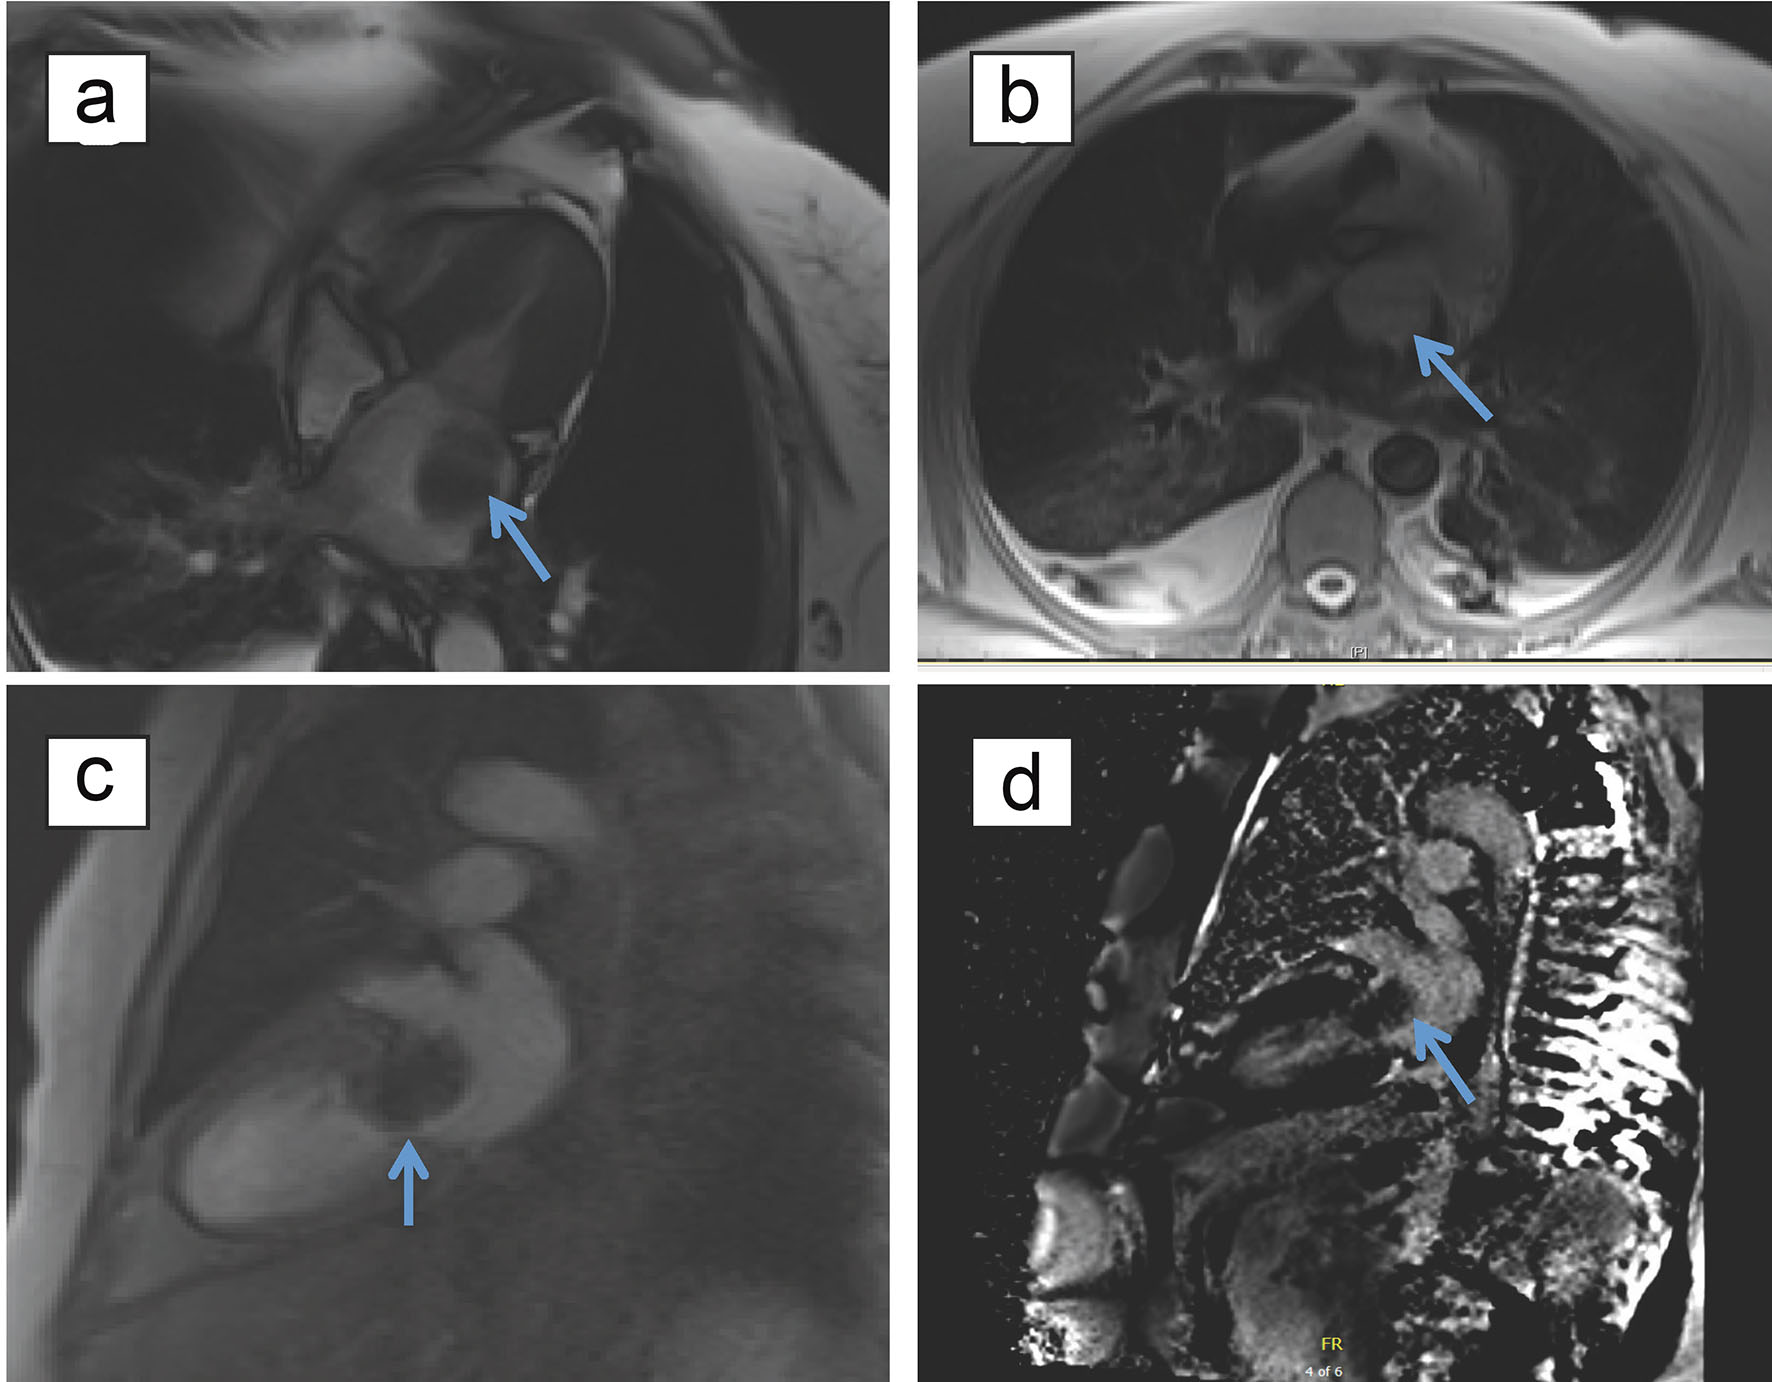
Figure 1. Electrocardiogram showing normal sinus rhythm with occasional premature ventricular complexes.
| Cardiology Research, ISSN 1923-2829 print, 1923-2837 online, Open Access |
| Article copyright, the authors; Journal compilation copyright, Cardiol Res and Elmer Press Inc |
| Journal website https://www.cardiologyres.org |
Case Report
Volume 9, Number 5, October 2018, pages 307-313
Functional Mitral Stenosis: Imposture of Primary Cardiac Intimal Sarcoma
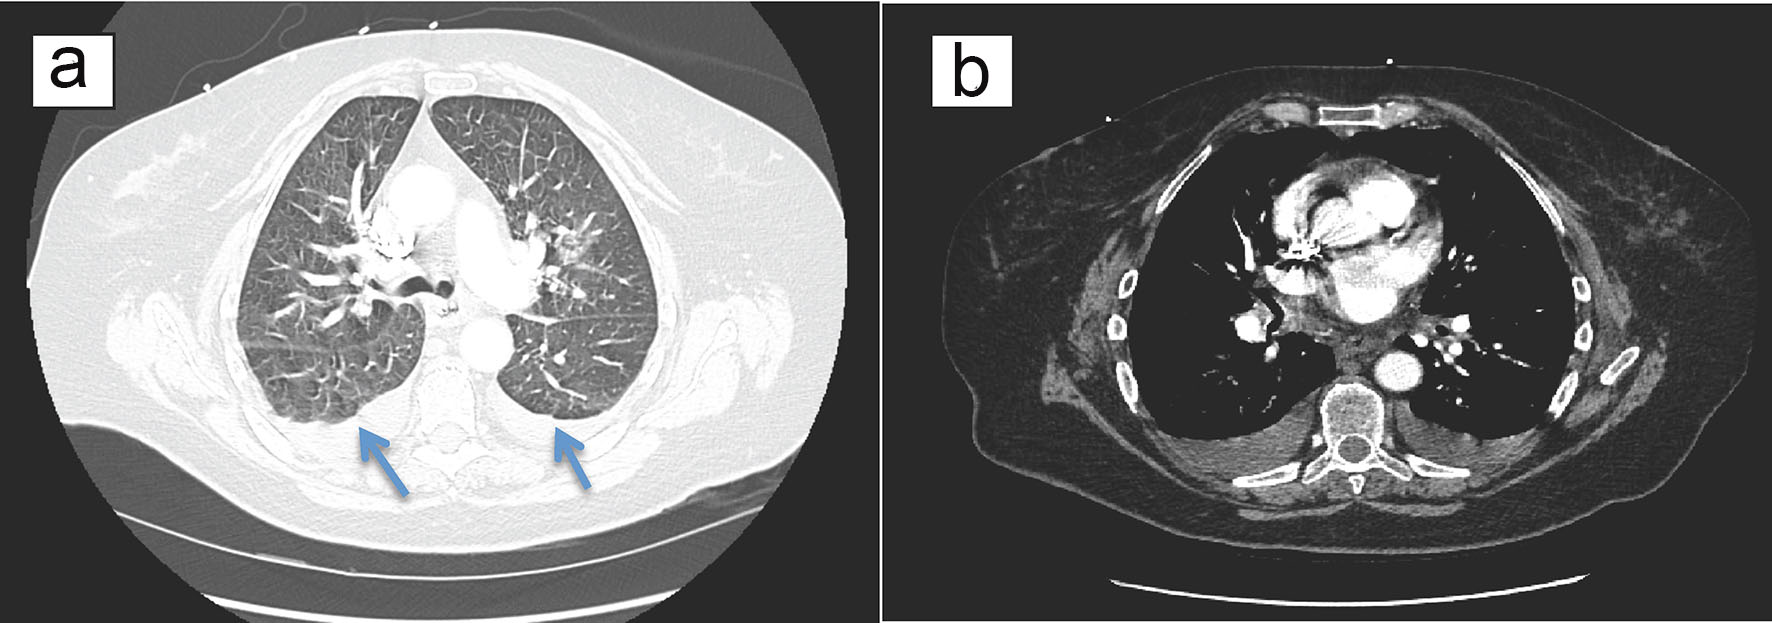
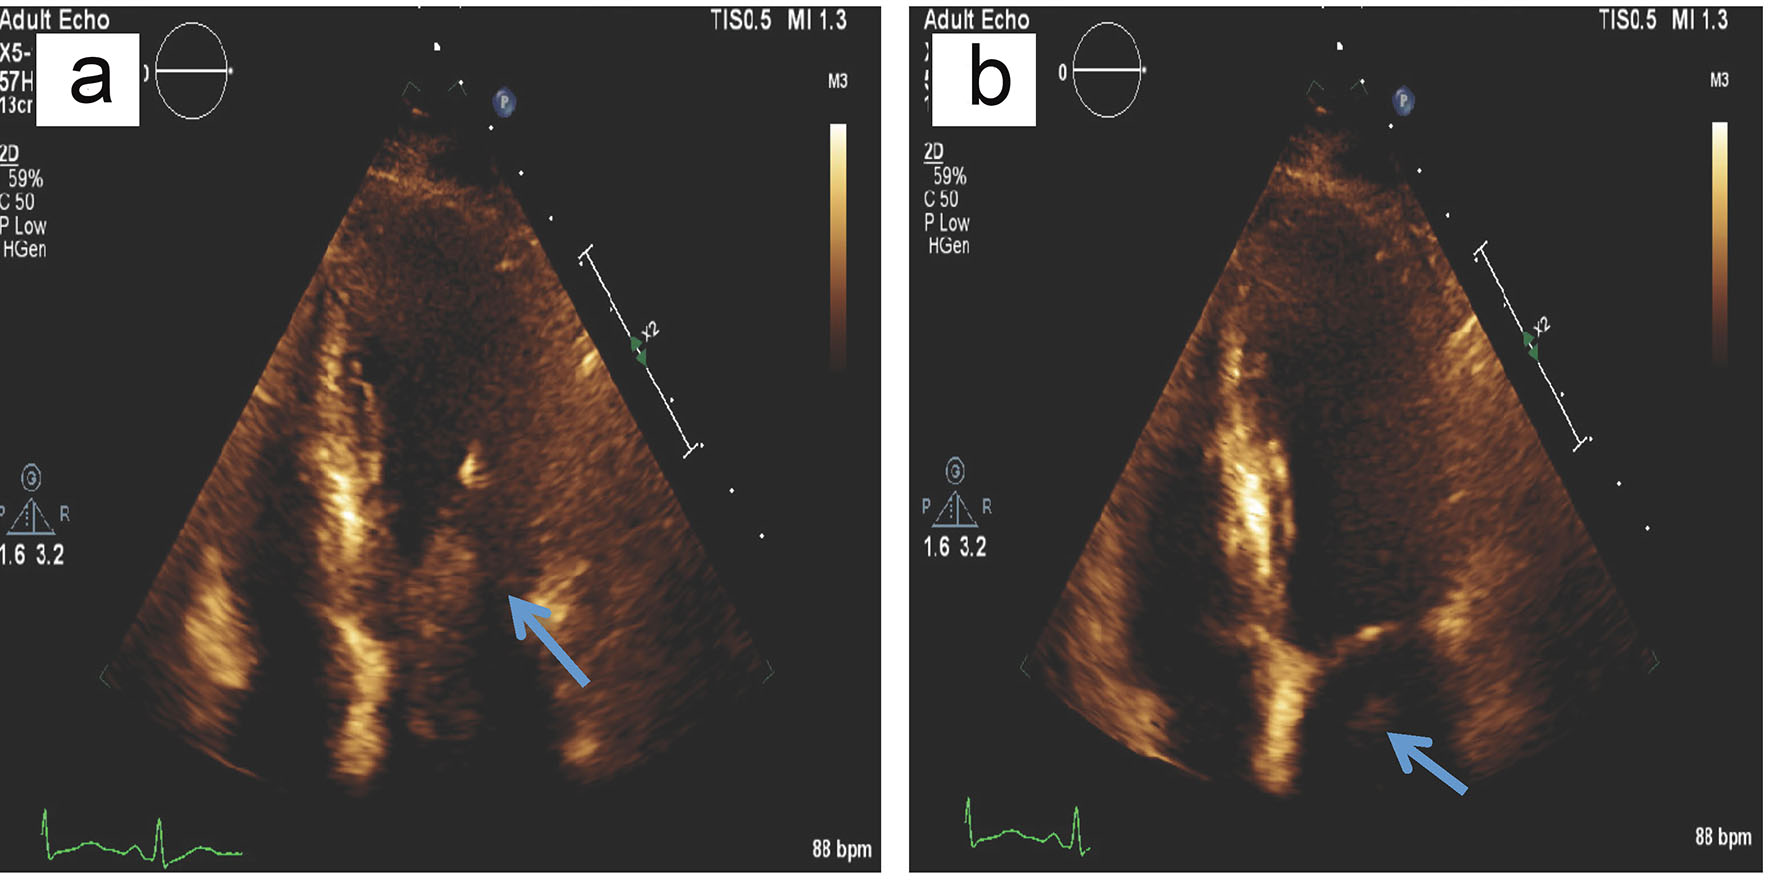
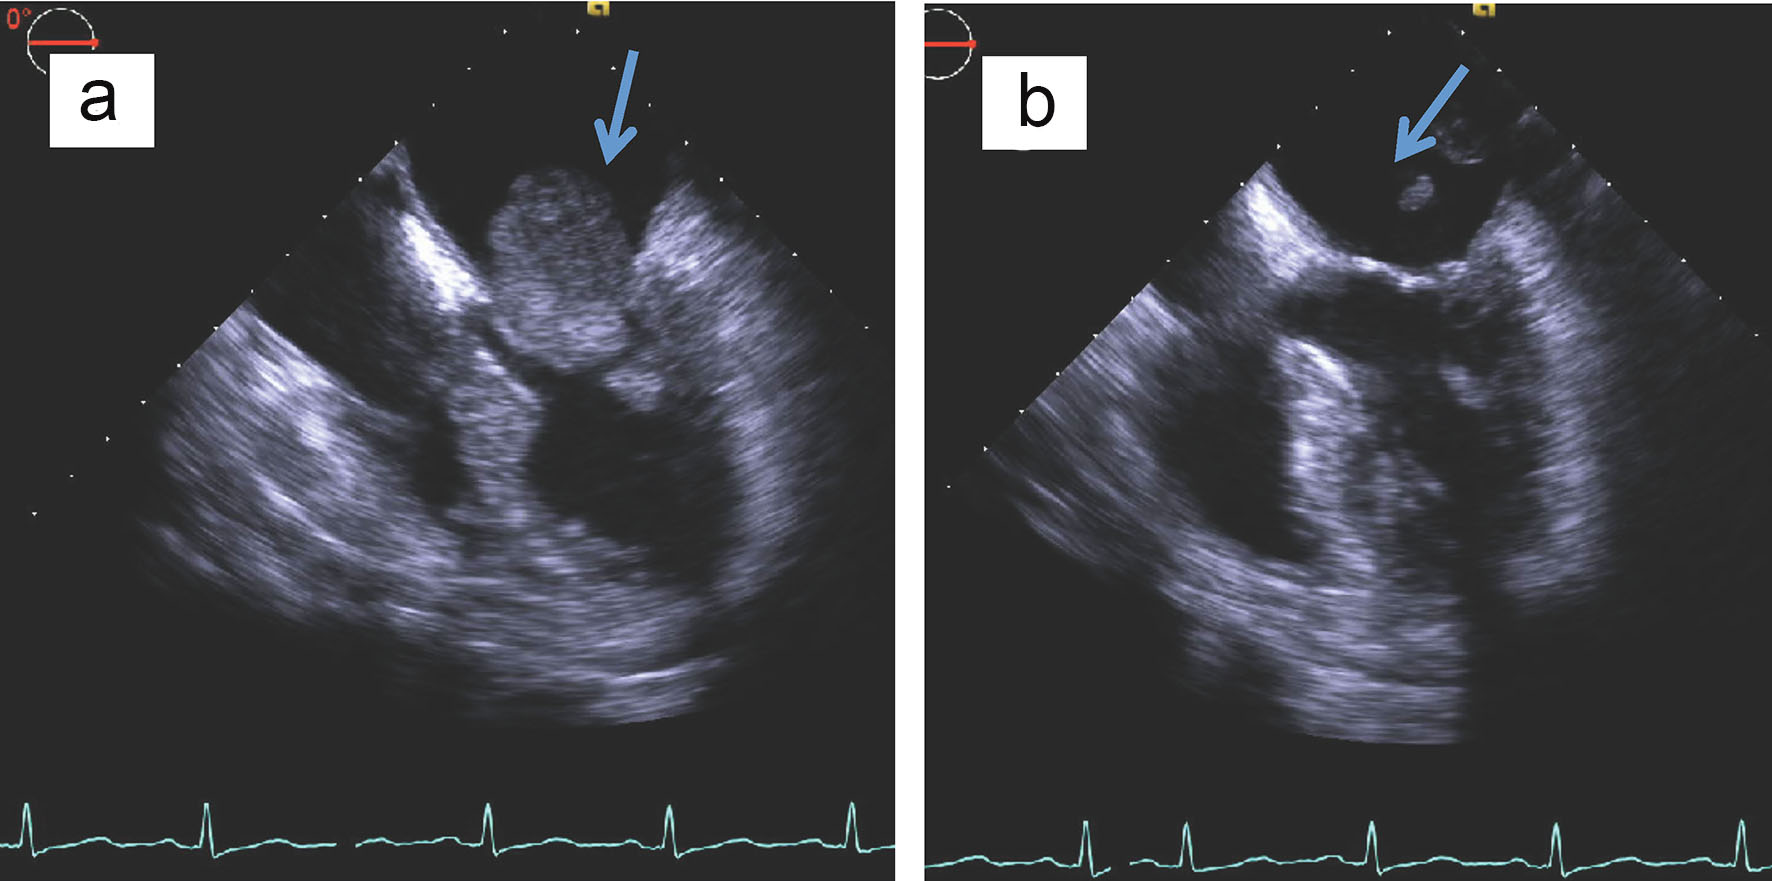
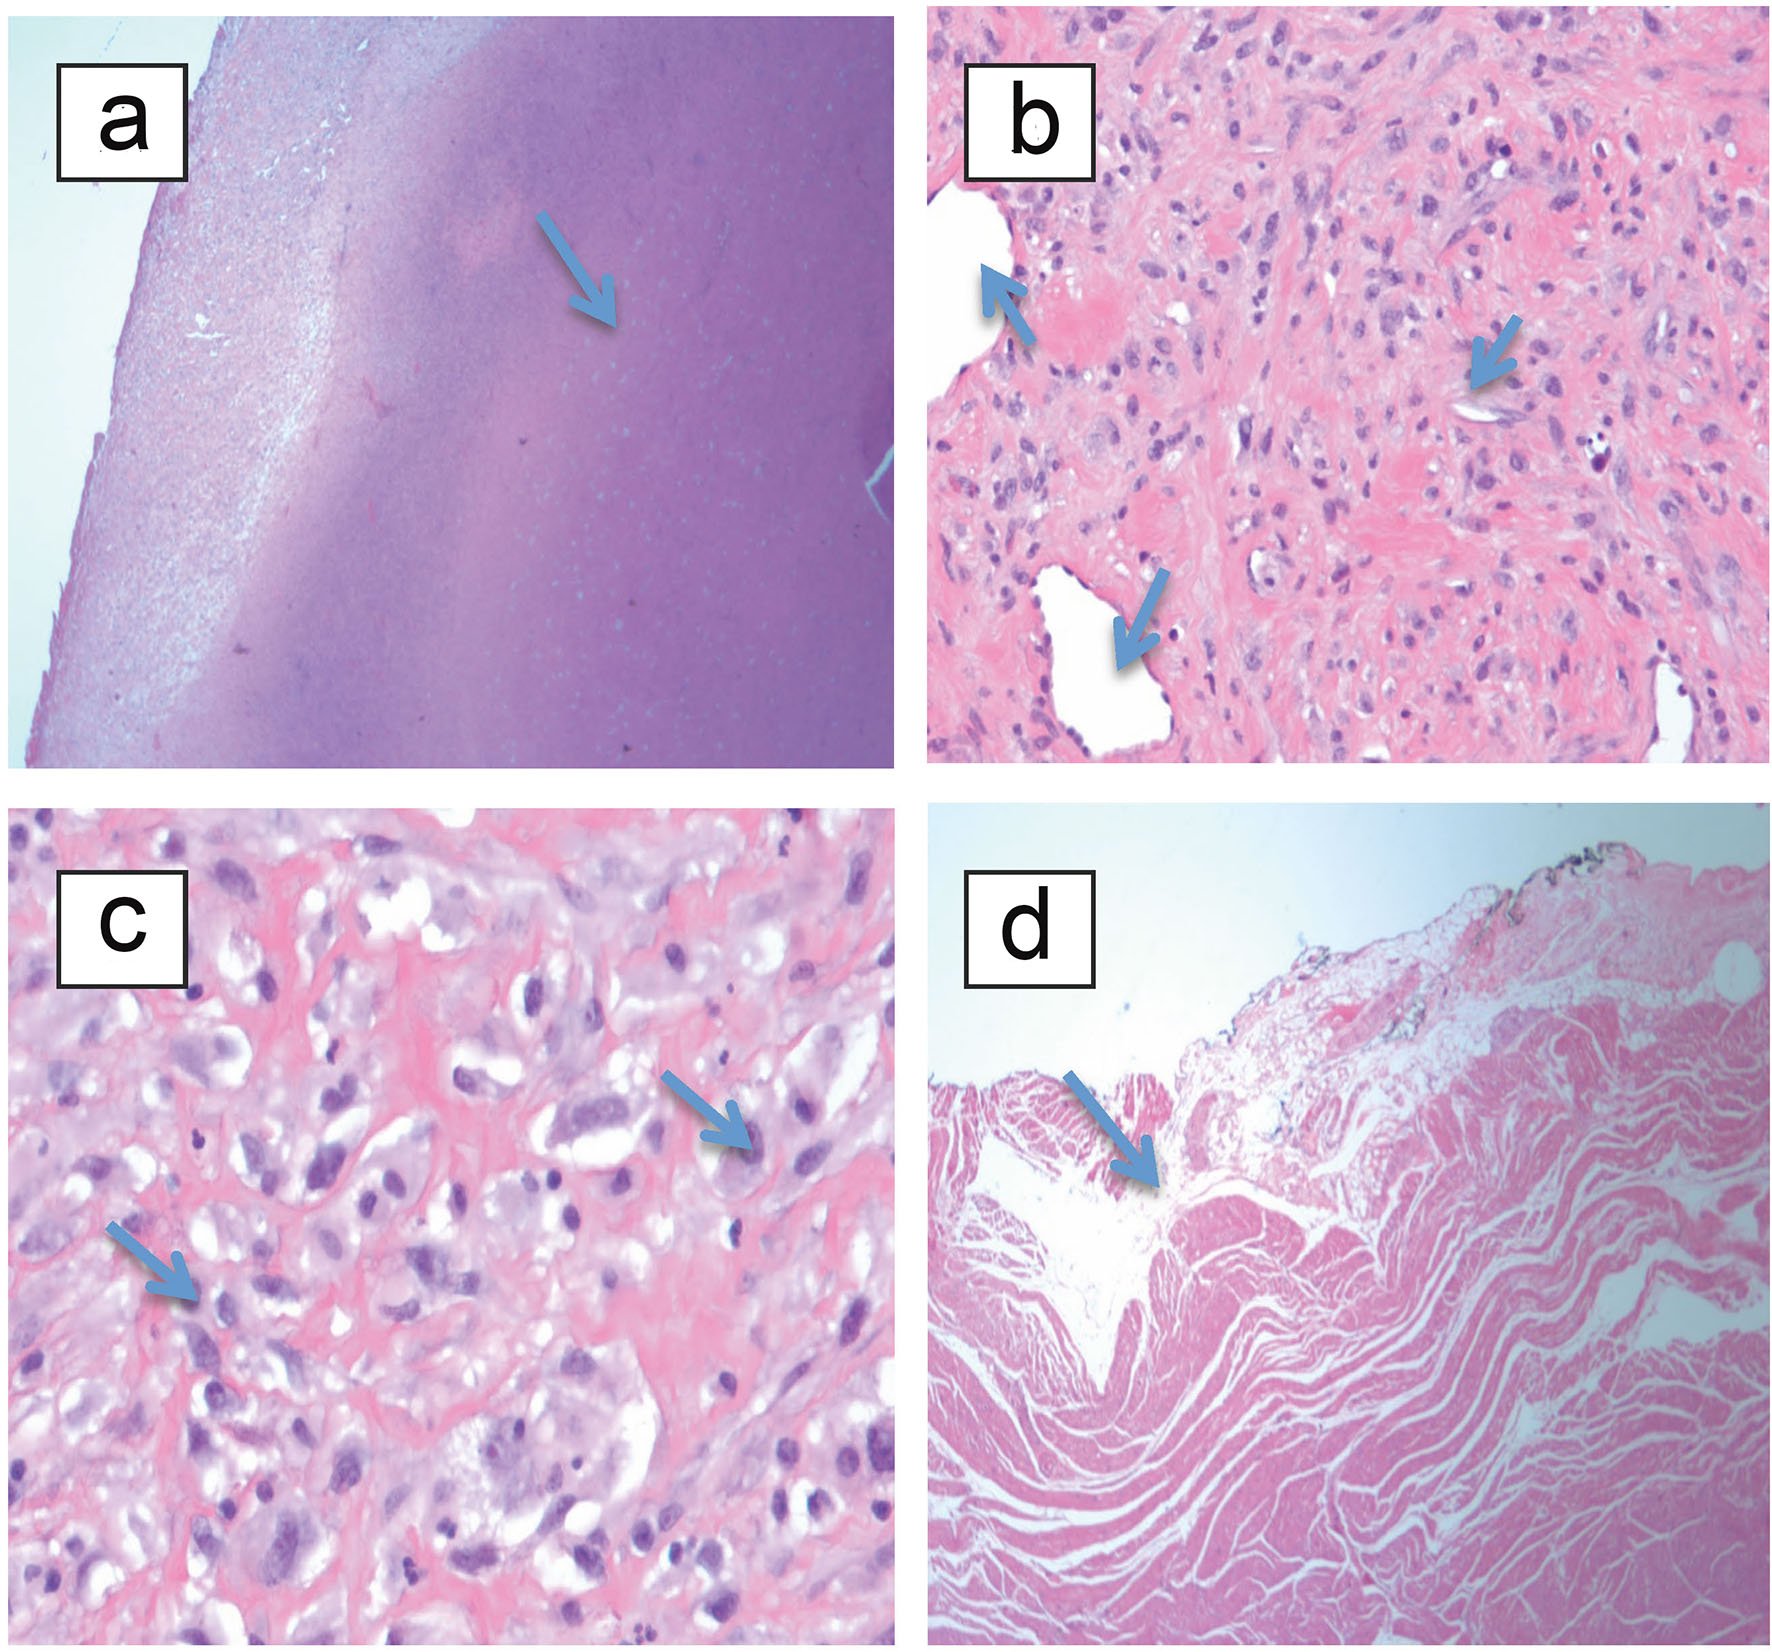
Figures
Table
| Complete blood count | |
| White blood cells | 10.7 × 10³/cmm (4.4 × 10³ - 9.7 × 10³/cmm) |
| Hemoglobin | 12.5 g/dL (13.2 - 17.4 g/dL) |
| Red blood cells | 3.86 mil/cmm (4.22 - 5.8 mil/cmm) |
| Hematocrit | 37.6% (39.6-50.7%) |
| Platelet count | 302 thou/cmm (150 - 370 thou/cmm) |
| Mean corpuscular volume | 97.4 fl (80 - 100 fl) |
| Mean corpuscular hemoglobin concentration | 33.2% (31.9-35.6%) |
| Red cell distribution width | 12.4% (11.8-14.5%) |
| Mean corpuscular hemoglobin | 32.0 pg (27.4 - 32.8 pg) |
| Basic metabolic panel | |
| Serum sodium | 141 mEq/L (136 - 145 mEq/L) |
| Serum potassium | 3.4 mEq/L (3.5 - 5.1 mEq/L) |
| Serum chloride | 104 mEq/L (98 - 107 mEq/L) |
| Serum bicarbonate | 28 mEq/L (21 - 32 mEq/L) |
| Serum creatinine | 0.88 mg/dL (0.67 - 1.17 mg/dL) |
| Blood urea nitrogen | 16 mg/dL (7 - 18 mg/dL) |
| Blood glucose | 133 mg/L (70 - 99 mg/dL) |
| Serum calcium | 9.1 mg/dL (8.5 - 10.1 mg/dL) |
| Serum magnesium | 2.1 mEq/L (1.5 - 2 mEq/L) |
| Anion gap | 12 mEq/L (8 - 16 mEq/L) |
| Hepatic panel | |
| Aspartate aminotransferase | 26 IU/L (5 - 30 IU/L) |
| Alanine aminotransferase | 22 IU/L (5 - 30 IU/L) |
| Total bilirubin | 18 µmol/L (2 - 20 µmol/L) |
| Direct bilirubin | 2 µmol/L (0 - 6 µmol/L) |
| Serum albumin | 4 g/dL (3.5 - 5.5 g/dL) |
| Total protein | 7.5 g/dL (6 - 8.3 g/dL) |
| Cardiac markers | |
| Creatinine kinase | 28 U/L (25 - 200 U/L) |
| Creatinine kinase-MB | 22 IU/L (5 - 25 IU/L) |
| Serum troponin (initial on presentation) | < 0.015 ng/mL (0.015 - 0.045 ng/mL) |
| Serum troponin (second at 3 h) | < 0.015 ng/mL (0.015 - 0.045 ng/mL) |
| Serum troponin (third at 6 h) | < 0.015 ng/mL (0.015 - 0.045 ng/mL) |