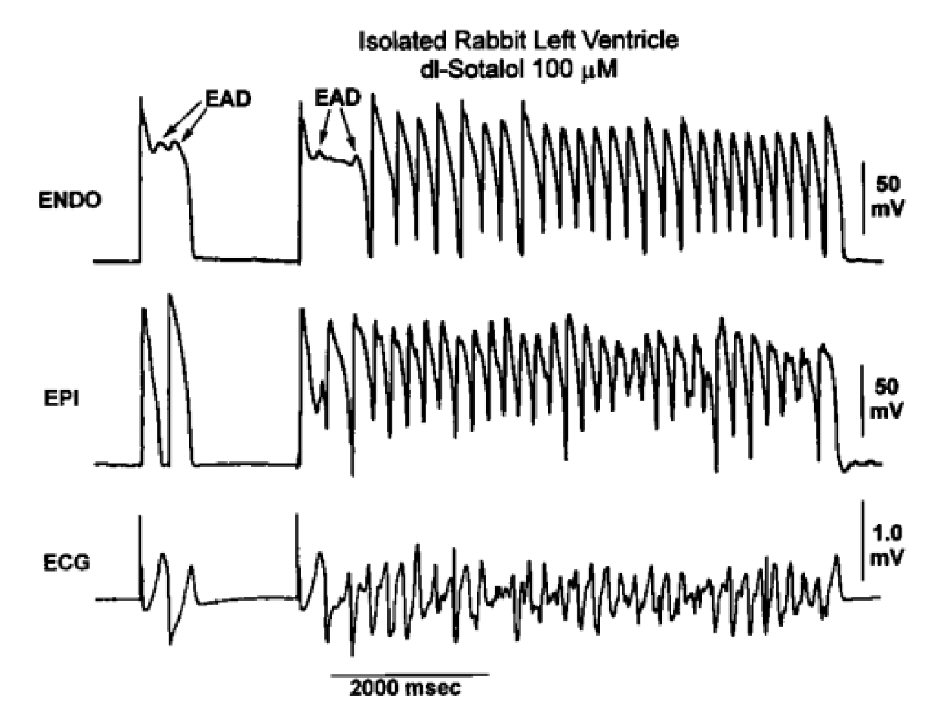
Figure 1. EAD-induced trigger initiated long run of polymorphic VT in arterially perfused rabbit left ventricle pretreated with dl-sotalol 100 mmol/L [5].
| Cardiology Research, ISSN 1923-2829 print, 1923-2837 online, Open Access |
| Article copyright, the authors; Journal compilation copyright, Cardiol Res and Elmer Press Inc |
| Journal website https://www.cardiologyres.org |
Original Article
Volume 9, Number 4, August 2018, pages 215-223
Association of Tp-Te/QT Ratio With Ventricular Tachycardia in Patients With Idiopathic Outflow Tract Ventricular Premature Contraction
Figures
Tables
| Variables | Value (n = 46) |
|---|---|
| ECG: electrocardiogram; SD: standard deviation; SVT: supraventricular tachycardia. | |
| Sex | |
| Female; n (%) | 32 (69.6%) |
| Male; n (%) | 14 (30.4%) |
| Age mean ± SD (year) | 44.59 ± 10.939 |
| Comorbidities | |
| Diabetes mellitus; n (%) | 4 (8.7%) |
| Hypertension; n (%) | 15 (32.6%) |
| Left ventricular hypertrophy; n (%) | 5 (10.9%) |
| SVT; n (%) | 0 (0%) |
| Ejection fraction (%) | 63.6±6.099 |
| Clinical complaints | |
| Palpitation; n (%) | 29 (63%) |
| Chest pain; n (%) | 7 (15.2%) |
| Dizziness; n (%) | 5 (10.9%) |
| Fatigue; n (%) | 1 (2.2%) |
| Syncope; n (%) | 2 (4.3%) |
| Hemodynamic disturbance; n (%) | 2 (4.3%) |
| Antiarrhythmic drugs consumption during ECG recording | |
| Bisoprolol; n (%) | 5 (10.8%) |
| Metoprolol; n (%) | 1 (2.1%) |
| Verapamil; n (%) | 1 (2.1%) |
| Antihypertension drugs | |
| Ramipril; n (%) | 3 (6.3%) |
| Valsartan; n (%) | 7 (15.2%) |
| Candesartan; n (%) | 4 (8.6%) |
| Irbesartan; n (%) | 1 (2.1%) |
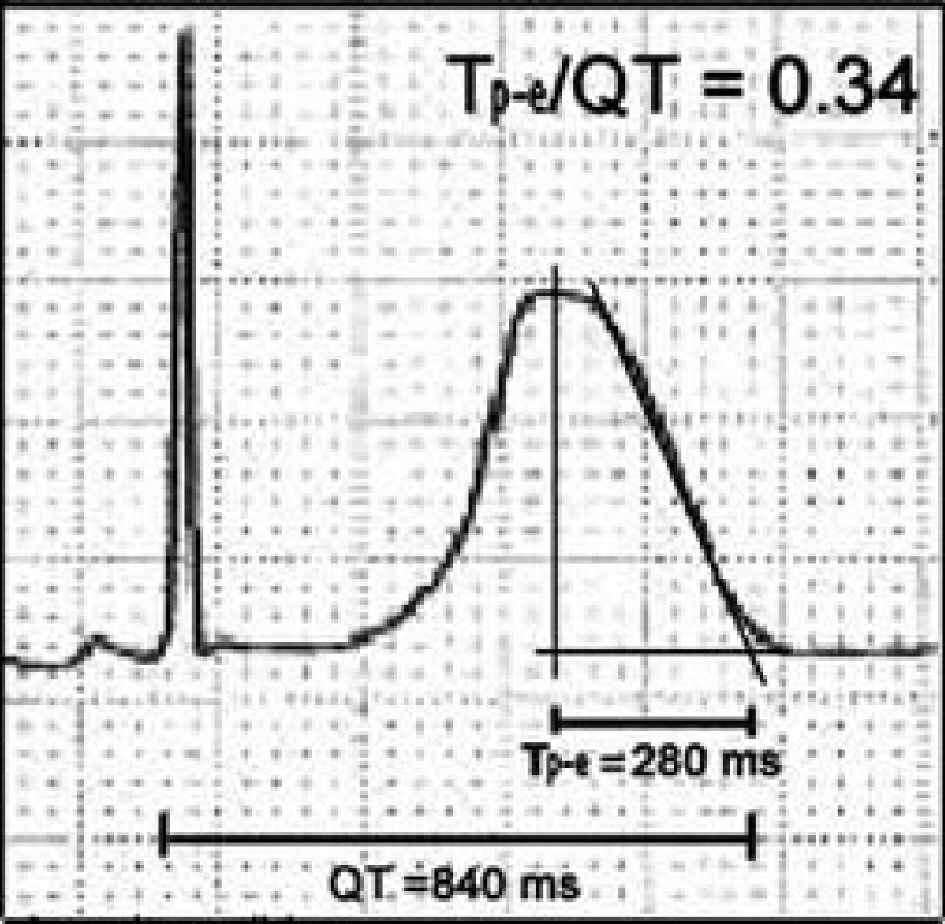
| Tp-Te | |
| Lead V4 ± SD (ms) | 92.09 ± 16.52 |
| Lead V5 ± SD (ms) | 94.50 ± 14.84 |
| Lead V6 ± SD (ms) | 91.66 ± 17.23 |
| QT | |
| Lead V4 ± SD (ms) | 408.93 ± 40.05 |
| Lead V5 ± SD (ms) | 413.32 ± 37.02 |
| Lead V6 ± SD (ms) | 409.55 ± 40.33 |
| Tp-Te/QT | |
| Lead V4 ± SD (ms) | 0.225 ± 0.037 |
| Lead V5 ± SD (ms) | 0.228 ± 0.031 |
| Lead V6 ± SD (ms) | 0.223 ± 0.036 |
| Variables | Without VT (n = 18) | With VT (n = 28) | P |
|---|---|---|---|
| VT: ventricular tachycardia; ECG: electrocardiogram; RVOT: right ventricular outflow tract; LVOT: left ventricular outflow tract; SVT: supraventricular tachycardia; SD: standard deviation.*P < 0.05; 95% CI. | |||
| Sex | |||
| Female; n (%) | 11 (69.6%) | 21 (75%) | 0.502 |
| Male; n (%) | 7 (30.4%) | 7 (25%) | |
| Age, mean ± s.d. (year) | 40.5 ± 11.284 | 47.21 ± 10.049 | 0.41 |
| Comorbidities | |||
| Diabetes mellitus; n (%) | 1 (5.8%) | 3 (10.7%) | 0.944 |
| Hypertension; n (%) | 2 (11.1%) | 13 (46.4%) | 0.030* |
| Left ventricular hypertrophy; n (%) | 2 (11.6%) | 4 (14.3%) | 0.634 |
| SVT; n (%) | 0 (0%) | 0 (0%) | - |
| Ejection fraction | 63.28 ± 2.824 | 63.68 ± 7.484 | 0.829 |
| Drug consumption during ECG | |||
| Verapamil; n (%) | 0 (0%) | 1 (3.5%) | 1 |
| Bisoprolol; n (%) | 2 (11.1%) | 5 (17.8%) | 1 |
| Metoprolol; n (%) | 1 (5.5%) | 0 (0%) | 0.391 |
| Antihypertension therapy | |||
| Ramipril | 1 (5.5%) | 2 (7.1%) | 1 |
| Valsartan | 1 (5.5%) | 6 (21.4%) | 0.297 |
| Candesartan | 0 (0%) | 4 (14.3%) | 0.891 |
| Irbesartan | 0 (0%) | 1 (3.5%) | 1 |
| VT incidence | |||
| Spontaneous VT | 21 (75%) | ||
| Induced VT | 7 (25%) | ||
| Types of VT | |||
| Nonsustained VT | - | 16 (57.1%) | |
| Sustained VT | - | 10 (35.7%) | |
| Unstable VT | - | 2 (7.2%) | |
| Arrhythmia source | |||
| Septal RVOT | 9 (50%) | 7 (25%) | 0.502 |
| Anteroseptal RVOT | 2 (11.1%) | 3 (10.6%) | 1 |
| Posteroseptal RVOT | 1 (5.6%) | 2 (7.2%) | 1 |
| Basal septal RVOT | 1 (5.6%) | 1 (3.6%) | 0.39 |
| Anterior RVOT | 1 (5.6%) | 0 (0%) | 0.39 |
| Free wall RVOT | 2 (11.1%) | 1 (3.6%) | 0.552 |
| LVOT | 1 (5.6%) | 0 (0%) | 0.391 |
| Tp-Te | |||
| Lead V4 ± SD (ms) | 75.83 ± 11.86 | 102.54 ± 8.76 | < 0.001* |
| Lead V5 ± SD (ms) | 80.50 ± 8.49 | 103.50 ± 10.34 | < 0.001* |
| Lead V6 ± SD (ms) | 74.76 ± 8.56 | 102.53 ± 11.67 | < 0.001* |
| QT | |||
| Lead V4 ± SD (ms) | 392.37 ± 39.33 | 419.58 ± 37.40 | 0.023* |
| Lead V5 ± SD (ms) | 399.37 ± 35.96 | 422.30 ± 35.44 | 0.039* |
| Lead V6 ± SD (ms) | 392.75 ± 33.99 | 420.35 ± 40.91 | 0.022* |
| Ratio Tp-Te/QT | |||
| Sandapan V4 ± SD (ms) | 0.194 ± 0.033 | 0.245 ± 0.025 | < 0.001* |
| Sandapan V5 ± SD (ms) | 0.202 ± 0.021 | 0.245 ± 0.024 | < 0.001* |
| Sandapan V6 ± SD (ms) | 0.191 ± 0.022 | 0.245 ± 0.028 | < 0.001* |
| Variable | Tp-Te/QT ratio in lead V4 | Tp-Te/QT ratio in lead V5 | Tp-Te/QT ratio in lead V6 | ||||||
|---|---|---|---|---|---|---|---|---|---|
| Increased (n = 11) | Normal (n = 35) | P | Increased (n = 13) | Normal (n = 33) | P | Increased (n = 13) | Normal (n = 33) | P | |
| ECG: electrocardiogram; RVOT: right ventricular outflow tract; LVOT: left ventricular outflow tract; SVT: supraventricular tachycardia; SD: standard deviation. *P < 0.05; 95% CI. | |||||||||
| Sex | |||||||||
| Female; n (%) | 5 (45.5%) | 27 (77.1%) | 0.106 | 8 (61.5%) | 24 (72.7%) | 0.699 | 8 (61.5%) | 24 (72.7%) | 0.699 |
| Male; n (%) | 6 (54.5%) | 8 (22.9%) | 5 (38.5%) | 9 (27.3%) | 5 (38.5%) | 9 (27.3%) | |||
| Age, mean ± SD (year) | 42.82 ± 13.33 | 44.14 ± 10.23 | 0.545 | 43.31 ± 12.493 | 45.09 ± 10.432 | 0.624 | 43.85 ± 12.536 | 44.88 ± 10.443 | 0.777 |
| Comorbidities | |||||||||
| Diabetes mellitus; n (%) | 1 (25%) | 3 (75%) | 1 | 1 (7.7%) | 3 (9.1%) | 1 | 1 (7.7%) | 3 (9.1%) | 1 |
| Hypertension; n (%) | 5 (45.5%) | 10(28.6) | 0.501 | 6 (46.2%) | 9 (27.3%) | 0.378 | 7 (53.8%) | 8 (24.2%) | 0.114 |
| LV hypertrophy; n (%) | 2 (18.2%) | 4 (11.4%) | 0.947 | 2 (15.4%) | 4 (12.1%) | 1 | 2 (15.4%) | 4 (12.1%) | 1 |
| SVT; n (%) | 0 (0%) | 0 (0%) | - | 0 (0%) | 0 (0%) | - | 0 (0%) | 0 (0%) | - |
| Ejection fraction | 64.0 ± 6.928 | 63.37 ± 5.857 | 0.768 | 64.0 ± 7.292 | 63.33 ± 5.611 | 0.741 | 64.31 ± 6.957 | 63.21 ± 5.749 | 0.586 |
| Drug consumption during ECG | |||||||||
| Verapamil; n (%) | 1 (2.8%) | 1 (2.8%) | 1 | 1 (2.8%) | 1 (2.8%) | 1 | 1 (2.8%) | 1 (2.8%) | 1 |
| Bisoprolol; n (%) | 1 (9.0%) | 3 (8.5%) | 1 | 1 (9.0%) | 3 (8.5%) | 1 | 1 (9.0%) | 3 (8.5%) | 1 |
| Metoprolol; n (%) | 0 (0%) | 1 (2.8%) | 1 | 0 (0%) | 1 (2.8%) | 1 | 0 (0%) | 1 (2.8%) | 1 |
| Arrhythmia source | |||||||||
| Septal RVOT | 1 (9.1%) | 13 (37.1%) | 0.165 | 2 (15.4%) | 12 (36.4%) | 0.3 | 3 (23.1%) | 11 (33.0%) | 0.745 |
| Anteroseptal RVOT | 0 (0%) | 5 (14.3%) | 0.44 | 1 (7.7%) | 4 (12.2%) | 1 | 0 (7.7%) | 5 (15.2%) | 0.337 |
| Posteroseptal RVOT | 2 (18.2%) | 1 (2.9%) | 0.273 | 2 (15.4%) | 1 (3.0%) | 0.387 | 2 (15.4%) | 1 (3.0%) | 0.387 |
| Basal septal RVOT | 0 (0%) | 1 (2.9%) | 1 | 0 (0%) | 1 (3.0%) | 1 | 0 (0%) | 1 (3.0%) | 1 |
| Anterior RVOT | 0 (0%) | 1 (2.9%) | 1 | 0 (0%) | 1 (3.0%) | 1 | 0 (0%) | 1 (3.0%) | 1 |
| Free wall RVOT | 1 (9.1%) | 2 (5.7%) | 1 | 1 (7.7%) | 2 (6.1%) | 1 | 1 (7.7%) | 2 (6.1%) | 1 |
| LVOT | 0 (0%) | 1 (2.9%) | 1 | 0 (0%) | 1 (3.0%) | 1 | 0 (0%) | 1 (3.0%) | 1 |
| Variable | PR | 95% CI | P |
|---|---|---|---|
| Tp-Te: Tpeak-Tend interval; PR: prevalence ratio. *P < 0.05; 95% CI. | |||
| Tp-Te/QT ratio | |||
| Lead V4 | 2.059 | 1.464 - 2.895 | 0.007* |
| Lead V5 | 2.200 | 1.514 - 3.197 | 0.002* |
| Lead V6 | 2.200 | 1.514 - 3.197 | 0.002* |
| Lead | VT incidence | Mean Tp-Te/QT ± SD (ms) | P |
|---|---|---|---|
| Tp-Te: Tpeak-Tend interval; SD: standard deviation. *P < 0.05; 95% CI. | |||
| V4 | Yes | 0.245 ± 0.025 | < 0.001* |
| No | 0.194 ± 0.033 | < 0.001* | |
| V5 | Yes | 0.245 ± 0.024 | < 0.001* |
| No | 0.202 ± 0.021 | < 0.001* | |
| V6 | Yes | 0.245 ± 0.028 | < 0.001* |
| No | 0.191 ± 0.022 | < 0.001* | |
| Variable | Exp (B) | 95% CI | P |
|---|---|---|---|
| Tp-Te: Tpeak-Tend interval; Exp (B): exponential beta. *P < 0.05; 95% CI. | |||
| Hypertension | 0.685 | 0.230 - 2.043 | 0.497 |
| Tp-Te/QT ratio (lead V6) | 1.29 | 0.444 - 3.747 | 0.639 |