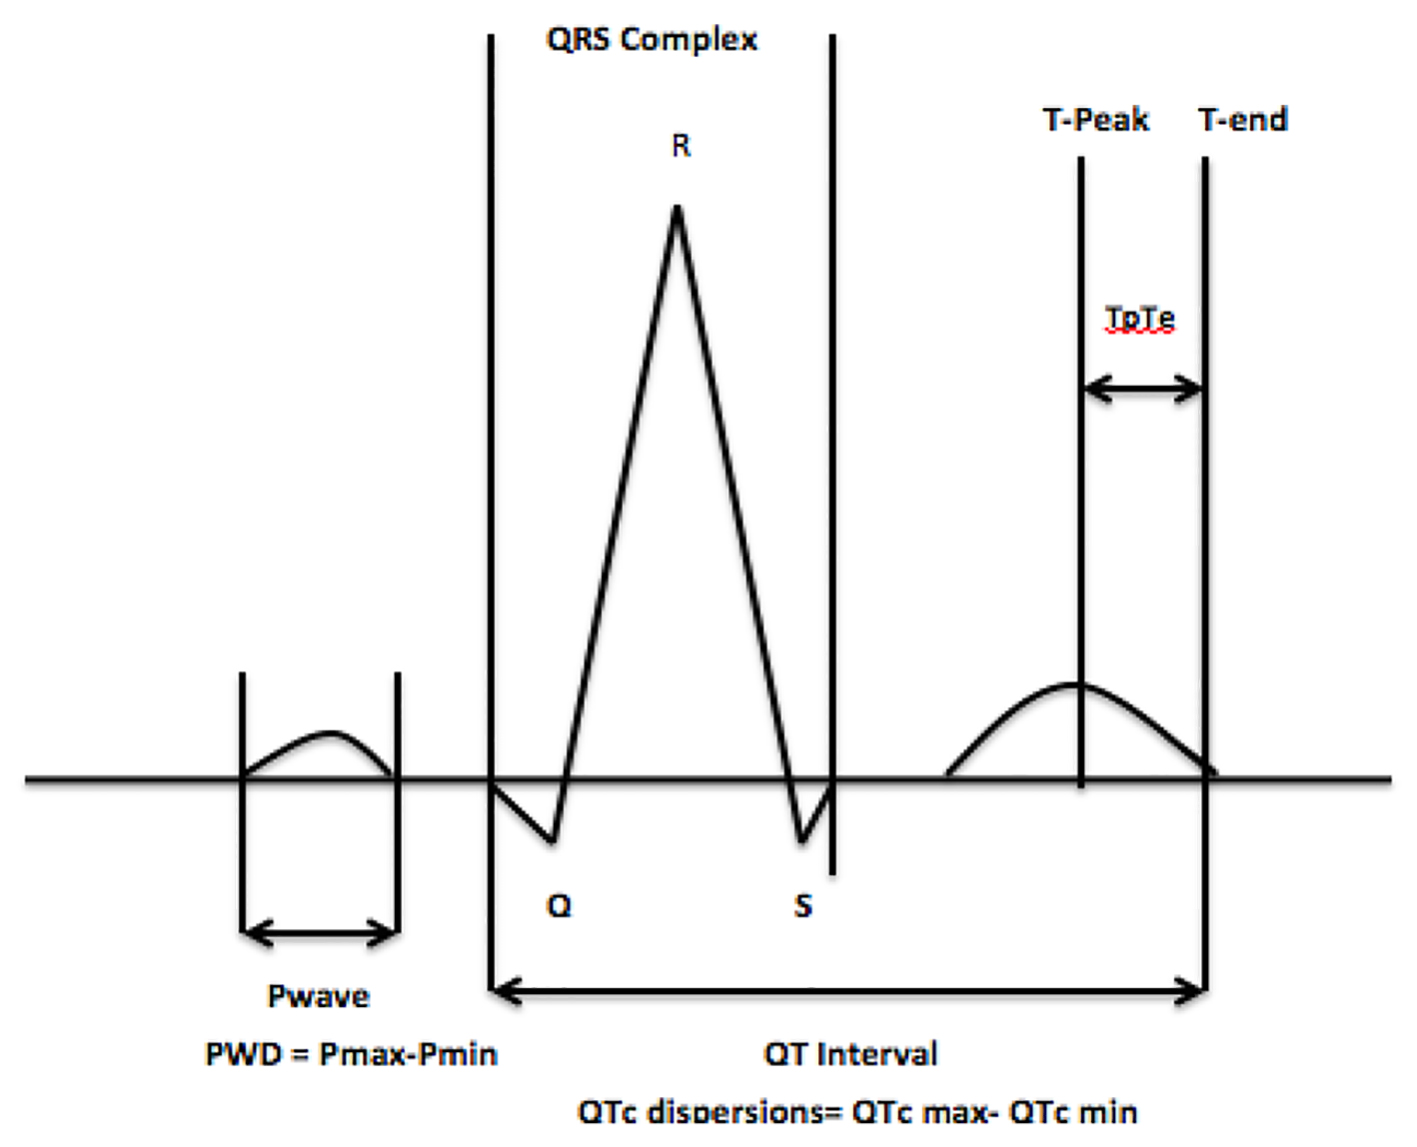
Figure 1. The Tp-Te interval, QTc and P-wave dispersion.
| Cardiology Research, ISSN 1923-2829 print, 1923-2837 online, Open Access |
| Article copyright, the authors; Journal compilation copyright, Cardiol Res and Elmer Press Inc |
| Journal website https://www.cardiologyres.org |
Original Article
Volume 8, Number 6, December 2017, pages 280-285
Evaluation of the Tp-Te Interval, QTc and P-Wave Dispersion in Patients With Coronary Artery Ectasia
Figure
Tables
| Variables | Group 1 (n = 20) | Group 2 (n = 20) | P value |
|---|---|---|---|
| FHx: family history; CAD: coronary artery disease. | |||
| Age | 63.2 ± 10.2 | 60 ± 8.8 | 0.58 |
| Gender (female, %) | 14/6 | 15/5 | 0.77 |
| Hypertension (%) | 12 (60%) | 11 (55%) | 0.31 |
| FHx of CAD (%) | 6 (30%) | 4 (20%) | 0.71 |
| Diabetes mellitus (n, %) | 4 (20%) | 3 (15%) | 0.40 |
| Smoking history (n, %) | 14 (70%) | 10 (50%) | 0.94 |
| Dyslipidemia (n, %) | 16 (80%) | 13 (65%) | 0.98 |
| Variables | CAE group (n = 20), mean ± SD | Control group (n = 20), mean ± SD | P value |
|---|---|---|---|
| Tp-Te: peak T wave duration to the end of T wave; QTc: corrected QT dispersions; VAT: ventricular activation time. | |||
| Tp-Te (ms) | 95.5 ± 9.01 | 84 ± 5.62 | < 0.001 |
| Tp-Te/QT ratio | 0.22 ± 0.02 | 0.20 ± 0.01 | < 0.001 |
| QTc dispersions (ms) | 31.2 ± 3.71 | 27.6 ± 2.82 | < 0.01 |
| P-wave dispersions (ms) | 31.9 ± 5.4 | 20 ± 3.77 | < 0.001 |
| VAT (ms) | 42 ± 2.63 | 43.72 ± 3.23 | 0.22 |