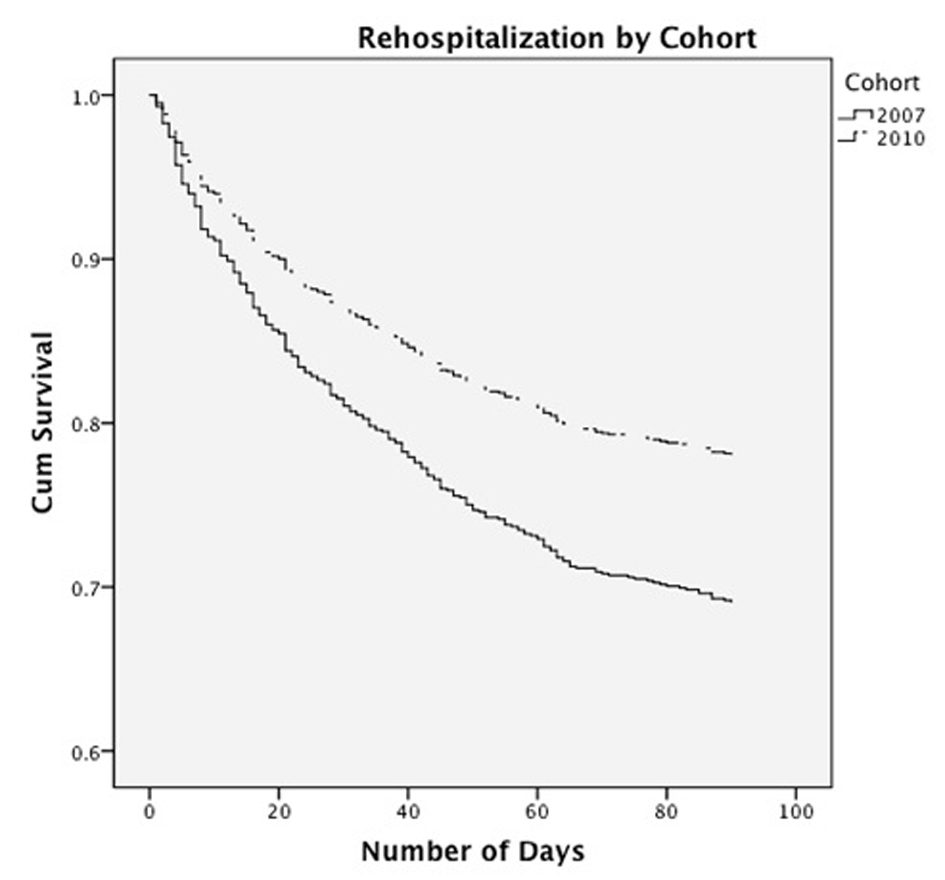
Figure 1. Rehospitalization curve by cohort.
| Cardiology Research, ISSN 1923-2829 print, 1923-2837 online, Open Access |
| Article copyright, the authors; Journal compilation copyright, Cardiol Res and Elmer Press Inc |
| Journal website https://www.cardiologyres.org |
Original Article
Volume 6, Number 1, February 2015, pages 201-208
A Strategy to Reduce Heart Failure Readmissions and Inpatient Costs
Figures
Tables
| Teach-back question | Area of focus |
|---|---|
| At the conclusion of the teaching each patient was asked four teach-back questions. | |
| What is the name of your water pill? | Medications |
| How much weight gain would you want to report to your MD? | Self-monitoring skills |
| What high-salt foods do you need to avoid/be aware of? | Diet modification |
| Please name 3 - 4 symptoms or warning signs of when you want to call the MD? | Warning signs for action |
| Variable | Usual care pre-TEACH (2007 - 2008) (n = 485) | Intervention post-TEACH (2010 - 2012) (n = 548) |
|---|---|---|
| *P < 0.05. | ||
| Age (years), mean ± SD | 80.1 ± 8.2 | 80.2 ± 8.3 |
| Female gender, % (n) | 53 (257) | 54 (296) |
| Smoking in the past year, % (n) | 5 (24) | 4 (22) |
| Married/partnered, % (n) | 41 (199) | 40 (218) |
| Do not resuscitate orders, % (n) | 13 (62) | 17 (95)* |
| Length of hospital stay (index hospitalization) (days), mean ± SD | 5.5 ± 7.0 | 5.6 ± 5.4 |
| Variable | Usual care pre-TEACH (2007 - 2008) (n = 485) | Intervention post-TEACH (2010 - 2012) (n = 548) |
|---|---|---|
| *P < 0.05, **P < 0.01, ***P < 0.001. §Twenty patients with unknown disposition data. | ||
| Rehospitalized within 30 days of discharge, % (n) after removing patients who had died (n = 29 died; n = 519) | 19 (93) | 12 (68)** |
| 2010 - 2011: 15.5 (52) (n = 335) 2011 - 2012: 8.7 (16)* (n = 184) | ||
| Rehospitalized within 90 days of discharge, % (n) after removing patients who had died (n = 56 died; n = 492) | 30 (147) | 19 (102)** |
| 2010 - 2011: 24.8 (78) (n = 315) 2011 - 2012: 14.1 (25) (n = 177) | ||
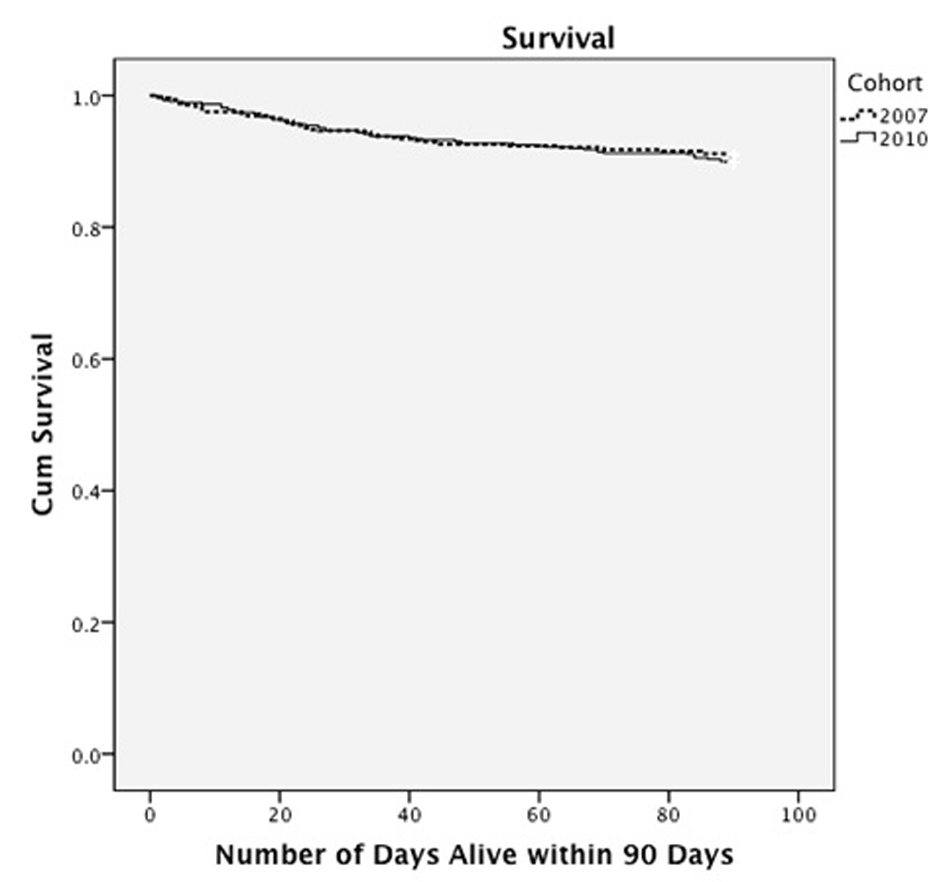
| Died within 30 days of discharge, % (n) | 5.3 (26) | 5.3 (29) |
| 2010 - 2011: 5.4 (20) 2011 - 2012: 4.6 (9) | ||
| Died within 90 days of discharge, % (n) | 9.1 (44) | 10.2 (56) |
| 2010 - 2011: 10.9 (40) 2011 - 2012: 8.1 (16) | ||
| Discharged home with no services, % (n) | 61 (296) | 31 (161)*** |
| Discharged with home health services, % (n) | 16 (79) | 49 (257)*** |
| Discharged to skilled nursing facility, % (n) | 18 (88) | 15 (79) |
| Discharged to acute hospital, % (n) | 0.8 (4) | 2 (12) |
| Discharged to hospice, % (n) | 3.7 (18) | 3 (18) (n = 527)§ |