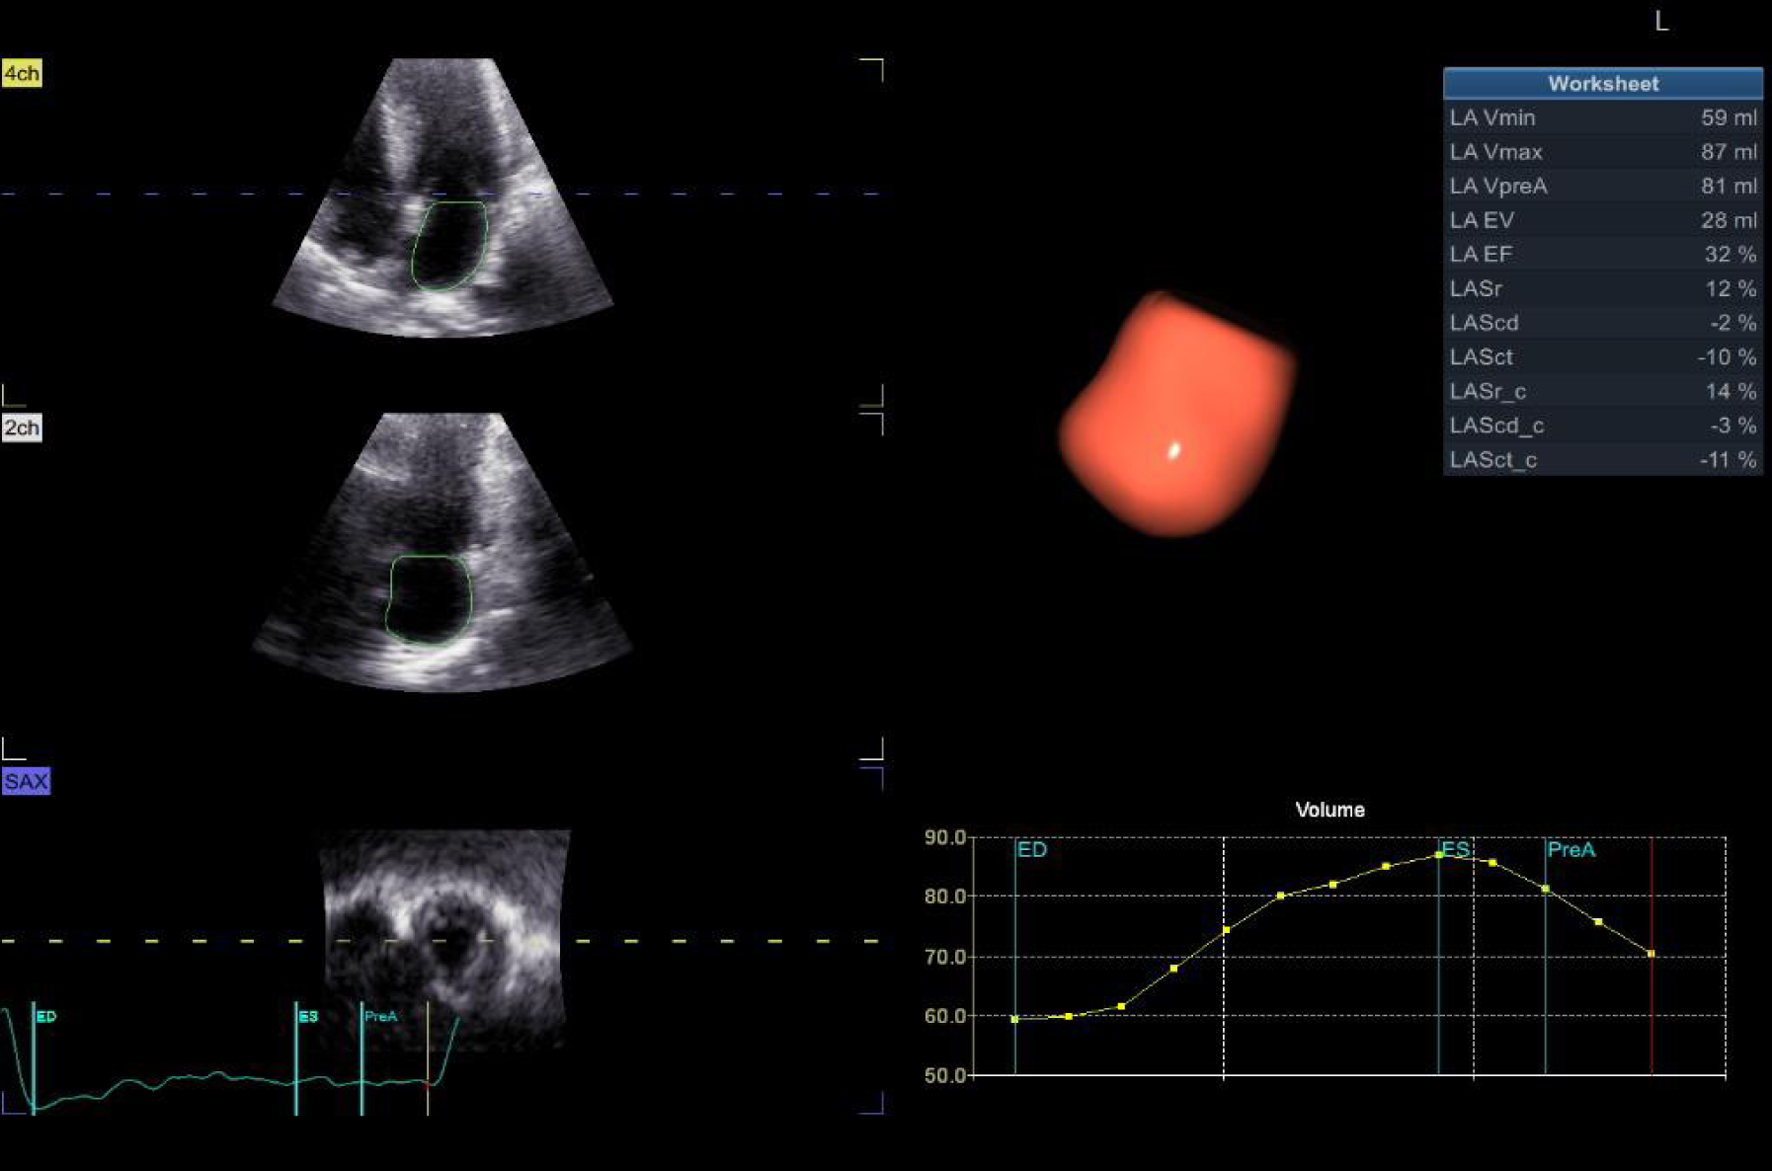
Figure 1. LA mechanics (volumetric and strain indices) by 3D echo. 3D: three-dimensional; LA: left atrial.
| Cardiology Research, ISSN 1923-2829 print, 1923-2837 online, Open Access |
| Article copyright, the authors; Journal compilation copyright, Cardiol Res and Elmer Press Inc |
| Journal website https://www.cardiologyres.org |
Original Article
Volume 15, Number 5, October 2024, pages 396-403
Detection of Left Atrial Remodeling by Three-Dimensional Echocardiography in Symptomatic Patients Known to Had Non-Obstructive Hypertrophic Cardiomyopathy
Figures
Tables
| Patients (n = 170) | Controls (n = 30) | P-value | |
|---|---|---|---|
| Data are presented as mean ± SD or number (%). *Significant P-value. BMI: body mass index; BSA: body surface area; SD: standard deviation. | |||
| Age (years) | 35 ± 10 | 28 ± 5 | < 0.001* |
| Sex | |||
| Male | 90 (52.9) | 16 (53.3) | 0.782 |
| Female | 80 (47.05) | 14 (46.7) | |
| BMI | 27.6 ± 1.6 | 27.2 ± 1 | 0.201 |
| BSA | 1.76 ± 0.09 | 1.76 ± 0.11 | 0.910 |
| Dimensions | |
|---|---|
| Data are presented as mean ± SD. 2D: two-dimensional; 3D: three-dimensional; LVEDD: left ventricular end-diastolic dimension; LVESD: left ventricular end-systolic dimension; IVSD: interventricular septal dimeter in diastole; IVSS: interventricular septal dimeter in systole; LVMI: LV mass index; LVPWDS: LV posterior wall dimeter in systole; LVPWDD: LV posterior wall dimeter in diastole; AROD: aortic root dimension; LA: left atrial; PG: pressure gradient; SD: standard deviation. | |
| LVEDD | 45 ± 4 |
| LVESD | 27 ± 5 |
| IVSD | 33 ± 7 |
| IVSS | 36 ± 6 |
| LVMI (3D echo) | 98 ± 8 |
| LVPWDS | 13 ± 1 |
| LVPWDD | 10 ± 1 |
| AORD | 26 ± 3 |
| LA dimension | 43 ± 4 |
| PG resting | 10 ± 1 |
| PG Valsalva | 13 ± 2 |
| Patients (n = 170) | Controls (n = 30) | P-value | |
|---|---|---|---|
| Data are presented as mean ± SD. *Significant P-value. PAP: pulmonary artery pressure; EF: ejection fraction; SD: standard deviation. | |||
| PAP (mm Hg) | 42 ± 7 | 27 ± 4 | < 0.001* |
| EF by Simpsons | 66 ± 4 | 65 ± 4 | 0.223 |
| Patients (n = 170) | Controls (n = 30) | P-value | |
|---|---|---|---|
| Data are presented as mean ± SD. *Significant P-values. 3D: three-dimensional; LA: left atrial; Vmax: maximum LA volume; Vmax indexed: indexed maximum LA volume; Vmin: minimum LA volume; Vpre-A: pre-LA contraction volume; LAEF: left atrium ejection fraction; LASr: left atrial strain at reservoir function; LAScd: left atrial strain at conduit function; LASct: left atrial strain at contractile function; SD: standard deviation. | |||
| Vmax | 80 ± 9 | 50 ± 5 | < 0.001* |
| Vmax indexed | 43.5 ± 5.6 | 28.7 ± 3.7 | < 0.001* |
| Vmin | 56 ± 10 | 30 ± 4 | < 0.001* |
| Vpre-A | 69 ± 10 | 41 ± 6 | < 0.001* |
| Total LAEF | 33 ± 5 | 45 ± 4 | < 0.001* |
| LASr | 24 ± 4 | 41 ± 3 | < 0.001* |
| LAScd | -13 ± 2 | -24 ± 2 | < 0.001* |
| LASct | -11 ± 2 | -18 ± 1 | < 0.001* |
| Patients (n = 170) | Controls (n = 30) | P-value | |
|---|---|---|---|
| Data are presented as mean ± SD. *Significant P-values. PW: pulsed wave; SD: standard deviation. | |||
| Peak E wave | 0.93 ± 0.12 | 0.96 ± 0.12 | 0.254 |
| Peak A wave | 0.58 ± 0.09 | 0.94 ± 0.11 | < 0.001* |
| E/e’ ratio | 17.3 ± 4.3 | 8 ± 1 | < 0.001* |
| Patients (n = 170) | Controls (n = 30) | P-value | |
|---|---|---|---|
| Data are presented as mean ± SD. *Significant P-values. LVGLS: LV global longitudinal strain; pLASRr: peak LA strain at reservoir function; pLASRcd: peak LA strain at conduit function; pLASRct: peak LA strain at contractile function; SD: standard deviation. | |||
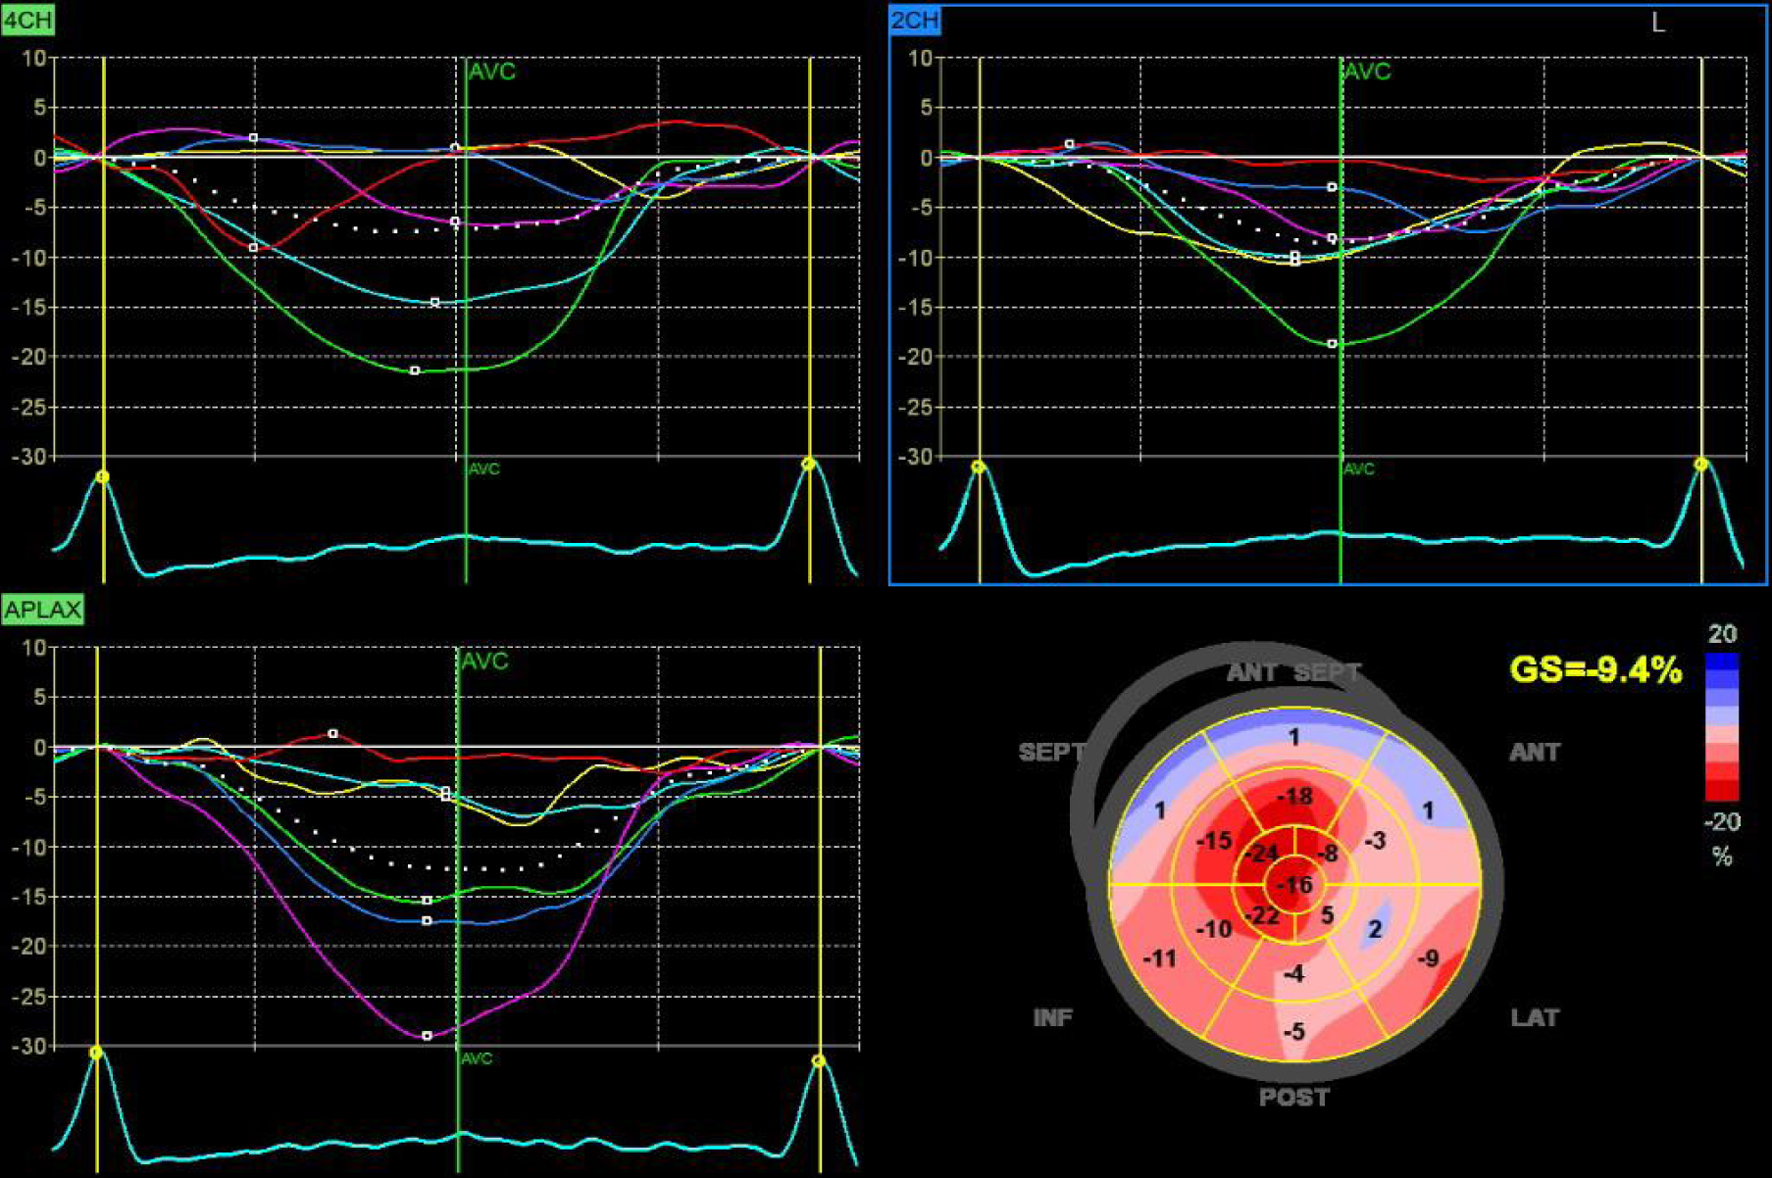
| LVGLS | -15 ± 1.4 | 22.5 ± 2 | < 0.001* |
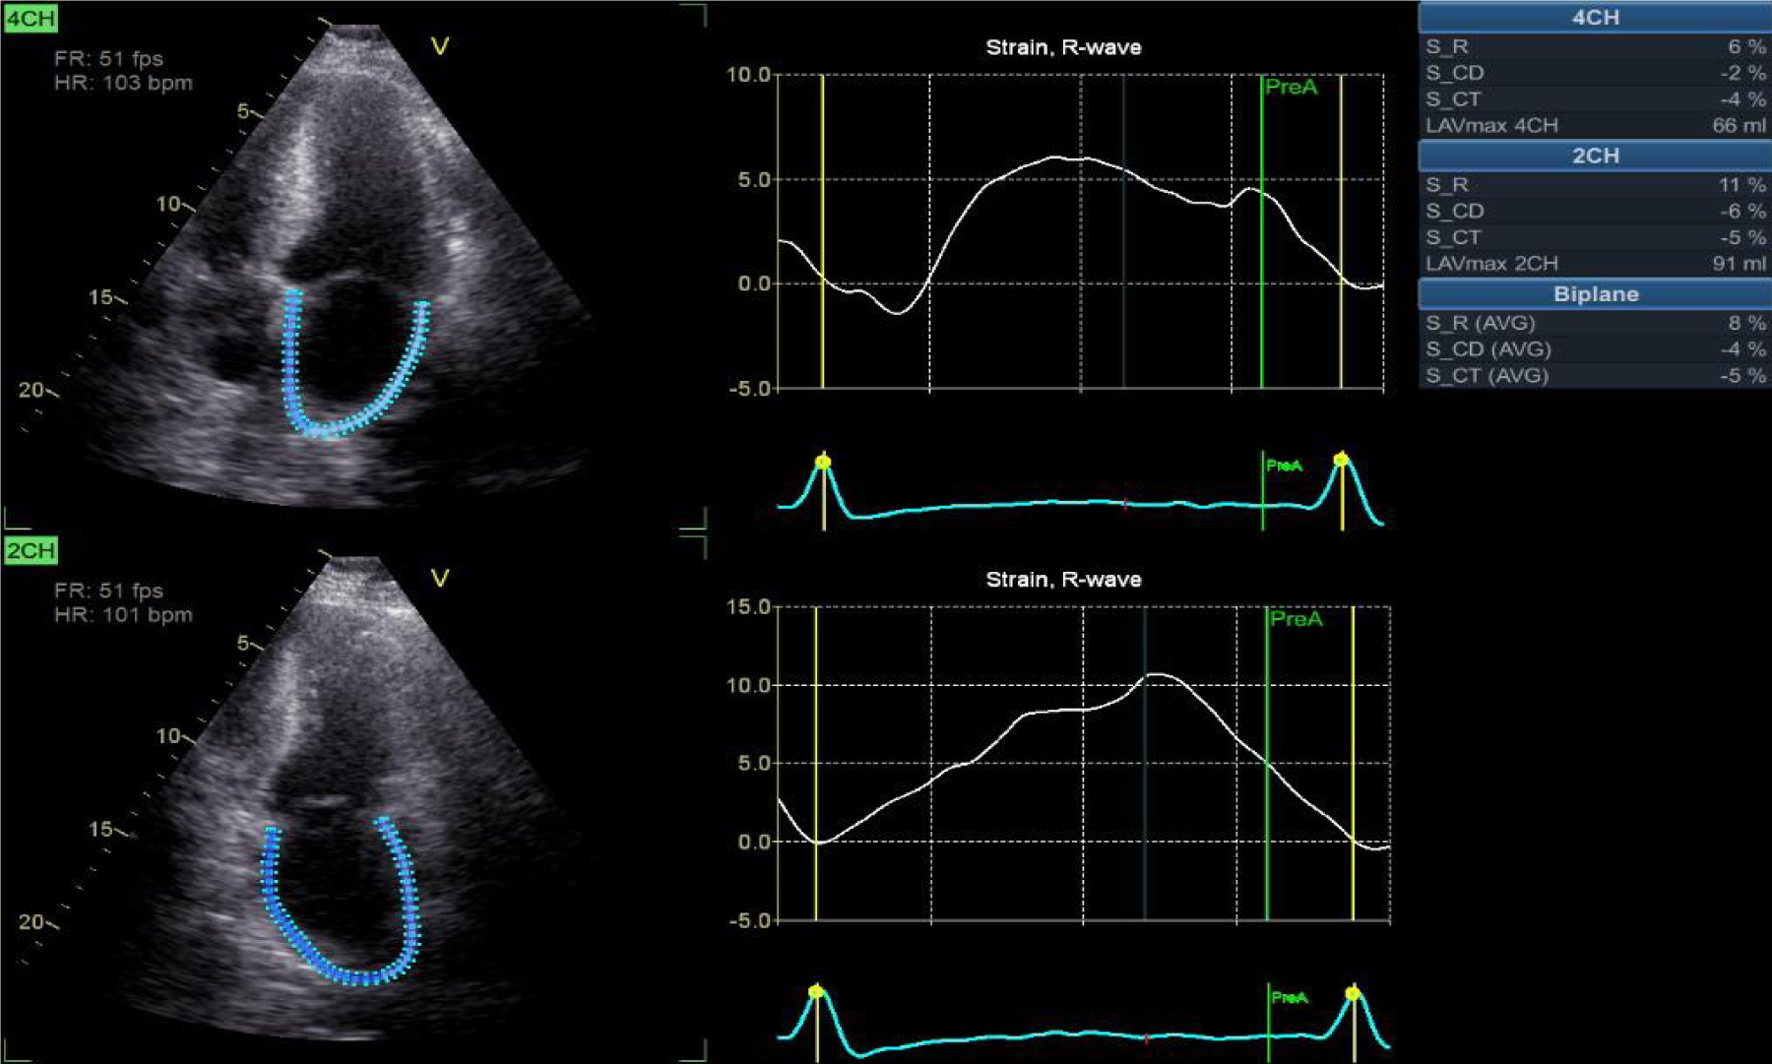
| pLASRr | 26 ± 4 | 43 ± 3 | < 0.001* |
| pLASRcd | -14 ± 2 | -25 ± 2 | < 0.001* |
| pLASRct | -12 ± 2 | -18 ± 1 | < 0.001* |
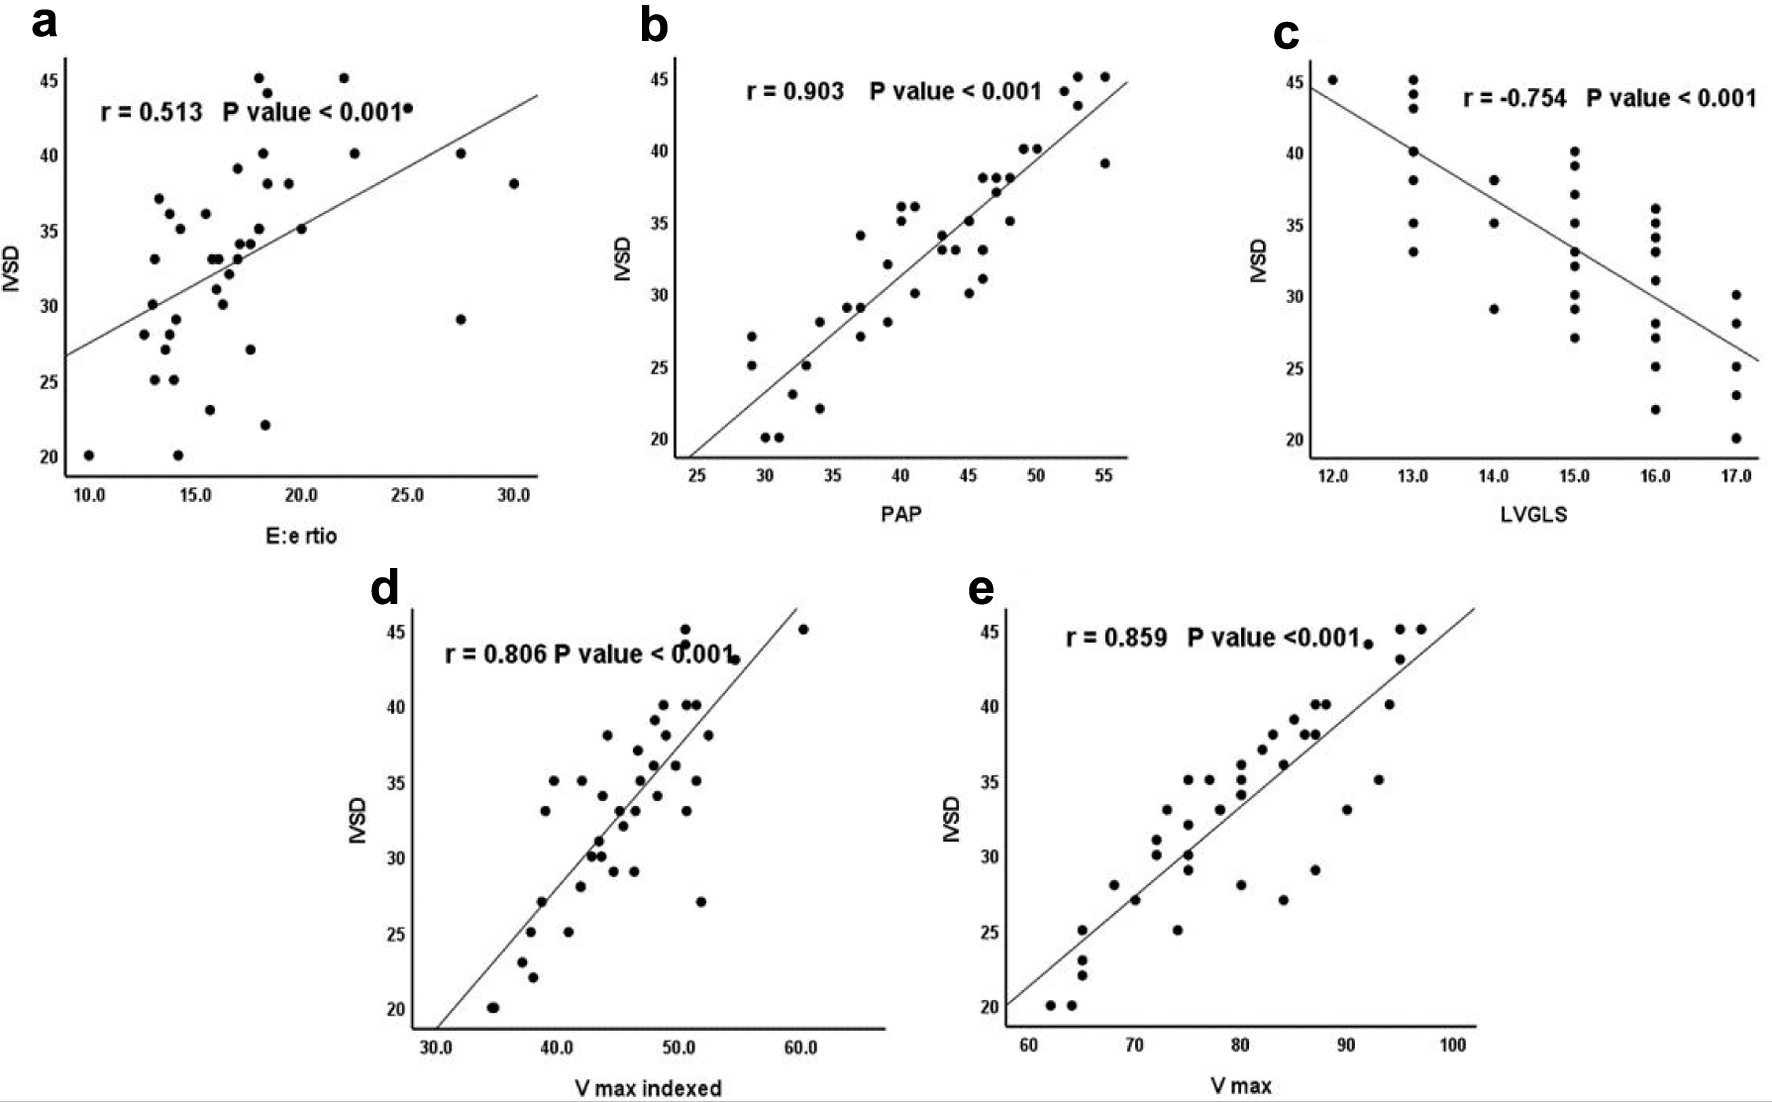
| IVSD | ||
|---|---|---|
| r | P | |
| r: correlation coefficient. *Significant P-values. IVSD: interventricular septal dimeter in diastole; LVGLS: LV global longitudinal strain; PAP: pulmonary artery pressure; Vmax: maximum LA volume; Vmax indexed: indexed maximum LA volume. | ||
| E/e ratio | 0.513 | < 0.001* |
| PAP | 0.903 | < 0.001* |
| LVGLS | -0.754 | < 0.001* |
| Vmax indexed | 0.806 | < 0.001* |
| Vmax | 0.859 | < 0.001* |