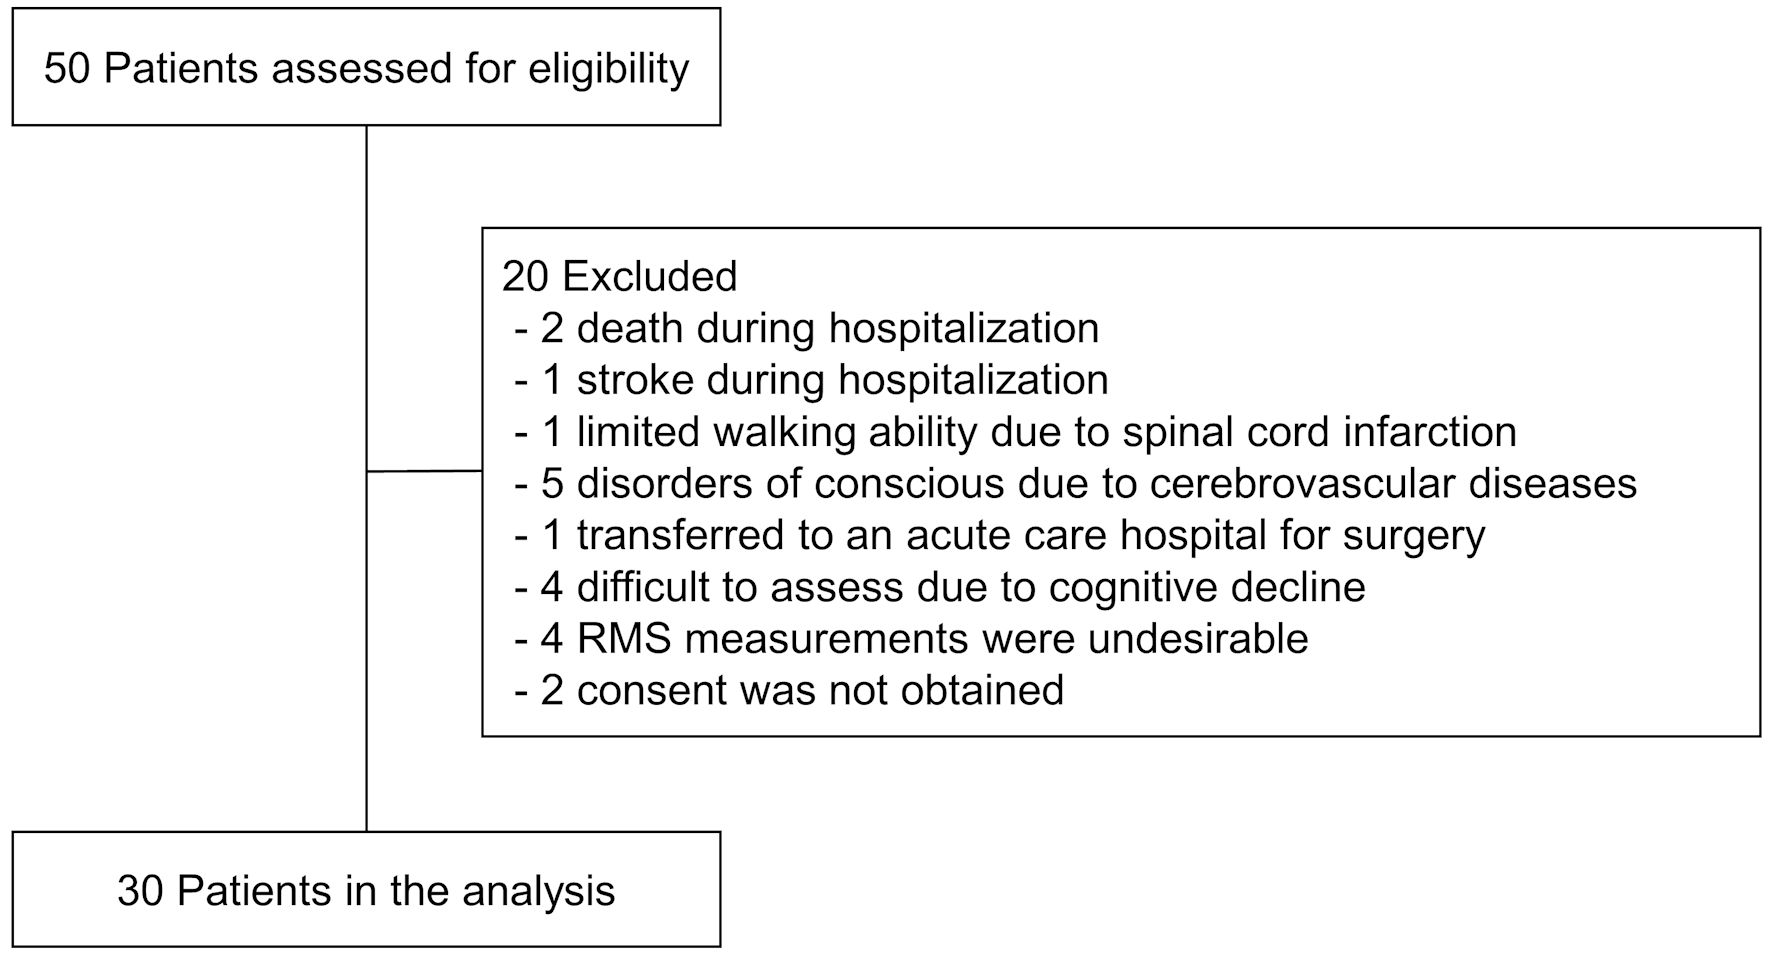
Figure 1. Flowchart of participants throughout the study. RMS: respiratory muscle strength.
| Cardiology Research, ISSN 1923-2829 print, 1923-2837 online, Open Access |
| Article copyright, the authors; Journal compilation copyright, Cardiol Res and Elmer Press Inc |
| Journal website https://www.cardiologyres.org |
Original Article
Volume 15, Number 1, February 2024, pages 56-66
Improving Respiratory Muscle Strength and Overall Function in Patients With Cardiovascular Disease Through Rehabilitation Hospitals
Figures
Tables
| N = 30 | ||
|---|---|---|
| AVG | SD | |
| AVG: average; SD: standard deviation; E/e’: early diastolic transmitral flow velocity to early diastolic mitral annular tissue velocity ratio; NYHA class: New York Heart Association functional classification; eGFR: estimated glomerular filtration rate; GNRI: geriatric nutritional risk index; ACEi: angiotensin-converting enzyme inhibitor; ARB: angiotensin II receptor blocker; CR: cardiac rehabilitation. | ||
| Basic data | ||
| Age (years) | 76.4 | 10.3 |
| Male, n (%) | 9 (30.0) | |
| Body mass index (kg/m2) | 20.0 | 4.1 |
| Barthel index before hospitalization | 97.0 | 6.4 |
| Kihon checklist before hospitalization | 7.5 | 5.3 |
| Robust, n (%) | 8 (26.7) | |
| Pre-frailty, n (%) | 10 (33.3) | |
| Frailty, n (%) | 12 (40.0) | |
| Living alone, n (%) | 18 (60.0) | |
| Length of hospital stay before transfer, days | 31.2 | 16.4 |
| Principal disease before transfer, n (%) | ||
| Heart failure | 4 (13.3) | |
| Cardiac surgery | 14 (46.7) | |
| Contents of cardiac surgery, n (%) | ||
| Coronary artery bypass grafting | 3 (21.4) | |
| Valve surgery | 2 (14.3) | |
| Multiple valve surgery | 5 (35.7) | |
| Coronary artery bypass grafting + valve surgery | 2 (14.3) | |
| Others | 2 (14.3) | |
| Aortic surgery | 10 (33.3) | |
| Combined surgery (cardiac and aortic surgery) | 2 (6.7) | |
| Information after transfer | ||
| Prevalence of possible respiratory sarcopenia | 28 (93.3) | |
| NYHA class, n (%) | ||
| Class 1 | 0 (0) | |
| Class 2 | 3 (10.0) | |
| Class 3 | 26 (86.7) | |
| Class 4 | 1 (3.3) | |
| Charlson comorbidity index | 2.7 | 1.5 |
| Comorbidities, n (%) | ||
| Diabetes mellitus | 8 (26.7) | |
| Chronic heart failure | 12 (40.0) | |
| Chronic kidney disease | 6 (20.0) | |
| Chronic obstructive pulmonary disease | 2 (6.7) | |
| Musculoskeletal disorders | 15 (50.0) | |
| Cerebrovascular disease | 7 (23.3) | |
| Peripheral arterial disease | 1 (3.3) | |
| Echocardiography | ||
| Left ventricular ejection fraction, % | 55.5 | 11.3 |
| Left atrial dimension, mm | 36.3 | 7.6 |
| E/e’ | 15.0 | 5.7 |
| Laboratory data | ||
| Hemoglobin, g/dL | 11.3 | 1.4 |
| Albumin, g/dL | 3.3 | 0.4 |
| Creatinine, mg/dL | 0.95 | 0.45 |
| eGFR, mL/min/1.73 m2 | 59.5 | 26.7 |
| C-reactive protein, mg/dL | 1.94 | 2.53 |
| Brain natriuretic peptide, pg/mL | 176.3 | 108.9 |
| GNRI | 86.5 | 11.2 |
| Medication, n (%) | ||
| Beta-blocker | 21 (70.0) | |
| ACEIi/ARB | 8 (26.7) | |
| Diuretics | 17 (56.7) | |
| Others | ||
| Total CR time, min/day | 132.5 | 13.4 |
| Percentage with combined breathing training, n (%) | 19 (63.3) | |
| Length of hospital stay, days | 65.9 | 30.4 |
| Home discharge, n (%) | 28 (93.3) | |
| Amount of change | On beta-blocker (n = 21) | Off beta-blocker (n = 9) | P value | ||
|---|---|---|---|---|---|
| AVG | SD | AVG | SD | ||
| AVG: average; SD: standard deviation; %MIP: % maximal inspiratory pressure; %MEP: % maximal expiratory pressure; FIM: functional independence measure; SPPB: short physical performance battery; 6MD: 6-min walking distance. | |||||
| %MIP, % | 53.3 | 40.3 | 35.7 | 53.5 | 0.328 |
| %MEP, % | 26.5 | 33.4 | 49.1 | 76.5 | 0.264 |
| FIM, points | 43.2 | 13.4 | 45.3 | 12.0 | 0.690 |
| SPPB, points | 3.3 | 2.2 | 3.4 | 2.8 | 0.929 |
| Gait speed, m/s | 0.39 | 0.28 | 0.41 | 0.31 | 0.884 |
| Hand grip strength, kg | 1.3 | 2.6 | 1.2 | 2.1 | 0.971 |
| Knee extension strength, %BW | 10.1 | 6.0 | 9.9 | 11.7 | 0.962 |
| 6MD, m | 97.2 | 59.9 | 179.8 | 114.7 | 0.087 |
| Before rehabilitation | After rehabilitation | P value | |||
|---|---|---|---|---|---|
| AVG | SD | AVG | SD | ||
| AVG: average; SD: standard deviation; FIM: functional independence measure; SPPB: short physical performance battery; 6MD: 6-min walking distance; MMSE: mini-mental state examination; EQ-5D-5L: EuroQol five-dimension five-level. | |||||
| FIM, points | 72.0 | 16.8 | 116.0 | 10.1 | < 0.001 |
| FIM-motor, points | 46.3 | 11.9 | 82.7 | 8.1 | < 0.001 |
| FIM-cognitive, points | 25.7 | 7.6 | 33.2 | 3.5 | < 0.001 |
| SPPB, points | 7.5 | 3.1 | 10.7 | 2.0 | < 0.001 |
| Gait speed, m/s | 0.76 | 0.32 | 1.14 | 0.39 | < 0.001 |
| Hand grip strength, kg | 16.2 | 6.2 | 17.3 | 6.1 | 0.010 |
| Knee extension strength, %BW | 30.6 | 15.1 | 40.6 | 17.8 | < 0.001 |
| 6MD, m | 222.9 | 124.9 | 341.5 | 128.7 | < 0.001 |
| MMSE, points | 26.6 | 2.8 | 27.4 | 2.9 | 0.038 |
| EQ-5D-5L | 0.588 | 0.168 | 0.790 | 0.183 | < 0.001 |
| Mobility | -0.078 | 0.074 | -0.025 | 0.044 | |
| Self-care | -0.042 | 0.042 | -0.019 | 0.028 | |
| Usual activities | -0.094 | 0.058 | -0.038 | 0.047 | |
| Pain/discomfort | -0.046 | 0.034 | -0.026 | 0.028 | |
| Anxiety/depression | -0.053 | 0.051 | -0.035 | 0.053 | |