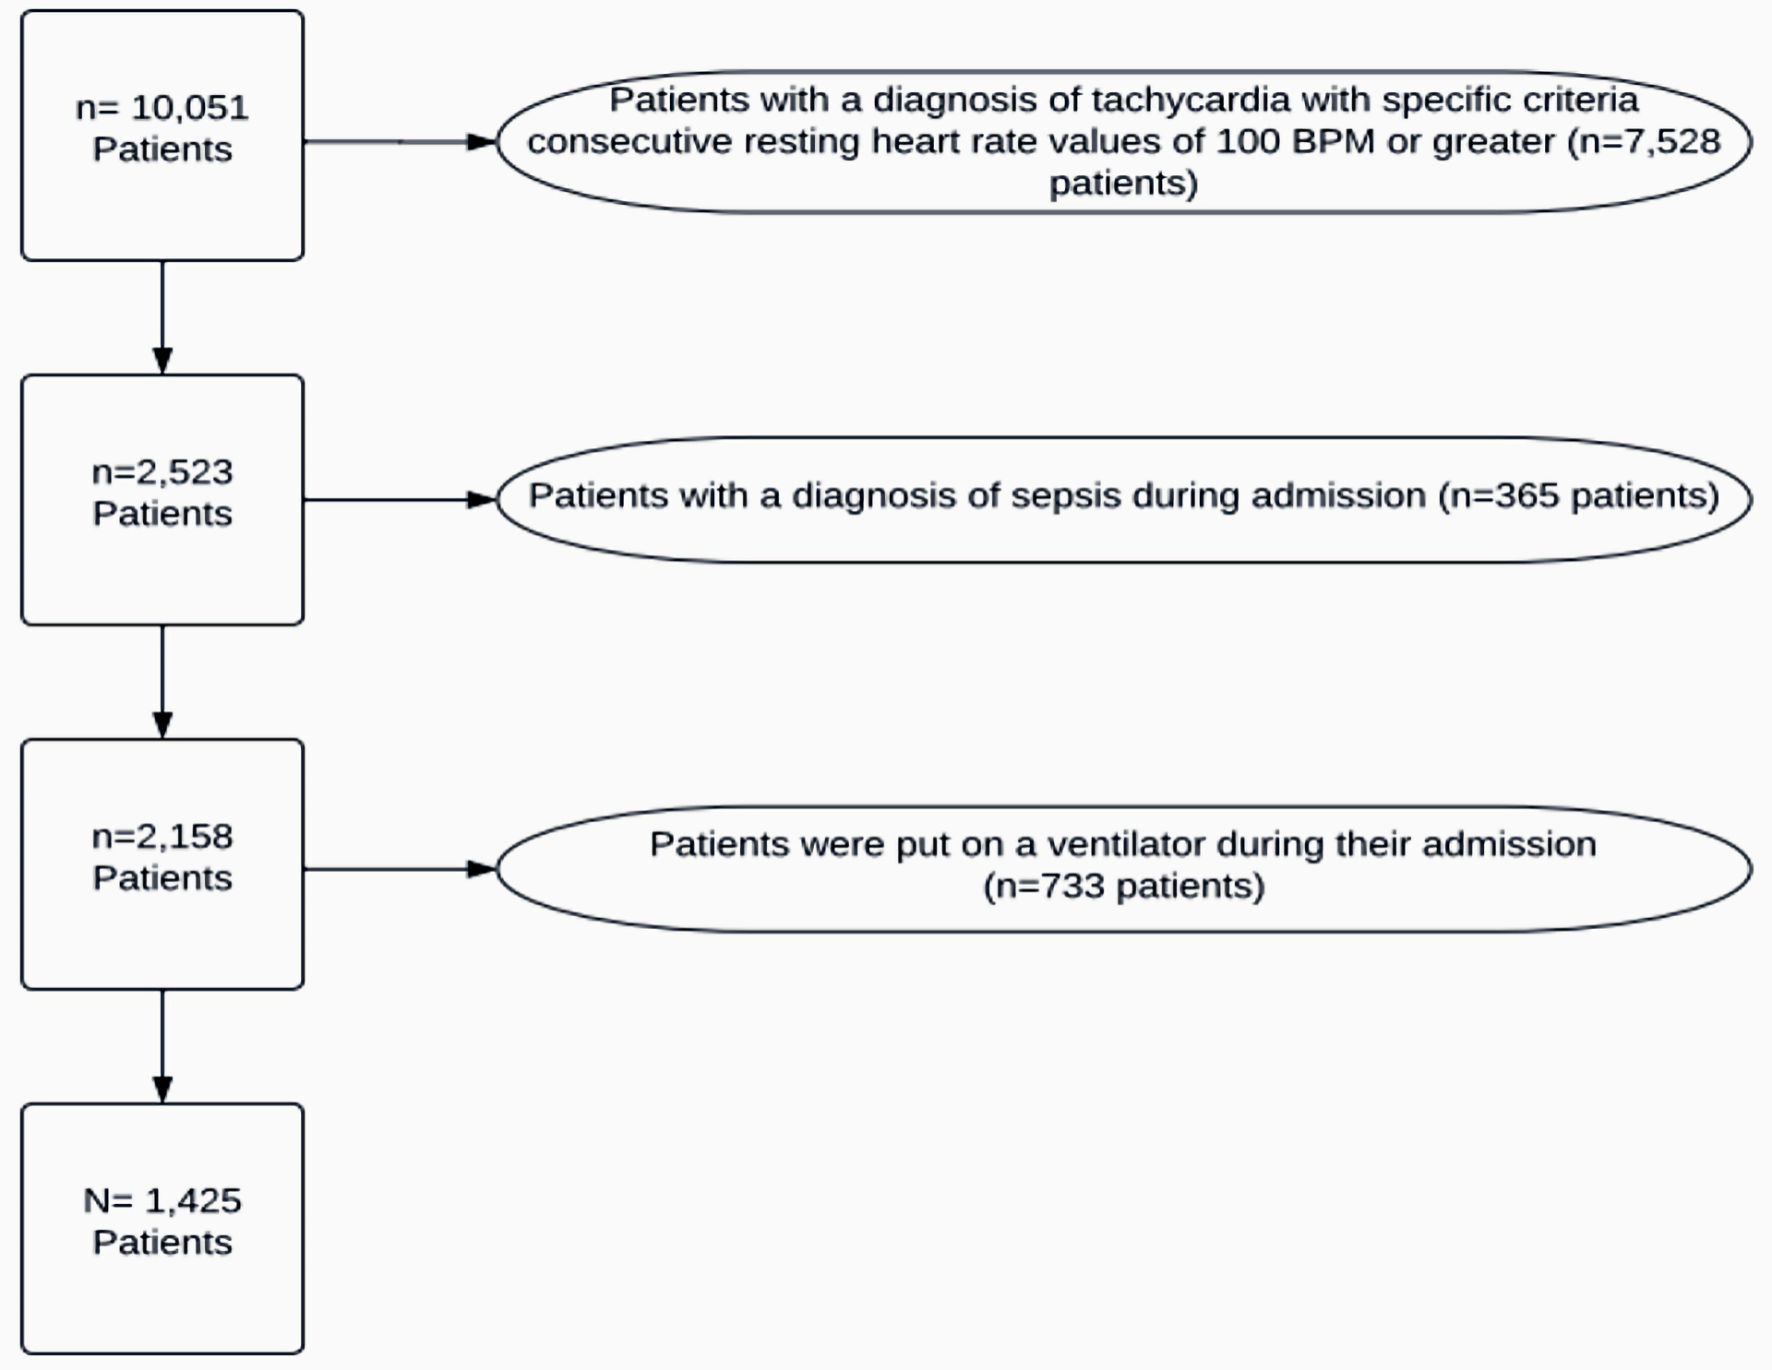
Figure 1. Patient exclusions. BPM: beats per minute.
| Cardiology Research, ISSN 1923-2829 print, 1923-2837 online, Open Access |
| Article copyright, the authors; Journal compilation copyright, Cardiol Res and Elmer Press Inc |
| Journal website https://www.cardiologyres.org |
Original Article
Volume 15, Number 1, February 2024, pages 47-55
Evaluation of the Existence of Post-COVID-19 Tachycardia in a Community Healthcare System
Figures
Tables
| COVID-19: coronavirus disease 2019; PCT: post-COVID-19 tachycardia. | |
| Resolution of COVID-19 infection | Negative repeat (second) COVID-19 test in the inpatient setting during the same admission |
| Time of more than/equal to 10 days duration after symptoms onset and after resolution of fever for at least 24 h and improvement of symptoms | |
| Document formal diagnosis of post-COVID-19 syndrome | |
| Time of 3 days prior to discharge or at the day of discharge | |
| Criteria for PCT | A documented formal diagnosis of sinus tachycardia |
| Sinus tachycardia was recorded between 7:00 pm to 6:00 am on 3 separate days | |
| Sinus tachycardia recorded between 12:00 am to 6:00 am on the day of discharge | |
| Persistent tachycardia on three separate occasions in a day for at least 3 days | |
| B | SE | Wald | df | Significance | Exp(B) | 95% CI for Exp(B) | ||
|---|---|---|---|---|---|---|---|---|
| Lower | Upper | |||||||
| SE: standard error; COVID-19: coronavirus disease 2019; CI: confidence interval. | ||||||||
| Other | 21.971 | 4 | 0.000 | |||||
| Commercial | 1.152 | 0.352 | 10.716 | 1 | 0.001 | 3.163 | 1.587 | 6.303 |
| Medicaid | 0.300 | 0.302 | 0.984 | 1 | 0.321 | 1.349 | 0.746 | 2.440 |
| Medicare | 0.3555 | 0.330 | 1.156 | 1 | 0.282 | 1.426 | 0.746 | 2.726 |
| Self-pay | 0.156 | 0.307 | 0.260 | 1 | 0.610 | 1.169 | 0.641 | 2.133 |
| Age | -0.006 | 0.004 | 2.285 | 1 | 0.131 | 0.994 | 0.986 | 1.002 |
| Length of stay | -0.104 | 0.012 | 68.743 | 1 | < 0.001 | 0.902 | 0.880 | 0.924 |
| Never smoked | 1 | 11.839 | 3 | |||||
| Former smoker | 0.899 | 0.463 | 3.767 | 1 | 0.052 | 2.457 | 0.991 | 6.090 |
| Current smoker | 0.569 | 0.468 | 1.1476 | 1 | 0.224 | 1.767 | 0.705 | 4.424 |
| Unknown smoker | 1.193 | 0.494 | 5.840 | 1 | 0.016 | 3.297 | 1.253 | 8.674 |
| COVID-19 severity | -0.287 | 0.135 | 4.510 | 1 | 0.034 | 0.750 | 0.575 | 0.978 |
| Constant | -0.780 | 0.552 | 1.997 | 1 | 0.158 | 0.458 | ||
| No PCT | PCT | Total | |||||||||
|---|---|---|---|---|---|---|---|---|---|---|---|
| Count | Expected count | Percentage within groups (race, insurance, age, gender, comorbidities, COVID-19 severity, and readmissions) | Standardized residual | Count | Expected count | Percentage within race group | Standardized residual | Count | Expected count | Percentage within PCT | |
| COVID-19: coronavirus disease 2019; PCT: post-COVID-19 tachycardia. | |||||||||||
| Race | |||||||||||
| White | 834 | 823.8 | 74.60% | 0.4 | 284 | 294.2 | 25.40% | -0.6 | 1,118 | 1,118 | |
| African American | 107 | 110.5 | 71.30% | 0.3 | 43 | 39.5 | 28.70% | 0.6 | 150 | 150 | |
| Asian | 10 | 11.8 | 62.50% | 0.5 | 6 | 4.2 | 37.50% | 0.9 | 16 | 16 | |
| Other | 96 | 100.2 | 70.60% | 0.4 | 40 | 35.8 | 29.40% | 0.7 | 136 | 136 | |
| Financial status/insurance | |||||||||||
| Commercial | 222 | 235.1 | 69.60% | 0.9 | 97 | 83.9 | 30.40% | 1.4 | 319 | 319 | |
| Medicaid | 82 | 90.6 | 66.70% | 0.9 | 41 | 32.4 | 33.30% | 1.5 | 123 | 123 | |
| Medicare | 630 | 582.8 | 79.60% | 2 | 161 | 208.2 | 20.40% | -3.3 | 791 | 791 | |
| Self-pay | 51 | 55.3 | 68% | 0.6 | 24 | 19.7 | 32% | 1 | 75 | 75 | |
| Other | 65 | 86.2 | 55.60% | 2.3 | 52 | 30.8 | 44.40% | 3.8 | 117 | 117 | |
| Age | |||||||||||
| Less than 65 | 506 | 536.4 | 69.50% | 1.3 | 222 | 191.6 | 30.50% | 2.2 | 728 | 728 | |
| 65 - 75 | 212 | 191.6 | 81.50% | 1.5 | 48 | 68.4 | 18.50% | -2.5 | 260 | 260 | |
| Over 75 | 332b | 322 | 76.00% | 0.6 | 105 | 115 | 24.00% | -0.9 | 437 | 437 | |
| Gender | |||||||||||
| Male | 524 | 518 | 74.50% | 0.3 | 179 | 185 | 25.50% | -0.4 | 703 | 703 | |
| Female | 526 | 532 | 72.90% | 0.3 | 196 | 190 | 27.10% | 0.4 | 722 | 722 | |
| Comorbidities | |||||||||||
| 0 | 209 | 229 | 20.40% | 1.3 | 101 | 81 | 27.90% | 2.2 | 310 | 310 | 22.40% |
| 1 | 259 | 245.3 | 25.30% | 0.9 | 73 | 86.7 | 20.20% | -1.5 | 332 | 332 | 24.00% |
| 2 | 177 | 181.7 | 17.30% | 0.4 | 69 | 64.3 | 19.10% | 0.6 | 246 | 246 | 17.70% |
| 3 | 174 | 160.3 | 17.00% | 1.1 | 43 | 56.7 | 11.90% | -1.8 | 217 | 217 | 15.70% |
| 4+ | 205 | 207.6 | 20.00% | 0.2 | 76 | 73.4 | 21.00% | 0.3 | 281 | 281 | 20.30% |
| COVID-19 severity | |||||||||||
| Less severe | 575 | 600.5 | -1 | 240 | 214.5 | 1.7 | 815 | 815 | |||
| More severe | 475 | 449.5 | 1.2 | 135 | 160.5 | -2 | 610 | 610 | |||
| Readmission rates | |||||||||||
| No 30-day readmission | 943 | 925.5 | 75.10% | 0.6 | 313 | 330.5 | 24.90% | -1 | 1,256 | 1,256 | 88.10% |
| 30-day readmission | 107 | 124.5 | 63.30% | 1.6 | 62 | 44.5 | 36.70% | 2.6 | 169 | 169 | 11.90% |