Figures
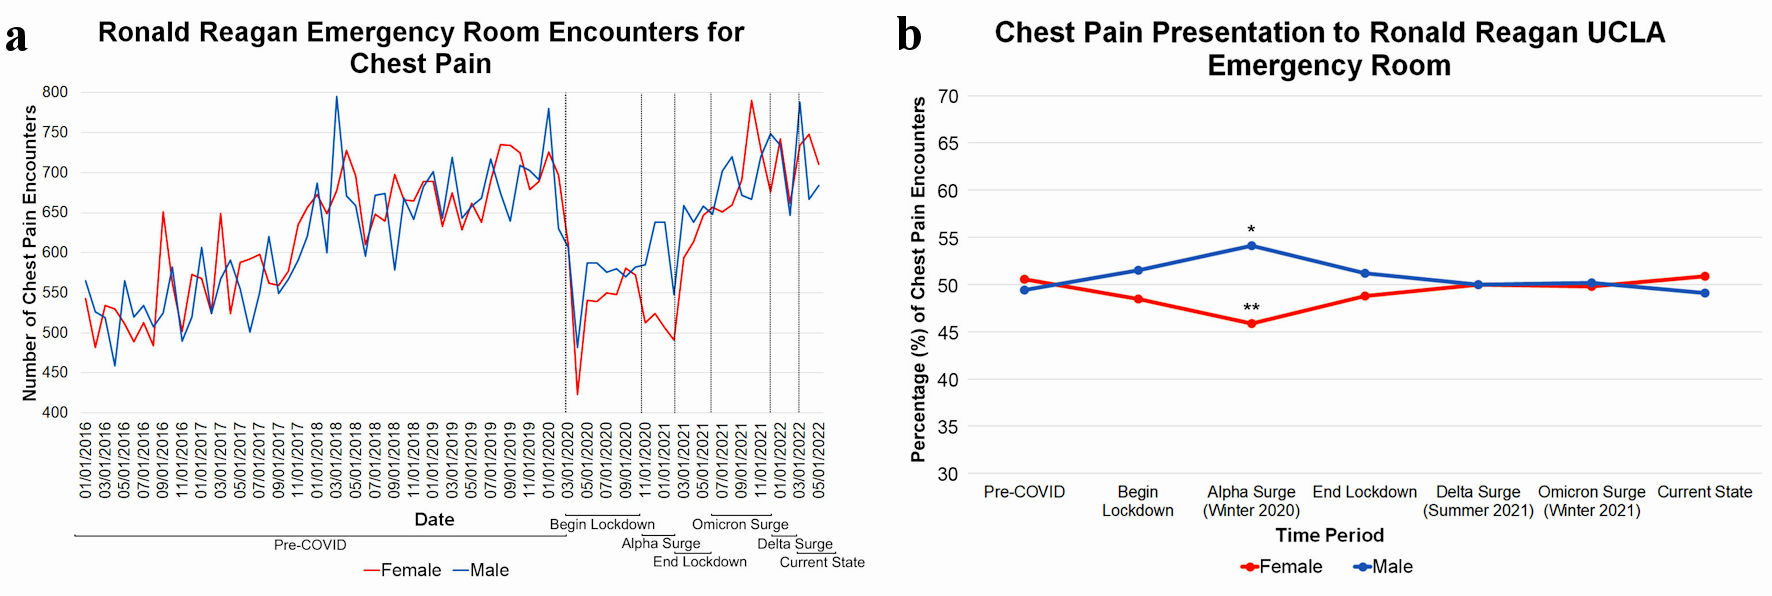
Figure 1. (a) Total chest pain encounters to the UCLA Emergency Department (ED) over time between females (red) and males (blue). Vertical dotted lines denote COVID-19 time periods (pre-COVID (before March 2020), begin lockdown (March 2020 to November 2020), alpha surge (November 2020 to January 2021), end lockdown (February 2021 to June 2021), delta surge (June 2021 to December 2021), omicron surge (December 2021 to February 2022), current state (March 2022 to May 2022)). ED visits for chest pain fell 38% at the start of lockdown. (b) Percentage of total chest pain encounters that are females and males. Females and males presented in similar proportions prior to COVID-19 (50.6% vs. 49.4% respectively, mean difference (d) = 1.2%, confidence interval (CI): 0-1.0%, P < 0.001). Females had a significant decrease (48% vs. 52%, d = 4%, CI: 2.4-5.4%, P < 0.00) in presentation compared to males during the lockdown period. Proportions returned to pre-COVID-19 numbers after the lockdown was lifted. **Statistical significance between male and female. *Statistical significance between pre-COVID and alpha surge. COVID-19: coronavirus disease 2019.
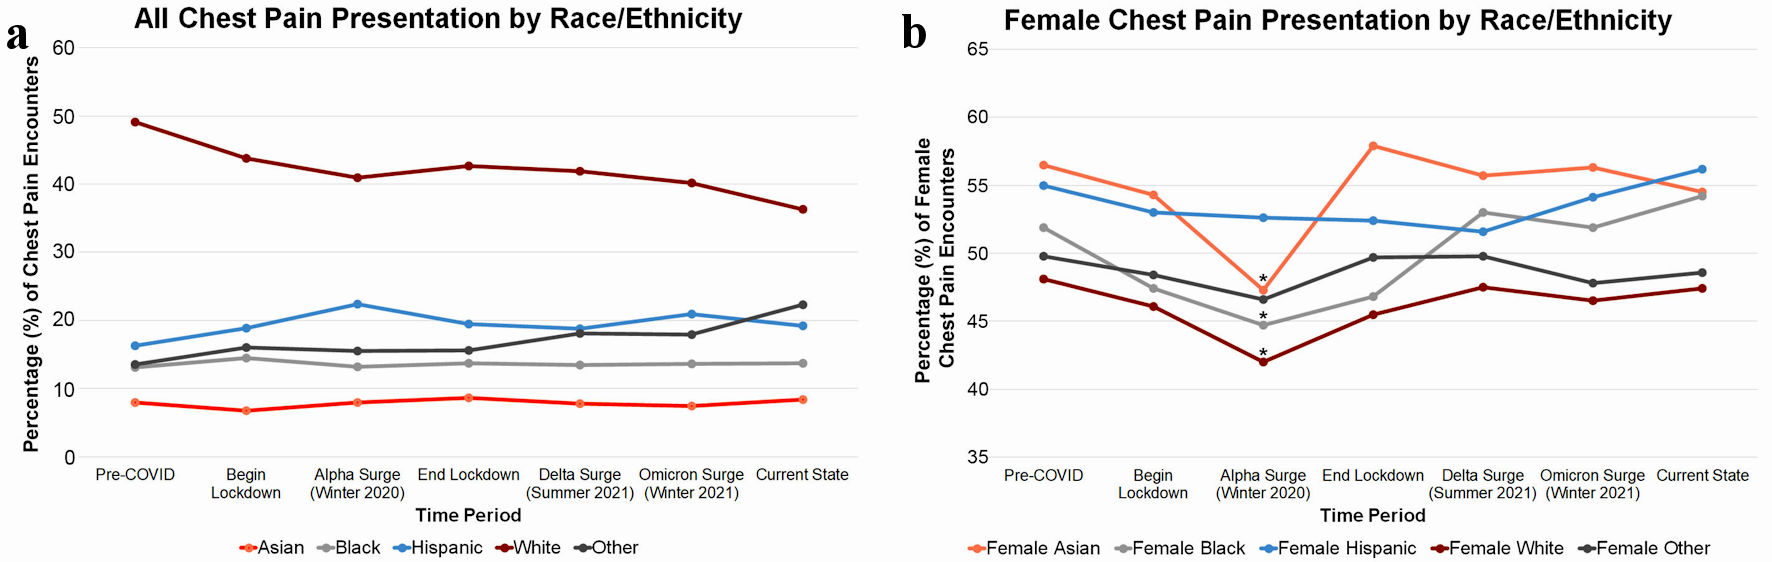
Figure 2. (a) Percentage of all chest pain presentation by race and ethnicity. White patients presented the most with chest pain prior to and during the pandemic. White patients had a decrease in proportion of chest pain presentations during the pandemic. Asian patients consistently were least likely to present with chest pain. (b) Percentage of female chest pain presentation by race and ethnicity. The proportion of Asian females significantly dropped between alpha surge and pre-COVID-19 (47.3% vs. 56.5%, mean difference (d) = 9.2%, confidence interval (CI): 3.1-15.3%, P < 0.05). Black females (44.7% vs. 51.9%, d = 7.2%, CI: 2.5-12.0%, P < 0.005) and White females (42.0% vs. 48.1%, d = 6.0%, CI: 3.3-8.7%, P < 0.001) also has significant decrease in proportions during this time. Proportions returned to baselines after lockdown was lifted. *Statistical significance between time periods compared to pre-COVID-19. COVID-19: coronavirus disease 2019.
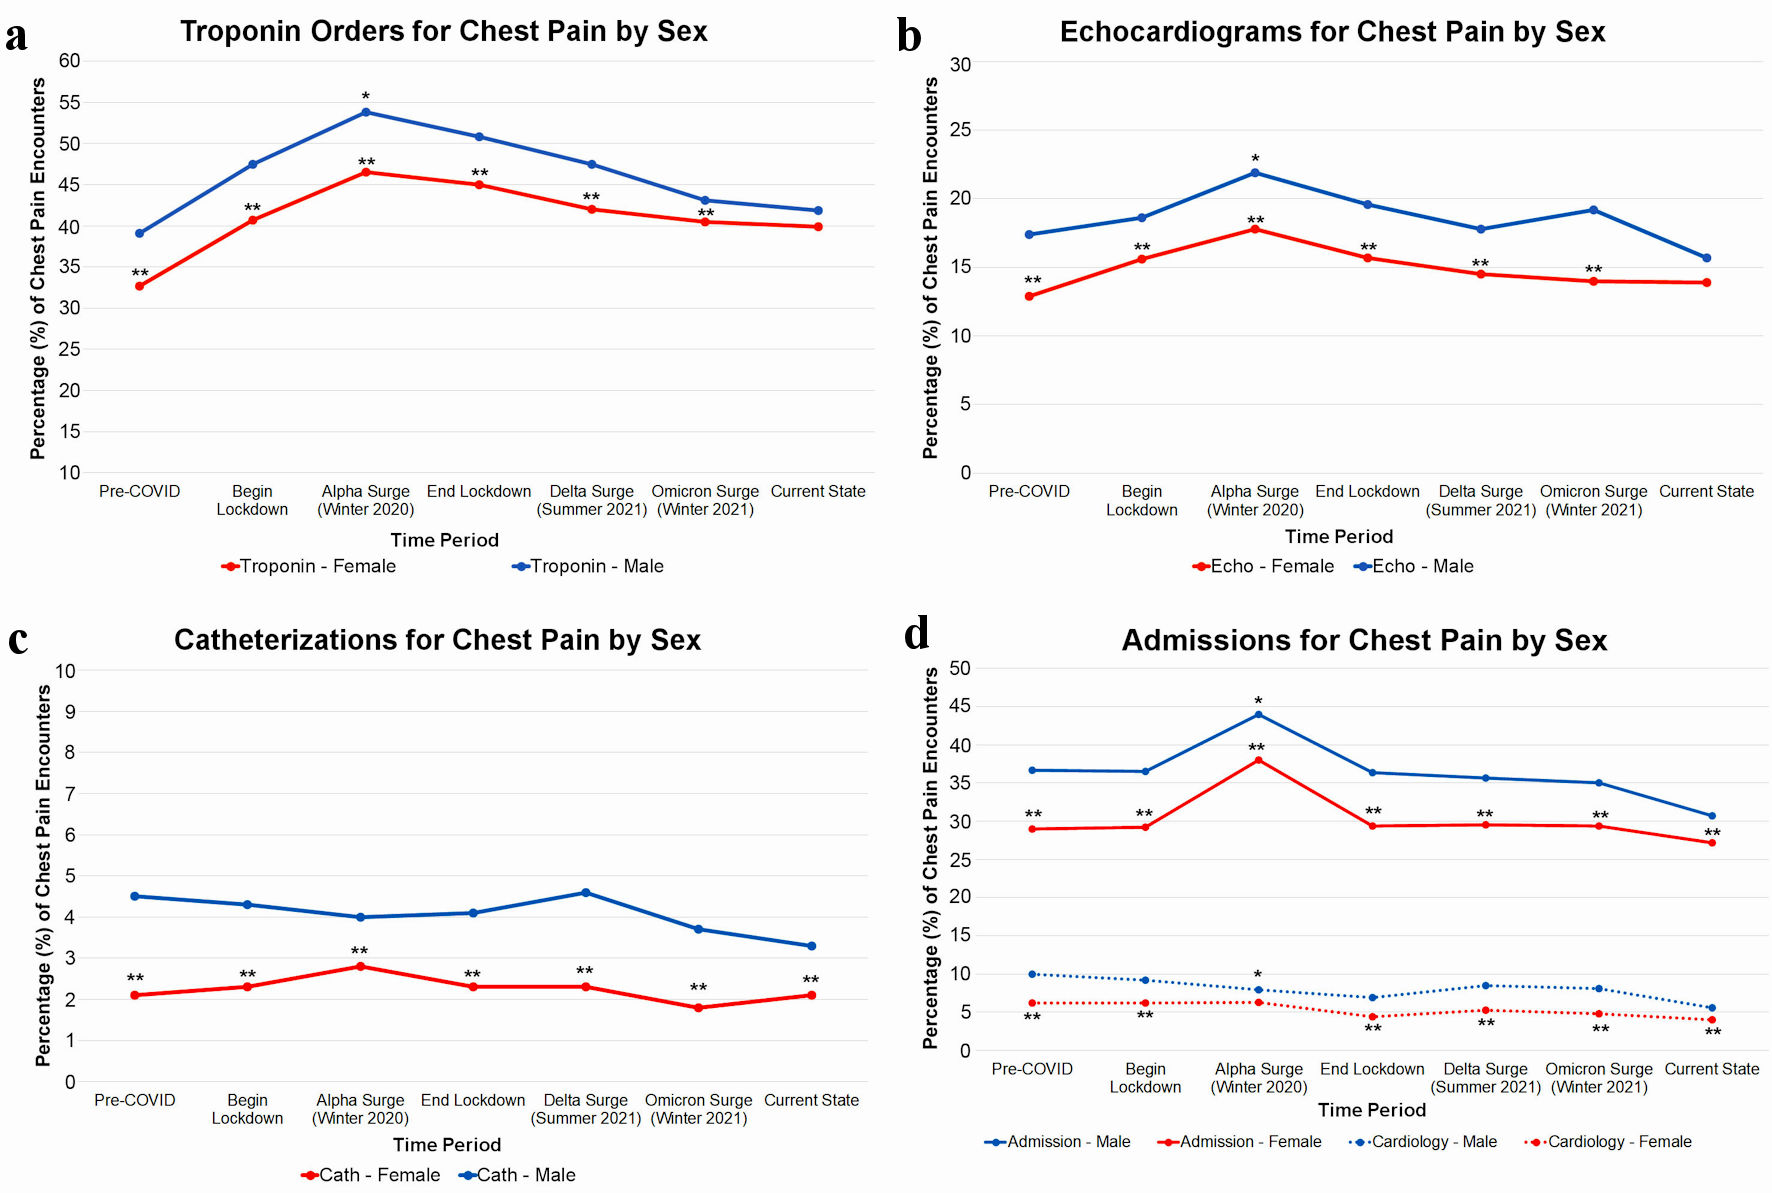
Figure 3. (a) Percentage of chest pain encounters where initial troponins were ordered. Females consistently received a lower percentage of troponin orders compared to males prior to COVID-19 (32.8% vs. 39.2%, mean difference (d) = 6.4%, confidence interval (CI): 5.7-7.2%, P < 0.001). Troponin orders increased for both sexes during the initial COVID-19 lockdown period (P < 0.001), however females continued to receive fewer troponin orders (42.8% vs. 49.4%, d = 6.6%, CI: 5.1-8.1%, P < 0.001). (b) Percentage of chest pain encounters where echocardiograms were obtained. Females received fewer echocardiogram orders compared to male before (12.9% vs. 17.4%, d = 4.5%, CI: 3.9-5.1%, P < 0.001) and during COVID-19 (17.8% vs. 21.9%, d = 4.1%, CI: 1.4-6.8%, P = 0.003). Echocardiogram orders significantly increased for both sexes during the COVID lockdown (P < 0.001). (c) Catheterizations for chest pain. Females had considerably lower proportion of coronary artery catheterizations compared to males before COVID-19 (2.1% vs. 4.5%, d = 2.4%, CI: 2.1-2.7%, P < 0.001). Catheterizations did not significantly change for males and females during the pandemic (P > 0.05). (d) Inpatient total admissions (solid line) and cardiology admissions (dotted line) for chest pain. Before COVID-19, females were less likely to be admitted than males (29% vs. 36.7%, d = 7.7%, CI: 7.0-8.4%, P < 0.001). This pattern continued during COVID-19 (31.5% vs. 39.4%, d = 7.0%; CI: 5.4-8.4%; P < 0.001). In terms of admission to a primary cardiology team, females were less likely than males before (6.2% vs. 10.1%, d = 3.9%, CI: 3.5-4.3%, P < 0.001) and during the pandemic (5.7% vs. 8.2%, d = 2.5%, CI: 1.8-3.3%, P < 0.001) to be admitted to cardiology. **Statistical significance between males and females. *Statistical significance between time periods. COVID-19: coronavirus disease 2019.
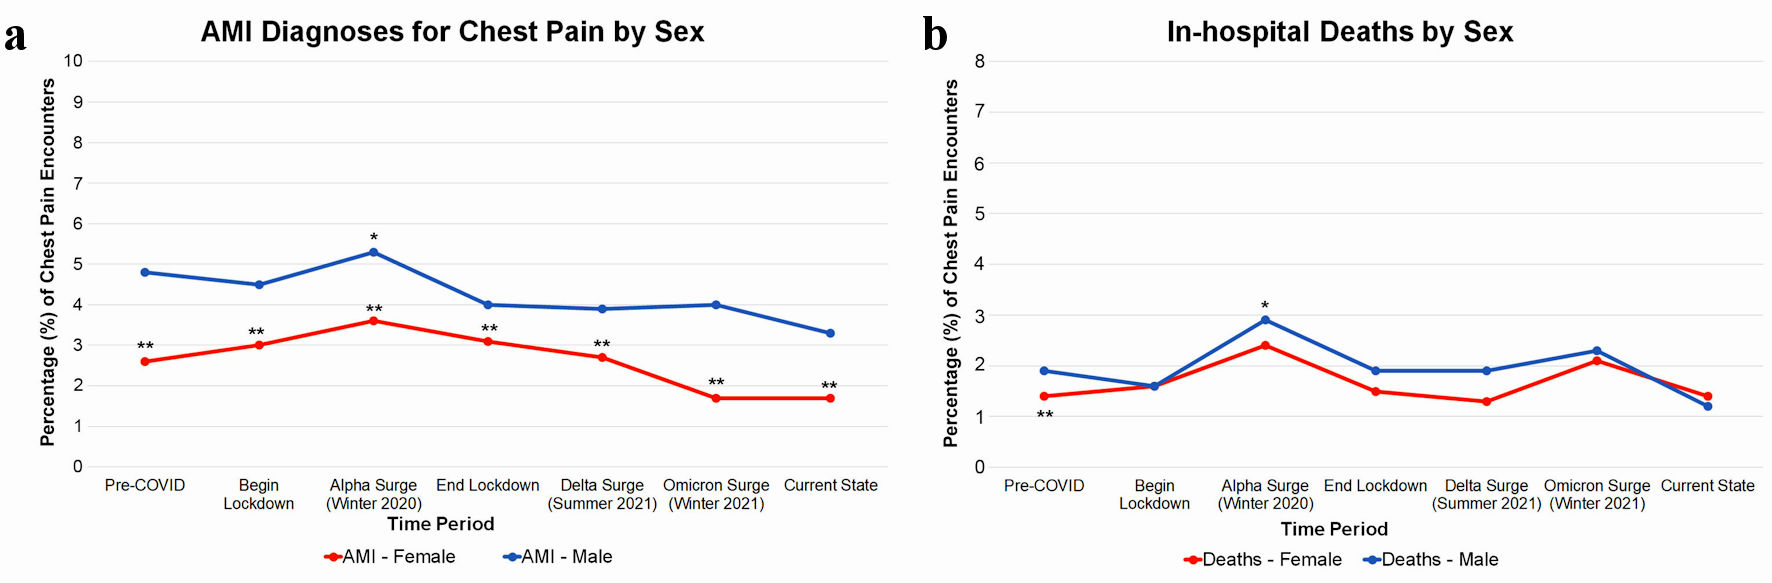
Figure 4. (a) Percentage of chest pain encounters where an AMI diagnosis was made. Prior to COVID-19, females were diagnosed in lower proportions than males with AMI (2.6% vs. 4.8%, mean difference (d) = 2.2%, confidence interval (CI): 1.9-2.5%, P < 0.001). AMI diagnosis had a small increase during the alpha surge compared to pre-COVID (3.6% vs. 2.6%, d = 1.0%, CI: 0.0-2.0%; P < 0.05). Females consistently had fewer AMI diagnosis than males (3.6% vs. 5.2%, d = 1.3%, CI: 0.7-1.9%, P < 0.001). (b) In-hospital deaths for chest pain. Prior to COVID-19, females had fewer hospital deaths than males who presented with chest pain (1.4% vs. 1.9%, d = 0.5%, CI: 0.3-0.7%, P < 0.001). During the COVID-19 winter 2020 surge, deaths from those who presented with chest pain slightly increased (males: 2.4% vs. 1.9%, d = 1.1%, CI: 0.3-1.9%, P < 0.001; females: 2.4% vs. 1.4%, d = 1.0%, CI: 0.2-1.9%, P < 0.01). There was no significant difference in percentage of deaths between males and females during this time (2.9% vs. 2.4%, P > 0.05). **Statistical significance between males and females. *Statistical significance between time periods. AMI: acute myocardial infarction; COVID-19: coronavirus disease 2019.
Table
Table 1. Demographics
| Pre-COVID-19 | Begin lockdown | Alpha surge | End lockdown | Delta surge | Omicron surge | Current state | Overall |
|---|
| Jan. 2016 - Mar. 2020 | Mar. 2020 - Nov. 2020 | Nov. 2020 - Jan. 2021 | Feb. 2021 - Jun. 2021 | Jun. 2021 - Dec. 2021 | Dec. 2021 - Feb. 2022 | Mar. 2022 - May 2022 |
|---|
| Jan.: January; Mar.: March; Nov.: November; Feb.: February; Jun.: June; Dec.: December; COVID-19: coronavirus disease 2019. |
| Total encounters | 62,523 | 8,154 | 3,370 | 4,850 | 8,312 | 4,213 | 4,342 | 95,764 |
| Sex | | | | | | | | |
| Male | 31,056 | 4,196 | 1,840 | 2,503 | 4,129 | 2,130 | 2,139 | 47,993 (50%) |
| Female | 31,471 | 3,956 | 1,529 | 2,346 | 4,179 | 2,080 | 2,193 | 47,754 (50%) |
| Age | | | | | | | | |
| 18 - 40 | 20,311 | 2,706 | 1,018 | 1,509 | 2,564 | 1,233 | 1,406 | 30,747 (32%) |
| 41 - 65 | 19,687 | 2,689 | 1,131 | 1,493 | 2,547 | 1,362 | 1,343 | 30,252 (32%) |
| > 65 | 22,525 | 2,759 | 1,221 | 1,848 | 3,201 | 1,618 | 1,593 | 34,765 (36%) |
| Race and ethnicity | | | | | | | | |
| Asian | 4,973 | 554 | 269 | 418 | 650 | 313 | 365 | 7,542 8%) |
| Black | 8,180 | 1,180 | 444 | 663 | 1,119 | 573 | 596 | 12,755 (13%) |
| Hispanic | 10,210 | 1,539 | 755 | 945 | 1,562 | 880 | 835 | 16,726 (17%) |
| Other | 8,480 | 1,308 | 522 | 756 | 1,501 | 754 | 970 | 14,291 (15%) |
| White | 30,685 | 3,573 | 1,380 | 2,068 | 3,480 | 1,693 | 1,576 | 44,455 (46%) |