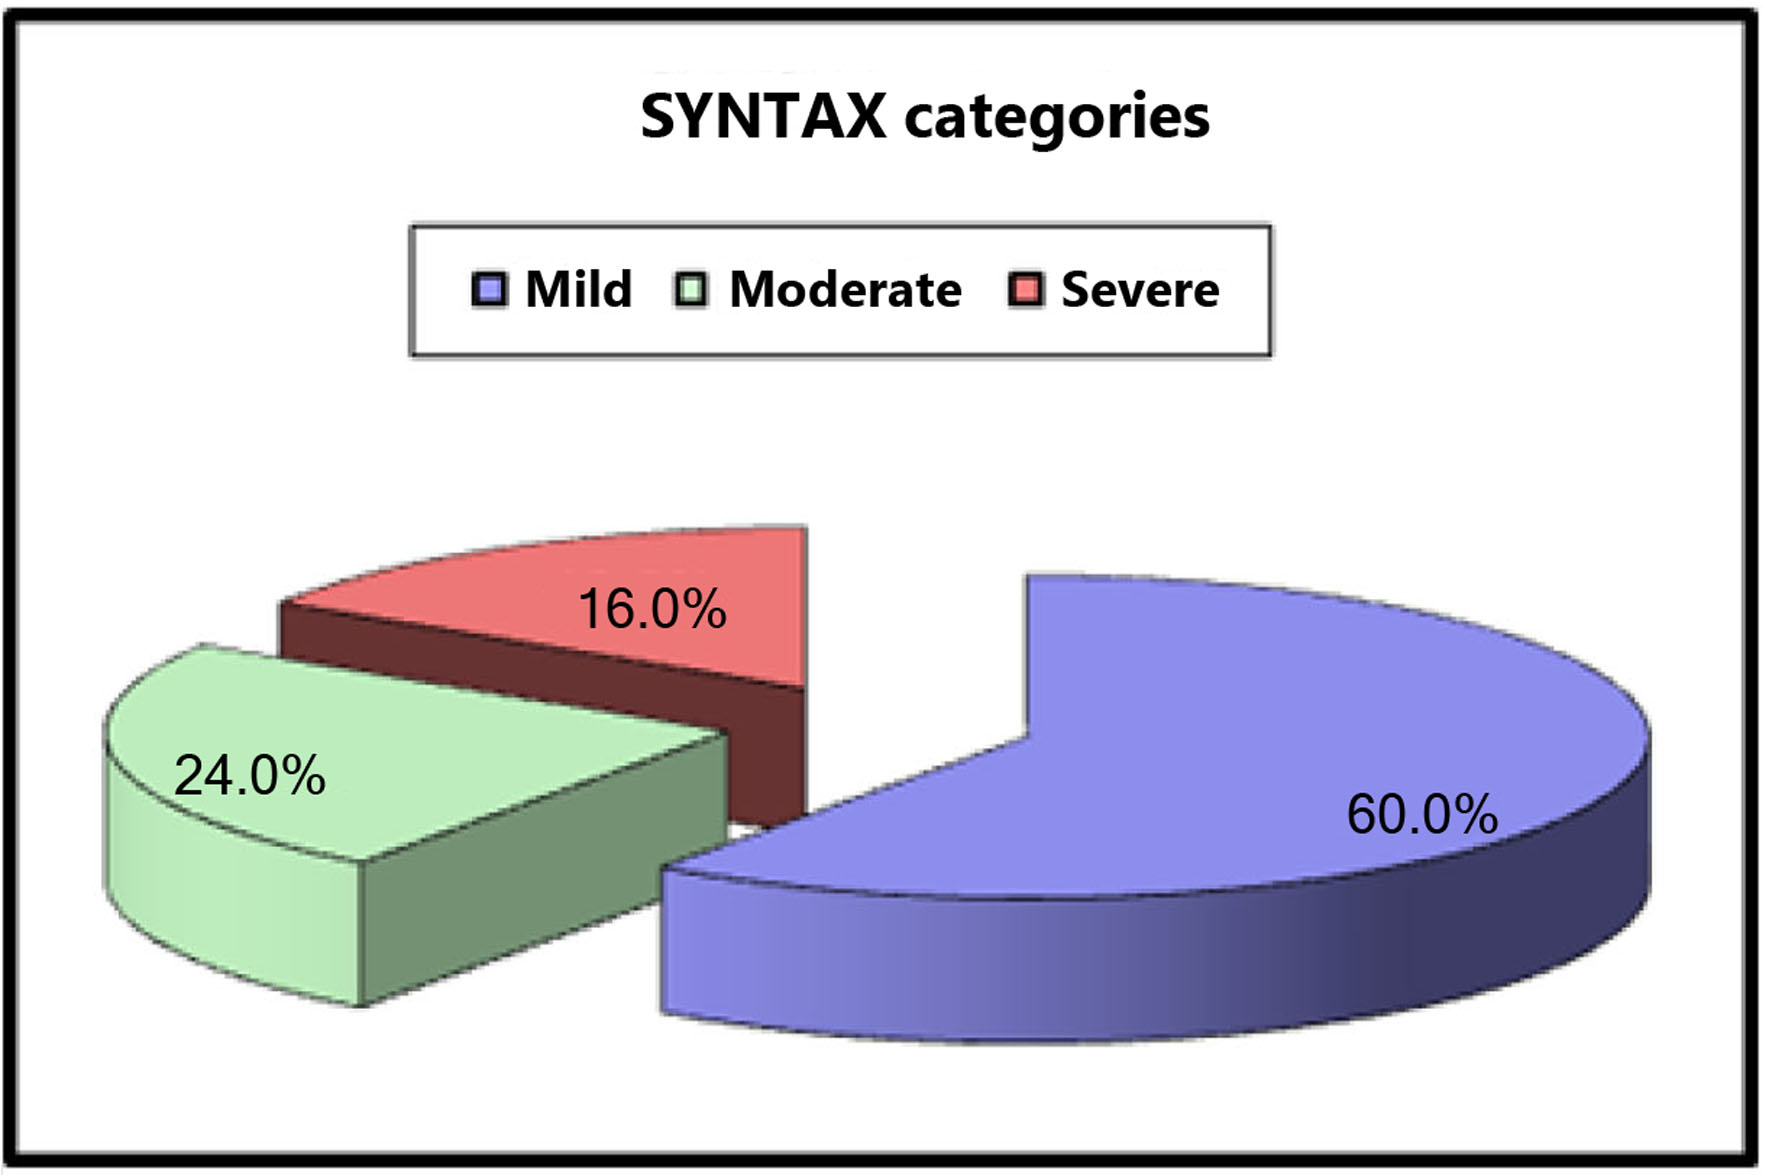
Figure 1. SYNTAX score categories.
| Cardiology Research, ISSN 1923-2829 print, 1923-2837 online, Open Access |
| Article copyright, the authors; Journal compilation copyright, Cardiol Res and Elmer Press Inc |
| Journal website https://www.cardiologyres.org |
Original Article
Volume 14, Number 1, February 2023, pages 54-62
The Complexity of Peripheral Arterial Disease and Coronary Artery Disease in Diabetic Patients: An Observational Study
Figures
Tables
| AAA: abdominal aortic aneurysm; CFA: common femoral artery; CIA: common iliac artery; EIA: external iliac artery; TASC II: Trans-Atlantic Inter-Society Consensus II. | |
| Type A lesions | Unilateral or bilateral stenoses of CIA Unilateral or bilateral single short (≤ 3 cm) stenosis of EIA |
| Type B lesions | Short (≤ 3 cm) stenosis of infrarenal aorta Unilateral CIA occlusion Single or multiple stenosis totaling 3 - 10 cm involving the EIA not extending into the CFA Unilateral EIA occlusion not involving the origins of internal iliac or CFA |
| Type C lesions | Bilateral CIA occlusions Bilateral EIA stenoses 3 - 10 cm long not extending into the CFA Unilateral EIA stenosis extending into the CFA Unilateral EIA occlusion that involves the origins of internal iliac and/or CFA Heavily calcified unilateral EIA occlusion with or without involvement of origins of internal iliac and/or CFA |
| Type D lesions | Infra-renal aortoiliac occlusion Diffuse disease involving the aorta and both iliac arteries requiring treatment Diffuse multiple stenoses involving the unilateral CIA, EIA and CFA Unilateral occlusions of both CIA and EIA Bilateral occlusions of EIA Iliac stenoses in patients with AAA requiring treatment and not amenable to endograft placement or other lesions requiring open aortic or iliac surgery |
| CFA: common femoral artery; SFA: superficial femoral artery; TASC II: Trans-Atlantic Inter-Society Consensus II. | |
| Type A lesions | Single stenosis ≤ 10 cm in length Single occlusion ≤ 5 cm in length |
| Type B lesions | Multiple lesions (stenoses or occlusions), each ≤ 5 cm Single stenosis or occlusion ≤ 15 cm not involving the infra geniculate popliteal artery Single or multiple lesions in the absence of continuous tibial vessels to improve inflow for a distal bypass Heavily calcified occlusion ≤ 5 cm in length Single popliteal stenosis |
| Type C lesions | Multiple stenoses or occlusions totaling > 15 cm with or without heavy calcification Recurrent stenoses or occlusions that need treatment after two endovascular interventions |
| Type D lesions | Chronic total occlusions of CFA or SFA (> 20 cm, involving the popliteal artery) Chronic total occlusion of popliteal artery and proximal trifurcation vessels |
| Continuous variables are represented as mean ± SD, and categorical variables as percentages. ABI: ankle brachial index; FH: family history; HbA1c: hemoglobin A1c; HTN: hypertension; LDL: low-density lipoprotein; LVEF: left ventricular ejection fraction; PAD: peripheral arterial disease; SD: standard deviation. | |
| Males | 40 (80%) |
| Age (years) | 62.12 ± 5.71 |
| Smoking | 40 (80%) |
| HTN | 42 (84%) |
| Dyslipidemia | 50 (100%) |
| FH | 9 (18%) |
| Creatinine (mg/dL) | 1.03 ± 0.07 0.9 - 1.2 |
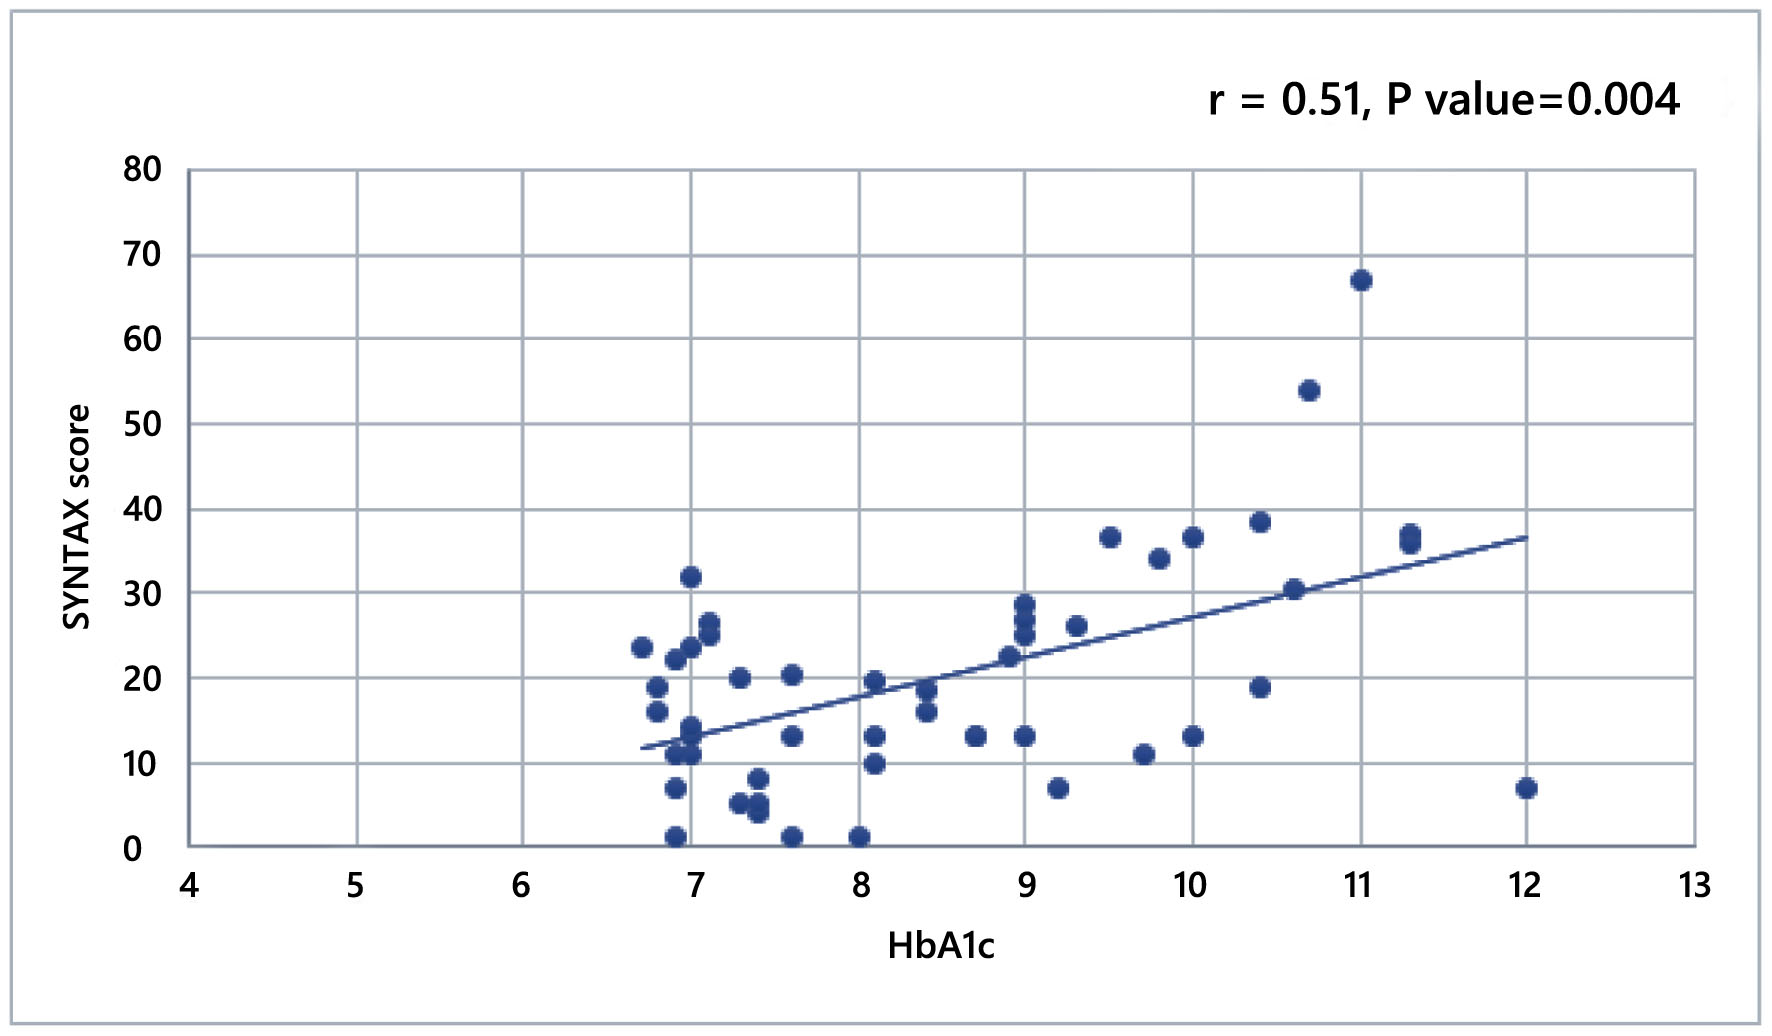
| HbA1c (%) | 8.47 ± 1.47 6.7 - 12 |
| LDL (mg/dL) | 157 ± 15 135 - 200 |
| LVEF (%) | 53.6 ± 5.2 40 - 64 |
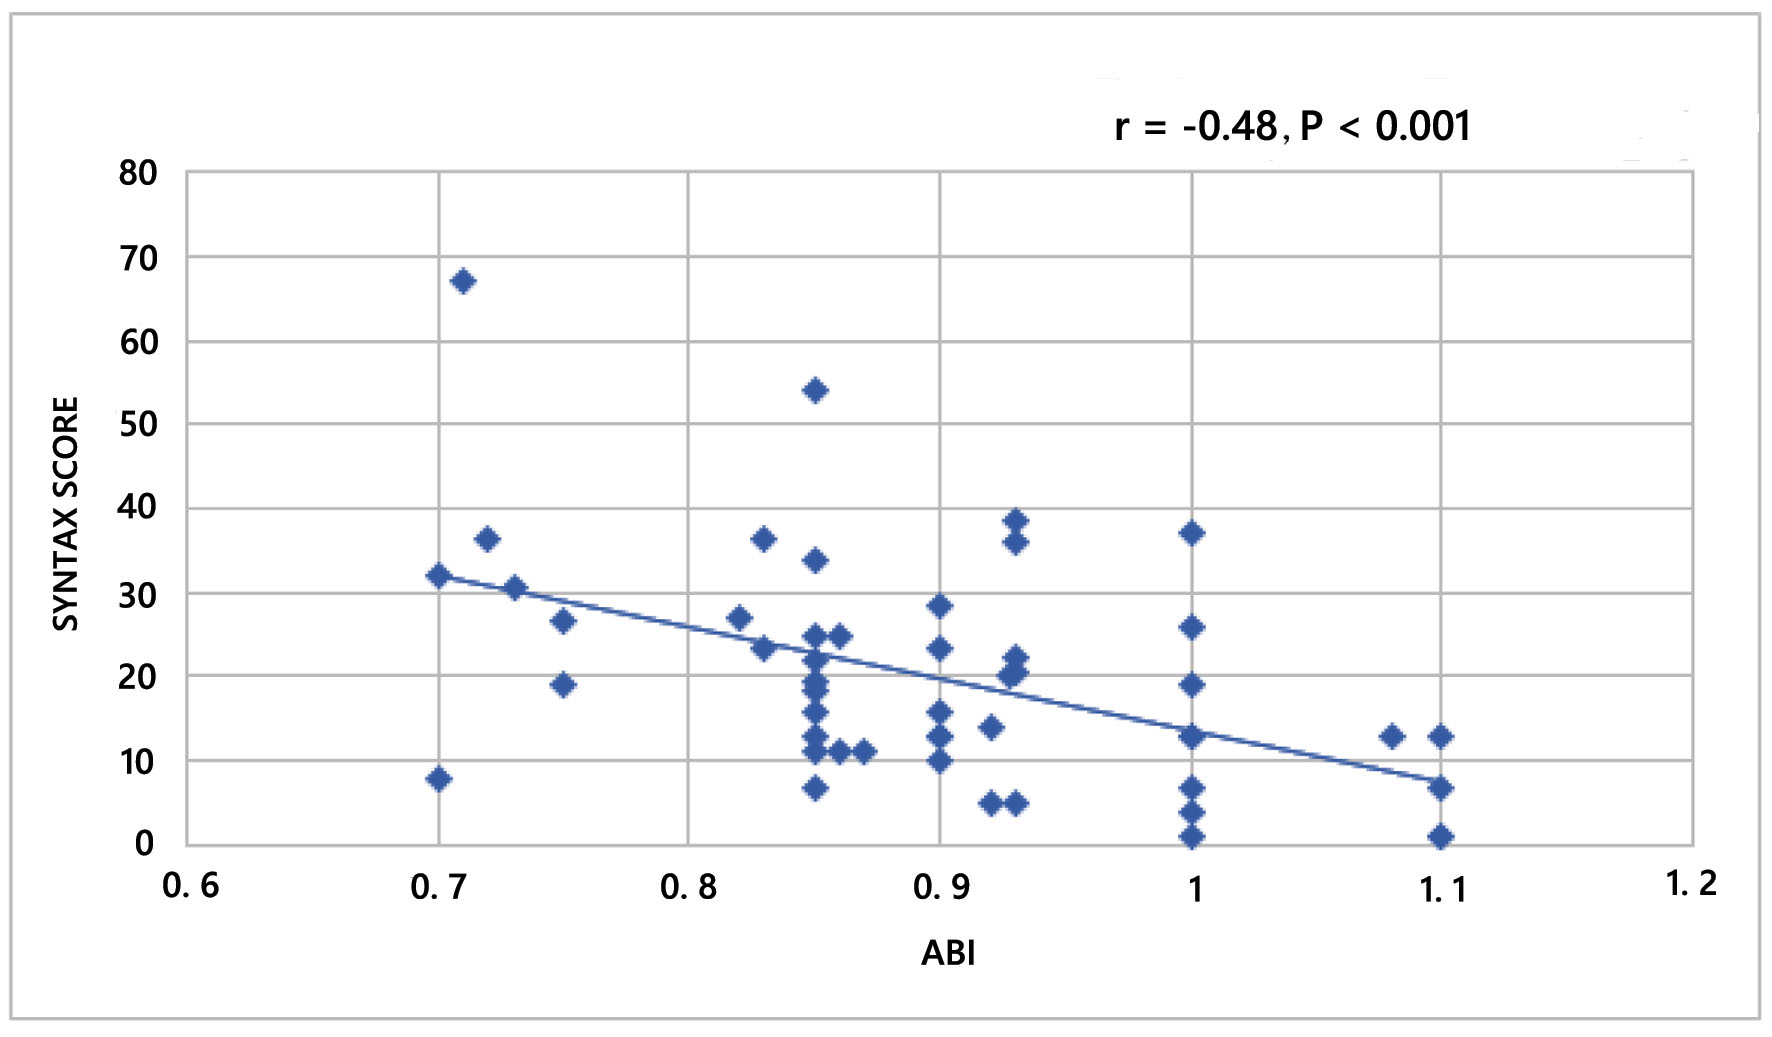
| ABI | 0.8 ± 0.1 0.7 - 1.1 |
| Symptoms for PAD | 3 (6%) |
| SYNTAX | TASC II class | P value | ||||
|---|---|---|---|---|---|---|
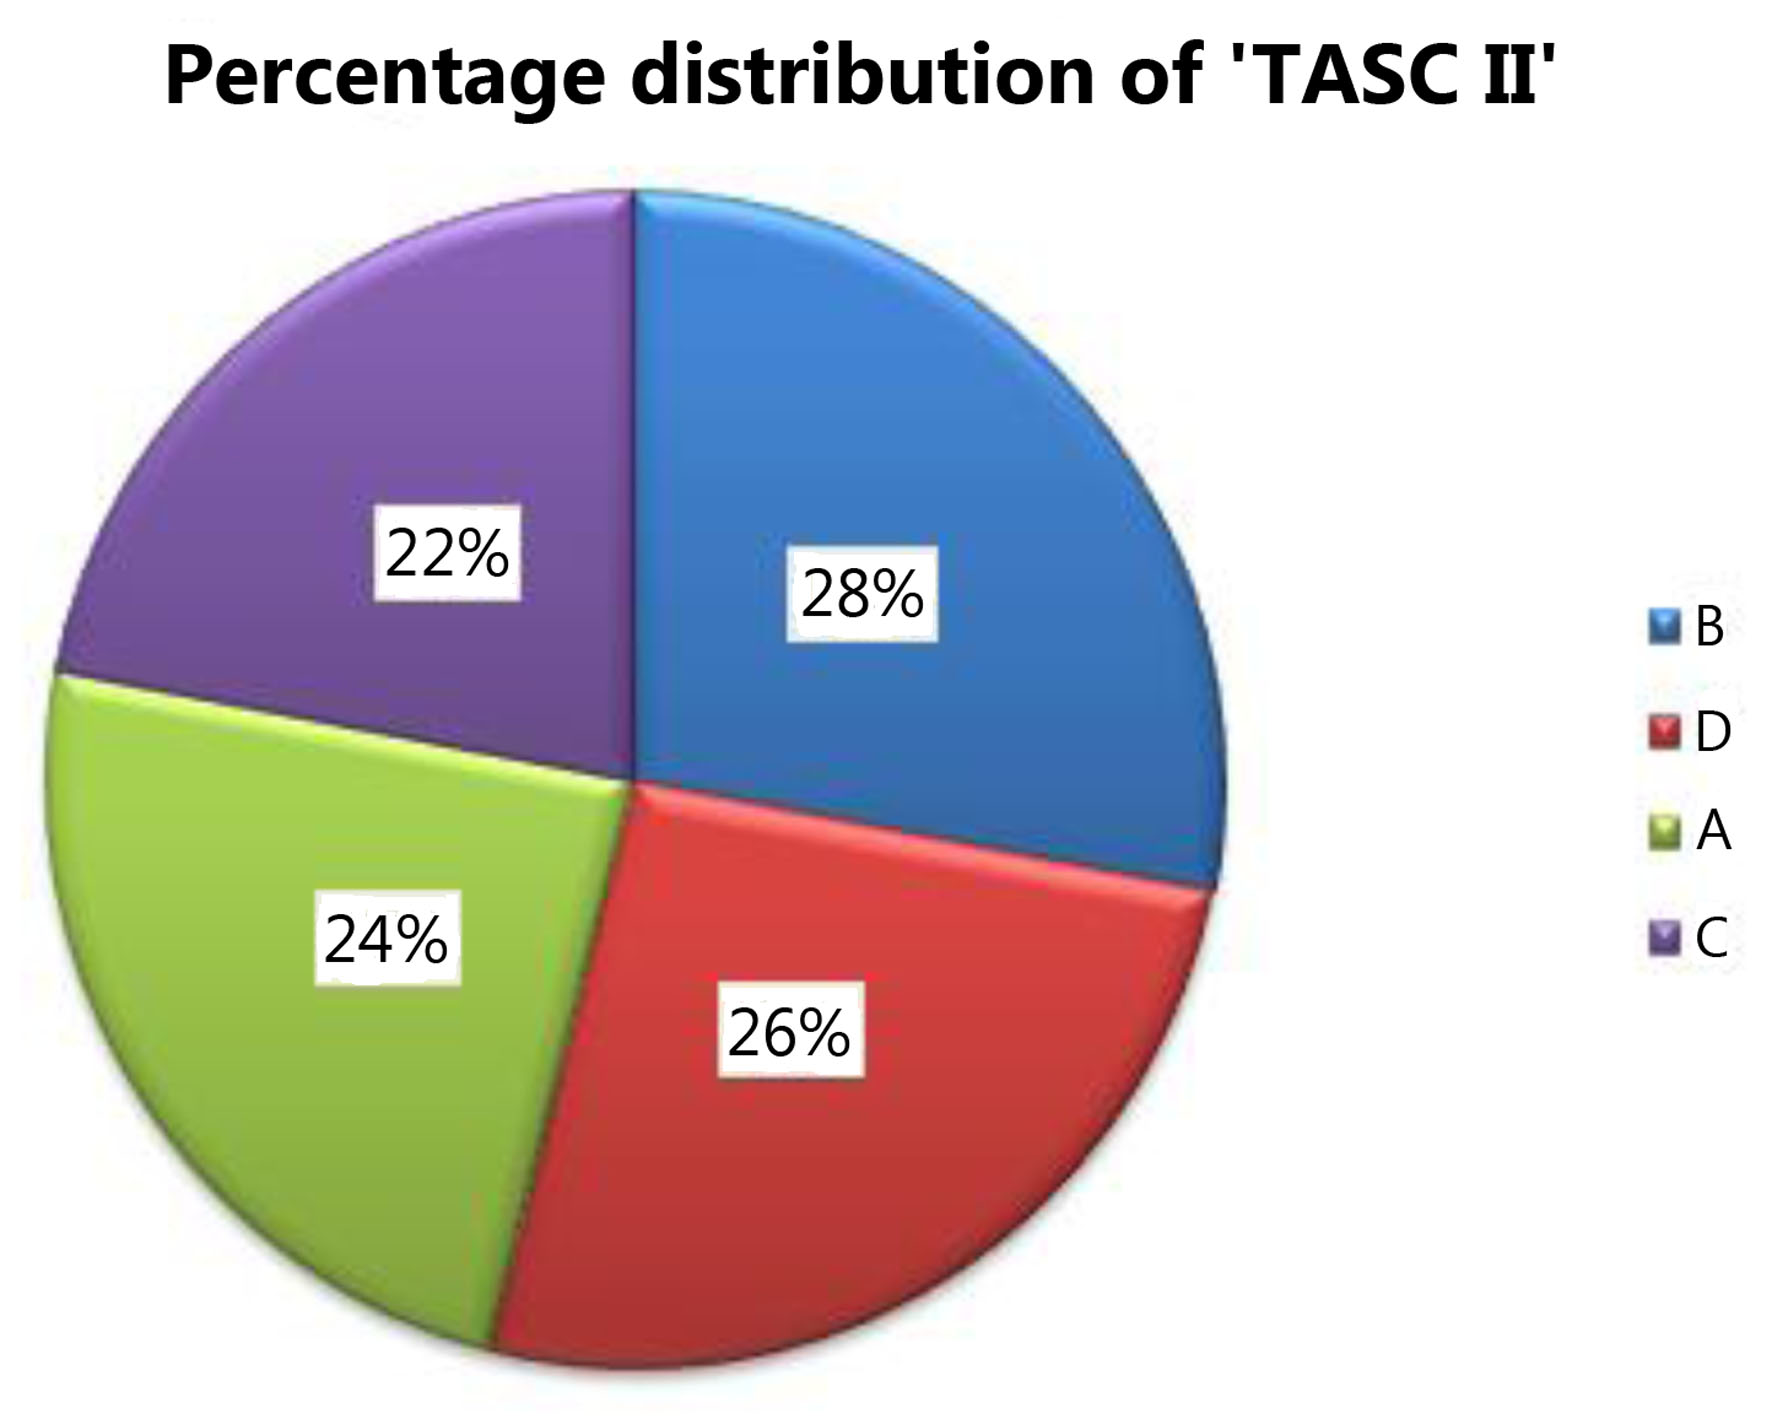
| A (N = 12) | B (N = 14) | C (N = 11) | D (N = 13) | |||
| IQR: interquartile range; TASC II: Trans-Atlantic Inter-Society Consensus II. | ||||||
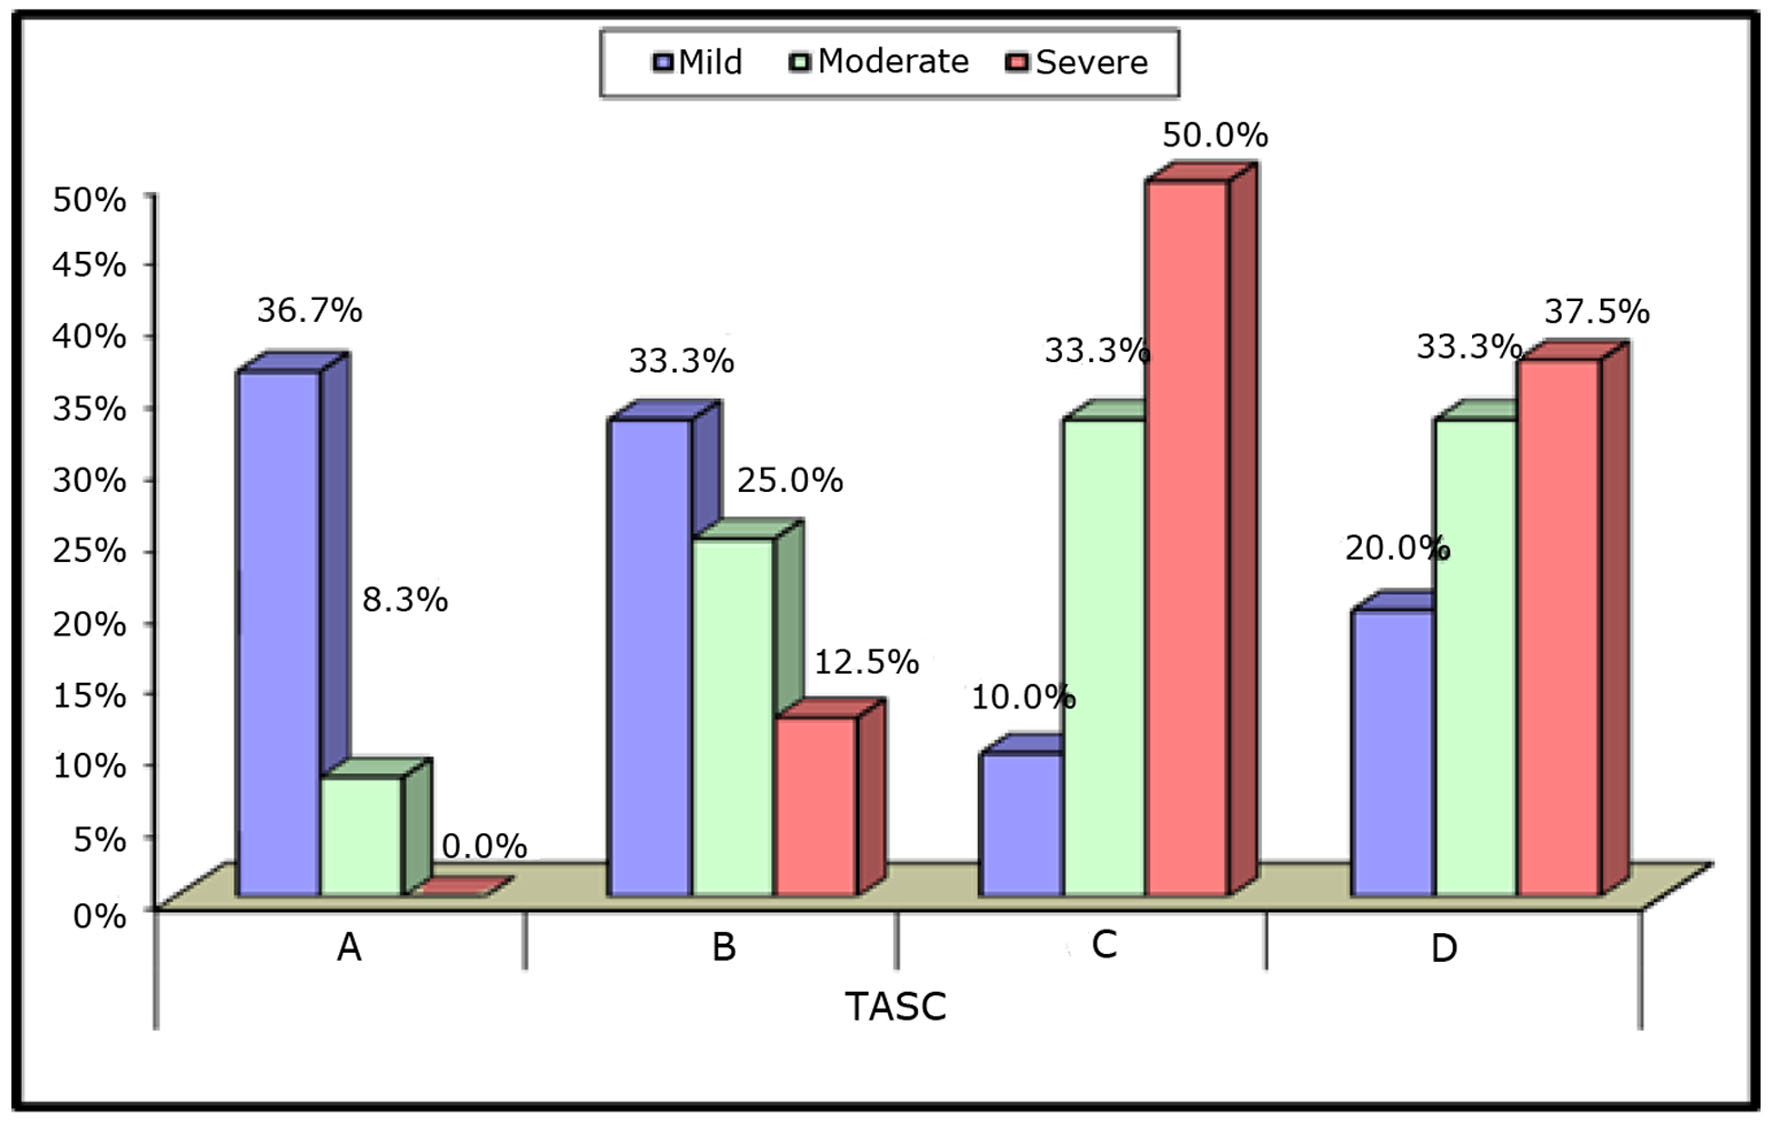
| SYNTAX groups | 0.046 | |||||
| Mild | 11(91.7%) | 10 (71.4%) | 3 (27.3%) | 6 (46.2%) | ||
| Moderate | 1 (8.3%) | 3 (21.4%) | 4 (36.4%) | 4 (30.8%) | ||
| Severe | 0 (0.0%) | 1 (7.1%) | 4 (36.4%) | 3 (23.1%) | ||
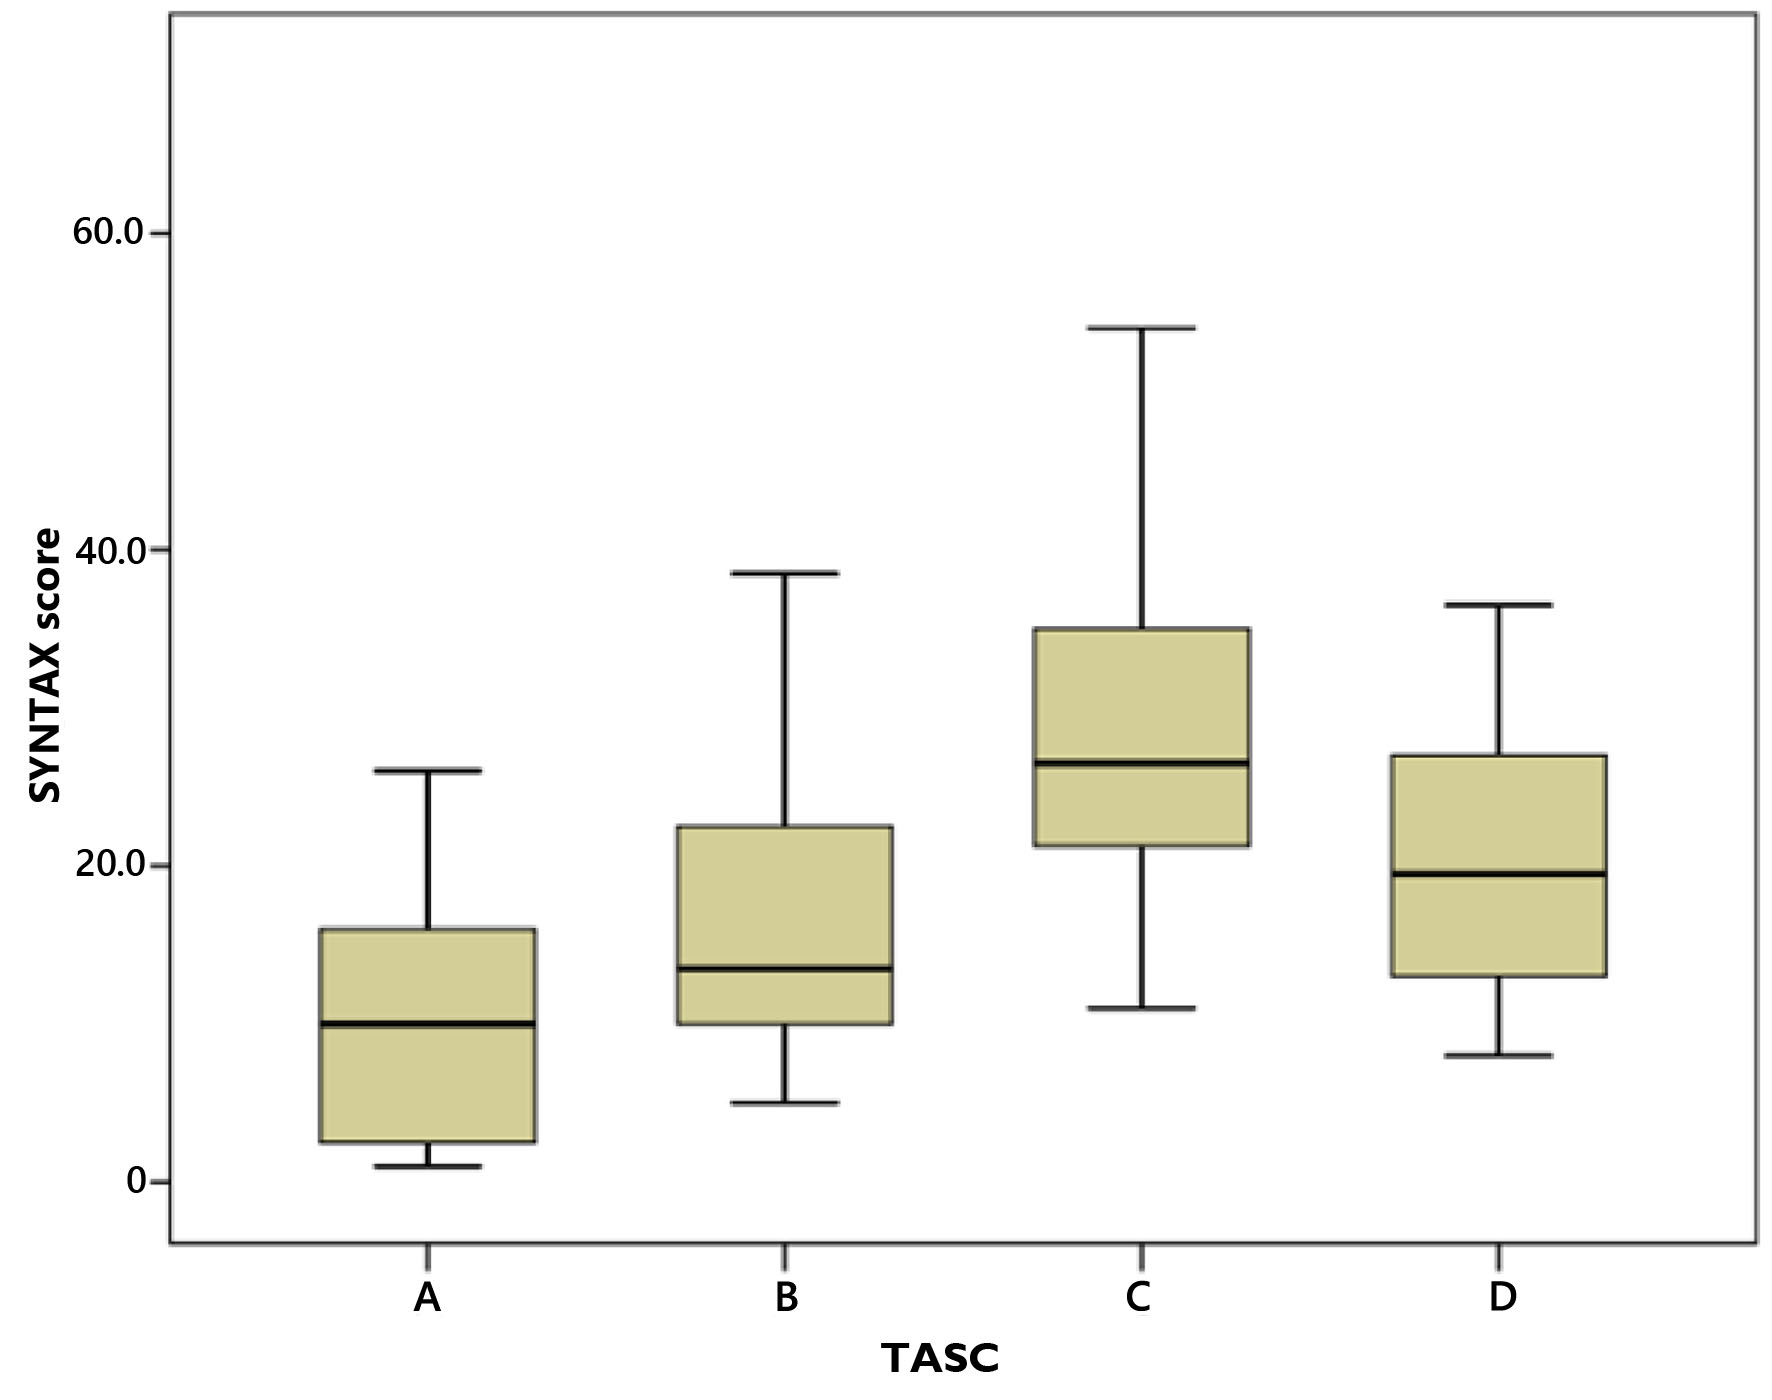
| SYNTAX score | 0.008 | |||||
| Median (IQR) | 10.00 (2.5 - 16) | 13.50 (10 - 22.5) | 26.50 (19 - 36) | 19.50 (13 - 27) | ||
| Range | 1 - 37 | 5 - 38.5 | 11 - 54 | 8 - 67 | ||
| Post hoc analysis | A vs. B | A vs. C | A vs. D | B vs. C | B vs. D | C vs. D |
| SYNTAX groups | 0.38 | 0.006 | 0.044 | 0.066 | 0.348 | 0.612 |
| SYNTAX score | 0.31 | 0.002 | 0.02 | 0.022 | 0.149 | 0.343 |
| ABI | TASC II | P-value | ||||
|---|---|---|---|---|---|---|
| A (N = 12) | B (N = 14) | C (N = 11) | D (N = 13) | |||
| ABI: ankle brachial index; SD: standard deviation; TASC II: Trans-Atlantic Inter-Society Consensus II. | ||||||
| ABI score | 0.001 | |||||
| Mean ± SD | 1.03 ± 0.05 | 0.92 ± 0.05 | 0.83 ± 0.06 | 0.81 ± 0.07 | ||
| Range | 1 - 1.1 | 0.85 - 1.08 | 0.73 - 0.93 | 0.7 - 0.87 | ||
| ABI groups | 0.001 | |||||
| Normal | 12 (100.0%) | 1 (7.1%) | 0 (0.0%) | 0 (0.0%) | ||
| Borderline | 0 (0.0%) | 7 (50.0%) | 1 (9.1%) | 0 (0.0%) | ||
| Low | 0 (0.0%) | 6 (42.9%) | 10 (90.9%) | 13 (100.0%) | ||
| Post hoc analysis | A vs. B | A vs. C | A vs. D | B vs. C | B vs. D | C vs. D |
| ABI score | 0.001 | 0.001 | 0.001 | 0.001 | 0.001 | 0.291 |
| ABI groups | 0.001 | 0.001 | 0.001 | 0.044 | 0.018 | 0.573 |