Cardiology Research, ISSN 1923-2829 print, 1923-2837 online, Open Access
Article copyright, the authors; Journal compilation copyright, Cardiol Res and Elmer Press Inc
Journal website https://www.cardiologyres.org

Short Communication

Volume 14, Number 1, February 2023, pages 69-78


The Effects of Percutaneous Coronary Intervention on Biomarkers and Quality of Life in Patients With Chronic Total Coronary Artery Obstruction

Figures

Figure 1.
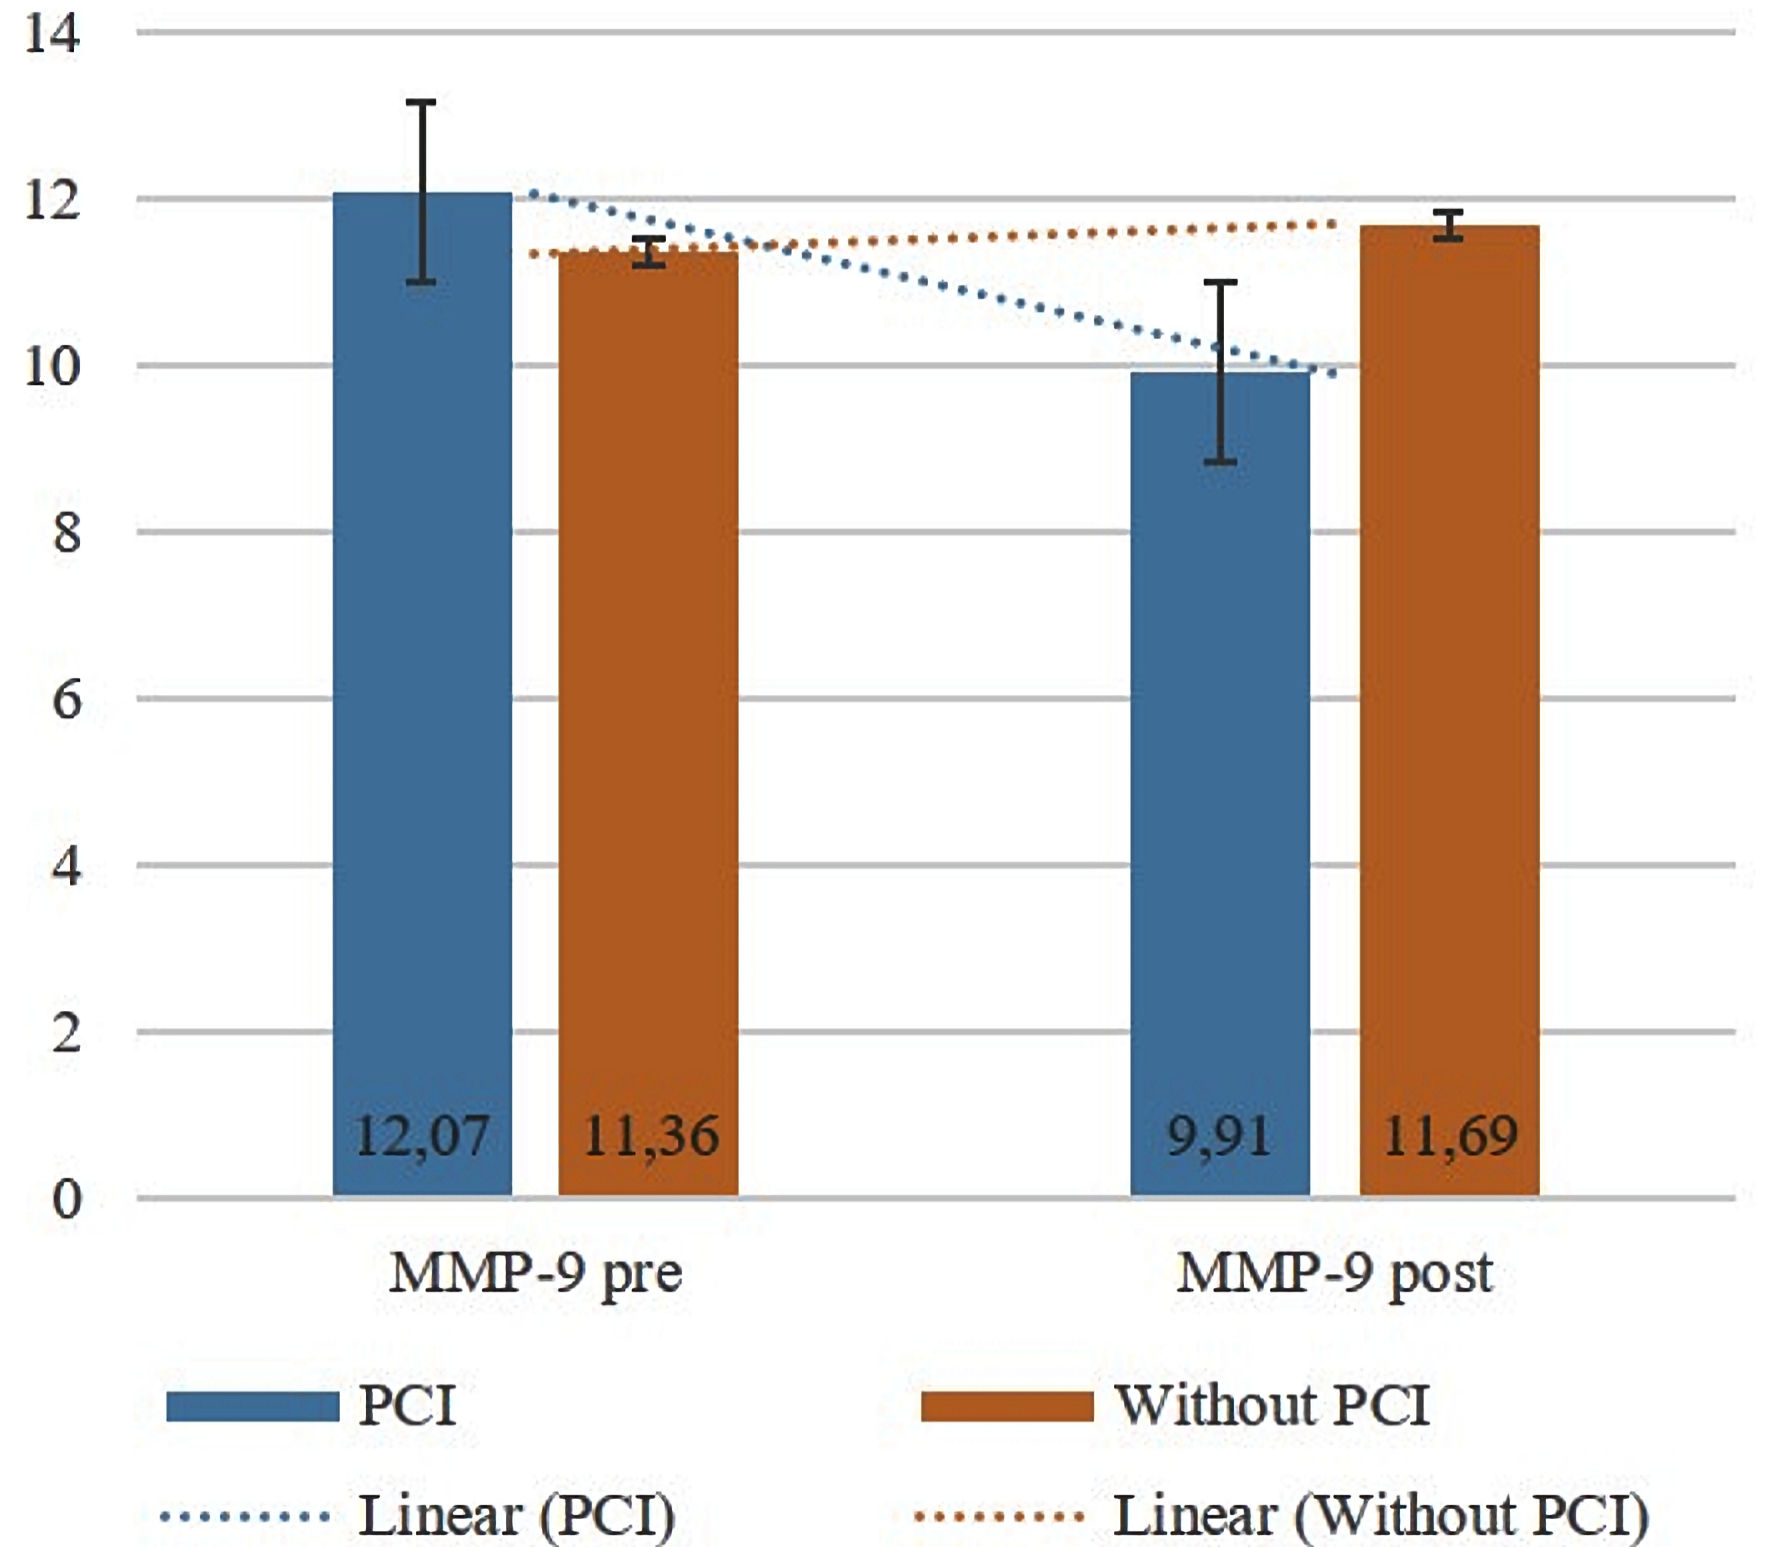
Figure 1. Comparison of MMP-9 levels at baseline and 8 weeks later (pre-/post-test) between the PCI and without PCI groups. Bars show the mean, and the black lines show the standard deviation. PCI: percutaneous coronary intervention; MMP-9: matrix metalloproteinase-9.
Figure 2.
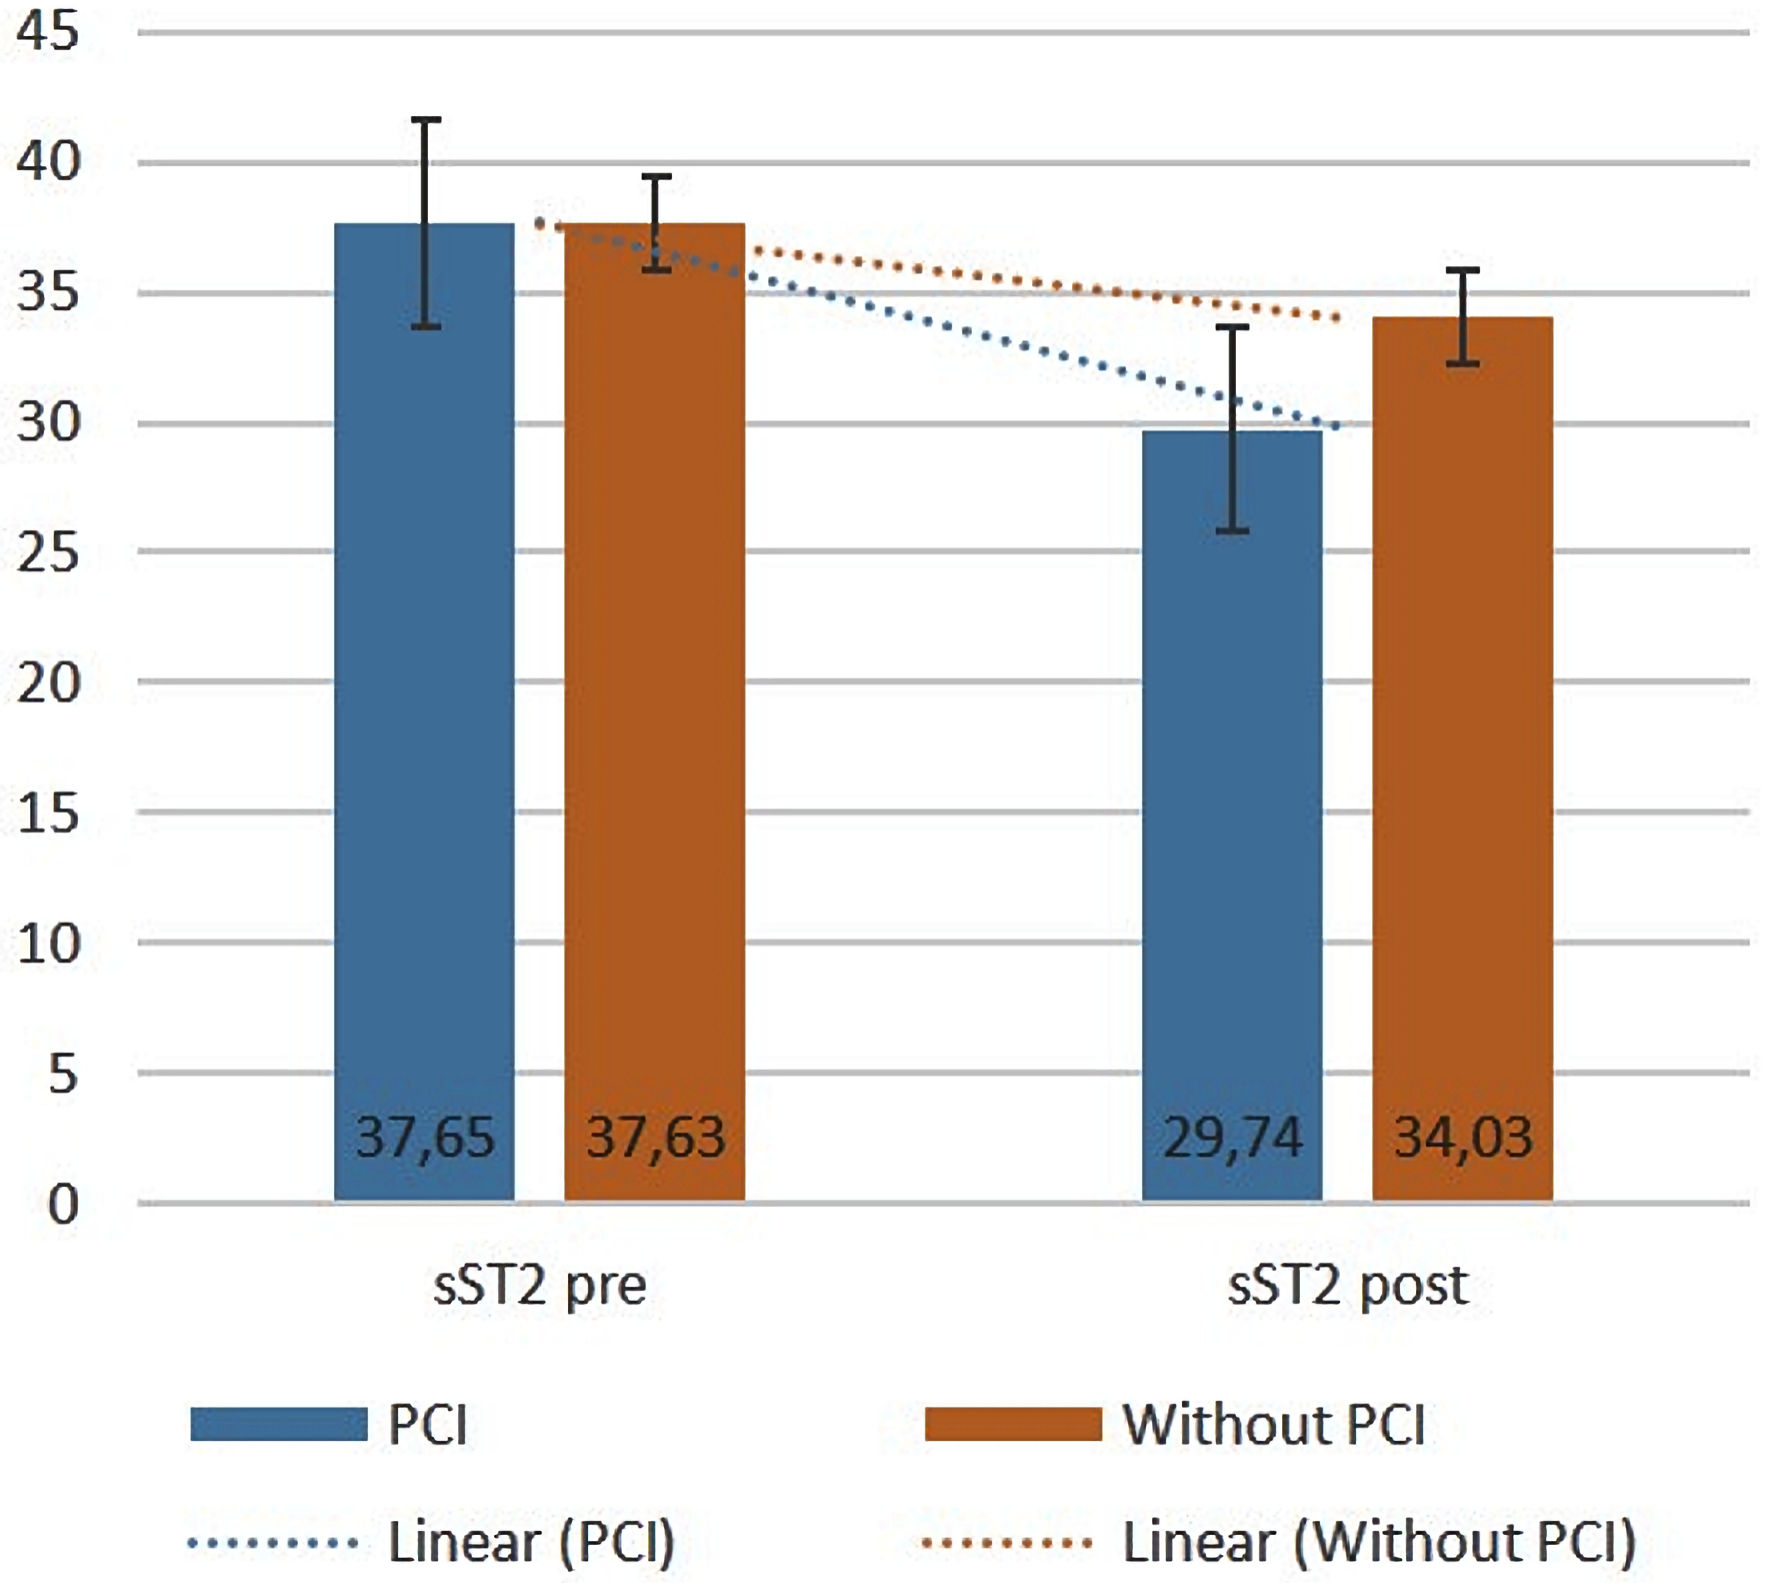
Figure 2. Comparison of sST2 levels at baseline and 8 weeks later (pre-/post-test) between the PCI and without PCI groups. Bars show the mean, and the black lines show the standard deviation. PCI: percutaneous coronary intervention; sST2: soluble suppression tumorigenicity 2.
Figure 3.
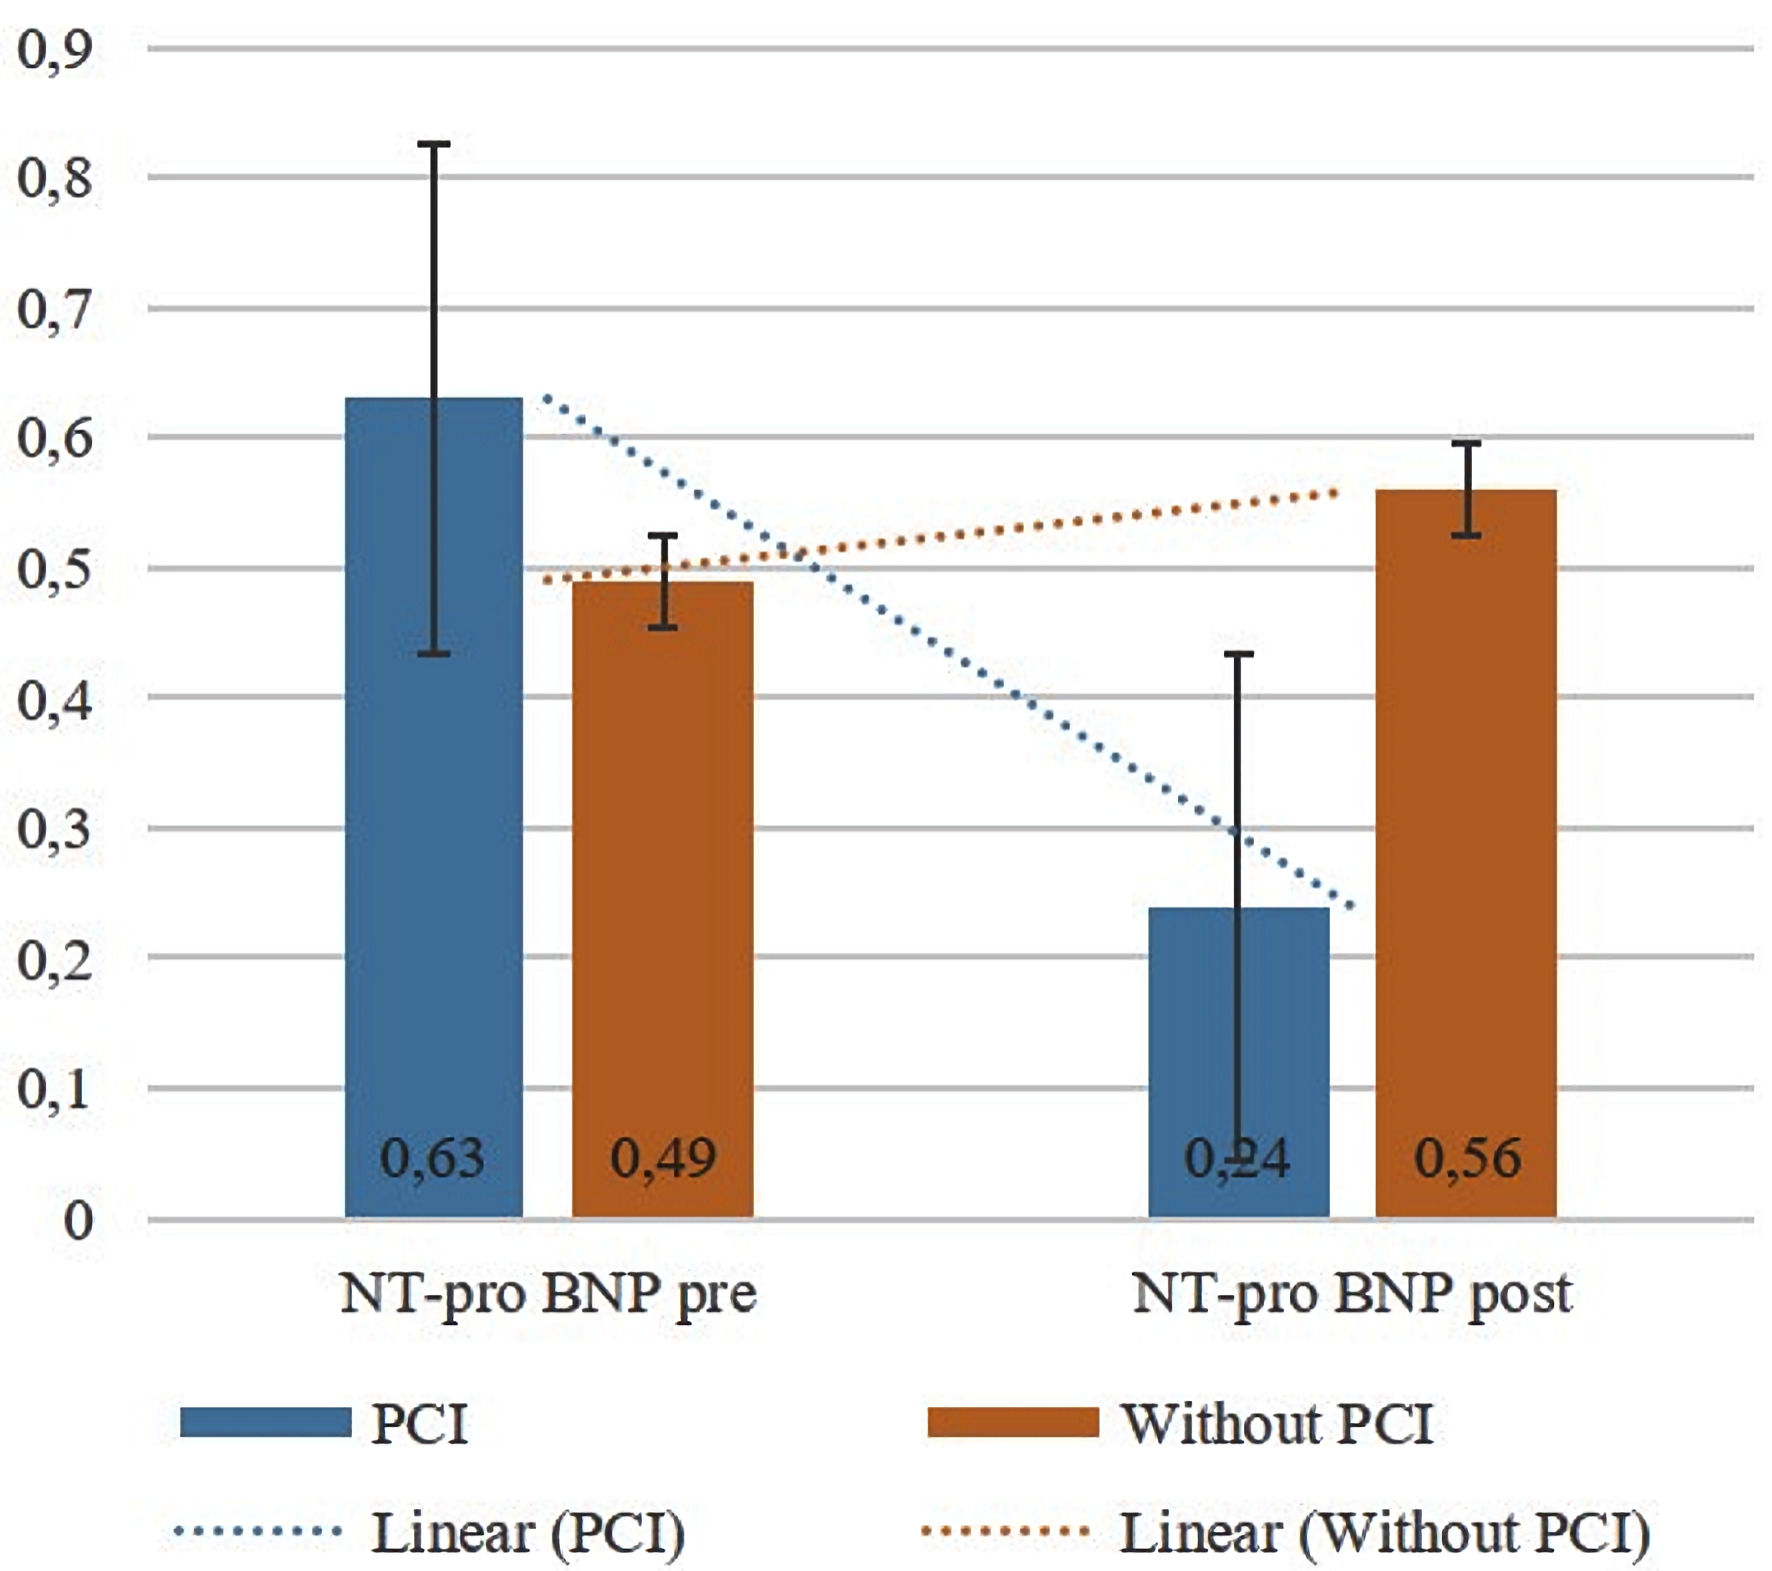
Figure 3. Comparison of NT-pro-BNP levels at baseline and 8 weeks later (pre-/post-test) between the PCI and without PCI groups. Bars show the mean, and the black lines show the standard deviation. PCI: percutaneous coronary intervention; NT-pro-BNP: N-terminal pro-B-type natriuretic peptide.

Tables

Table 1. Baseline Characteristics of the Subject
 
CharacteristicsPCI (n = 20)Without PCI (n = 20)P value
*Significance level of P < 0.05. CTO: chronic total obstruction; CCB: calcium channel blockers; ACE-I: ACE-inhibitors; ARBs: angiotensin receptors blocker; COX: cyclooxygenase; LAD: left anterior descending artery; RCA: right coronary artery; LCx: left circumflex; ACE: angiotensin-converting enzyme; PCI: percutaneous coronary intervention.
Age (years) (mean ± SD)56.70 ± 2.2059.70 ± 1.730.284
Gender (n, %)
  Male17 (47.2%)19 (52.8%)0.292
  Female3 (75%)1 (25%)
Weight (kg) (mean ± SD)62.70 ± 1.0764.95 ± 1.490.230
Height (cm) (mean ± SD)159.55 ± 0.93158.75 ± 0.970.555
Body mass index (n, %)
  Normal11 (61.6%)7 (38.9%)0.314
  Overweight9 (42.9%)12 (57.1%)
  Obesity0 (0.0%)1 (100%)
CTO blood vessel (n, %)
  LAD15 (68.2%)7 (31.8%)0.028*
  LCx0 (0.0%)2 (100%)
  RCA5 (31.3%)11 (68.8%)
  LVEF (%) (mean ± SD)57.40 ± 1.4559.89 ± 1.400.243
Comorbidity
  Hypertension16 (47.1%)18 (52.9%)0.376
  Dyslipidemia3 (37.5%)5 (62.5%)0.429
  Type 2 DM3 (37.5%)5 (67.5%)0.429
Therapy
  COX-1 inhibitor20 (50%)20 (50%)-
  ADP receptor antagonist20 (50%)20 (50%)-
  ACE-I9 (42.9%)12 (57.1%)0.342
  ARBs11 (55%)9 (45%)0.527
  Beta-blocker20 (50%)20 (50%)-
  Statin20 (50%)20 (50%)
  Nitrate13 (44.8%)16 (55.2%)0.288
  CCB3 (33.3%)6 (66.7%)0.256
  Trimetazidine3 (60%)2 (40%)0.633


Table 2. Blood Laboratory Test
 
ParameterPCI (n = 20)Without PCI (n = 20)P
Hb: hemoglobin; HDL-C: high-density lipoprotein cholesterol; LDL-C: low-density lipoprotein cholesterol; PCI: percutaneous coronary intervention.
Hb (g/dL)13.91 ± 0.2713.94 ± 0.280.942
Total cholesterol (g/dL)161.90 ± 6.29166.5 ± 9.650.692
HDL-C (g/dL)38.60 ± 2.3439.15 ± 1.900.856
LDL-C (g/dL)101.45 ± 6.26110.45 ± 7.210.352
Triglyceride159.30 ± 17.13143.65 ± 14.790.494
Urea (mg/dL)15.31 ± 1.8913.08 ± 1.230.329
Creatinine (mg/dL)1.66 ± 0.591.02 ± 0.060.297


Table 3. Baseline Level of Serum MMP-9, sST2, and NT-pro-BNP in PCI and Without PCI Groups
 
Biomarker levelPCIWithout PCIMean difference95% CIP value
MMP-9: matrix metalloproteinase-9; sST-2: soluble suppression of tumorigenesis-2; NT-pro-BNP: N-terminal pro-B-type natriuretic peptide; PCI: percutaneous coronary intervention; CI: confidence interval.
MMP-9 (ng/mL)12.07 ± 1.2711.36 ± 1.511.11-2.3 - 5.730.394
sST2 (ng/mL)37.65 ± 20.0037.63 ± 15.390.02-11.39 - 11.450.996
NT-pro-BNP (ng/mL)0.63 ± 0.230.49 ± 1.930.14-0.2 - 0.310.099


Table 4. Serum MMP-9, sST2, and NT-pro-BNP Levels in PCI and Without PCI Groups 8 Weeks Later
 
Biomarker levelPCIWithout PCIMean difference95% CIP value
*Significant (P < 0.05). MMP-9: matrix metalloproteinase-9; sST-2: soluble suppression of tumorigenesis-2; NT-pro-BNP: N-terminal pro-B-type natriuretic peptide; PCI: percutaneous coronary intervention; CI: confidence interval.
MMP-9 (ng/mL)9.91 ± 5.1911.69 ± 6.512.781.01 - 5.980.045*
sST2 (ng/mL)29.74 ± 15.1734.03 ± 20.245.651.75 - 7.150.045*
NT-pro-BNP (ng/mL)0.24 ± 0.100.56 ± 0.230.310.20 - 0.4< 0.001*


Table 5. Comparison of Physical Activity Limitation, Angina Severity, Therapy Satisfaction, and Quality of Life Between the PCI and Without PCI Groups at Baseline and After 8 Weeks
 
VariablePCIWithout PCIMean difference95% CIP value
*Significance level of P < 0.05. PCI: percutaneous coronary intervention; CI: confidence interval.
Week 0
  Physical activity limitation69.95 ± 8.3066.05 ± 8.243.9-0.061
  Angina severity50.00 ± 3.5350.85 ± 4.120.85-0.529
  Therapy satisfaction52.80 ± 4.1250.75 ± 4.712.050.78 - 4.880.151
  Quality of life49.85 ± 9.1948.15 ± 7.011.70-0.663
Week 8
  Physical activity limitation68.81 ± 8.1464.10 ± 8.123.72-0.063
  Angina severity52.85 ± 4.1256.1 ± 3.753.25-0.039*
  Therapy satisfaction53.30 ± 3.9751.35 ± 4.791.950.86 - 4.760.169
  Quality of life50.80 ± 9.3449.1 ± 7.191.43-0.678