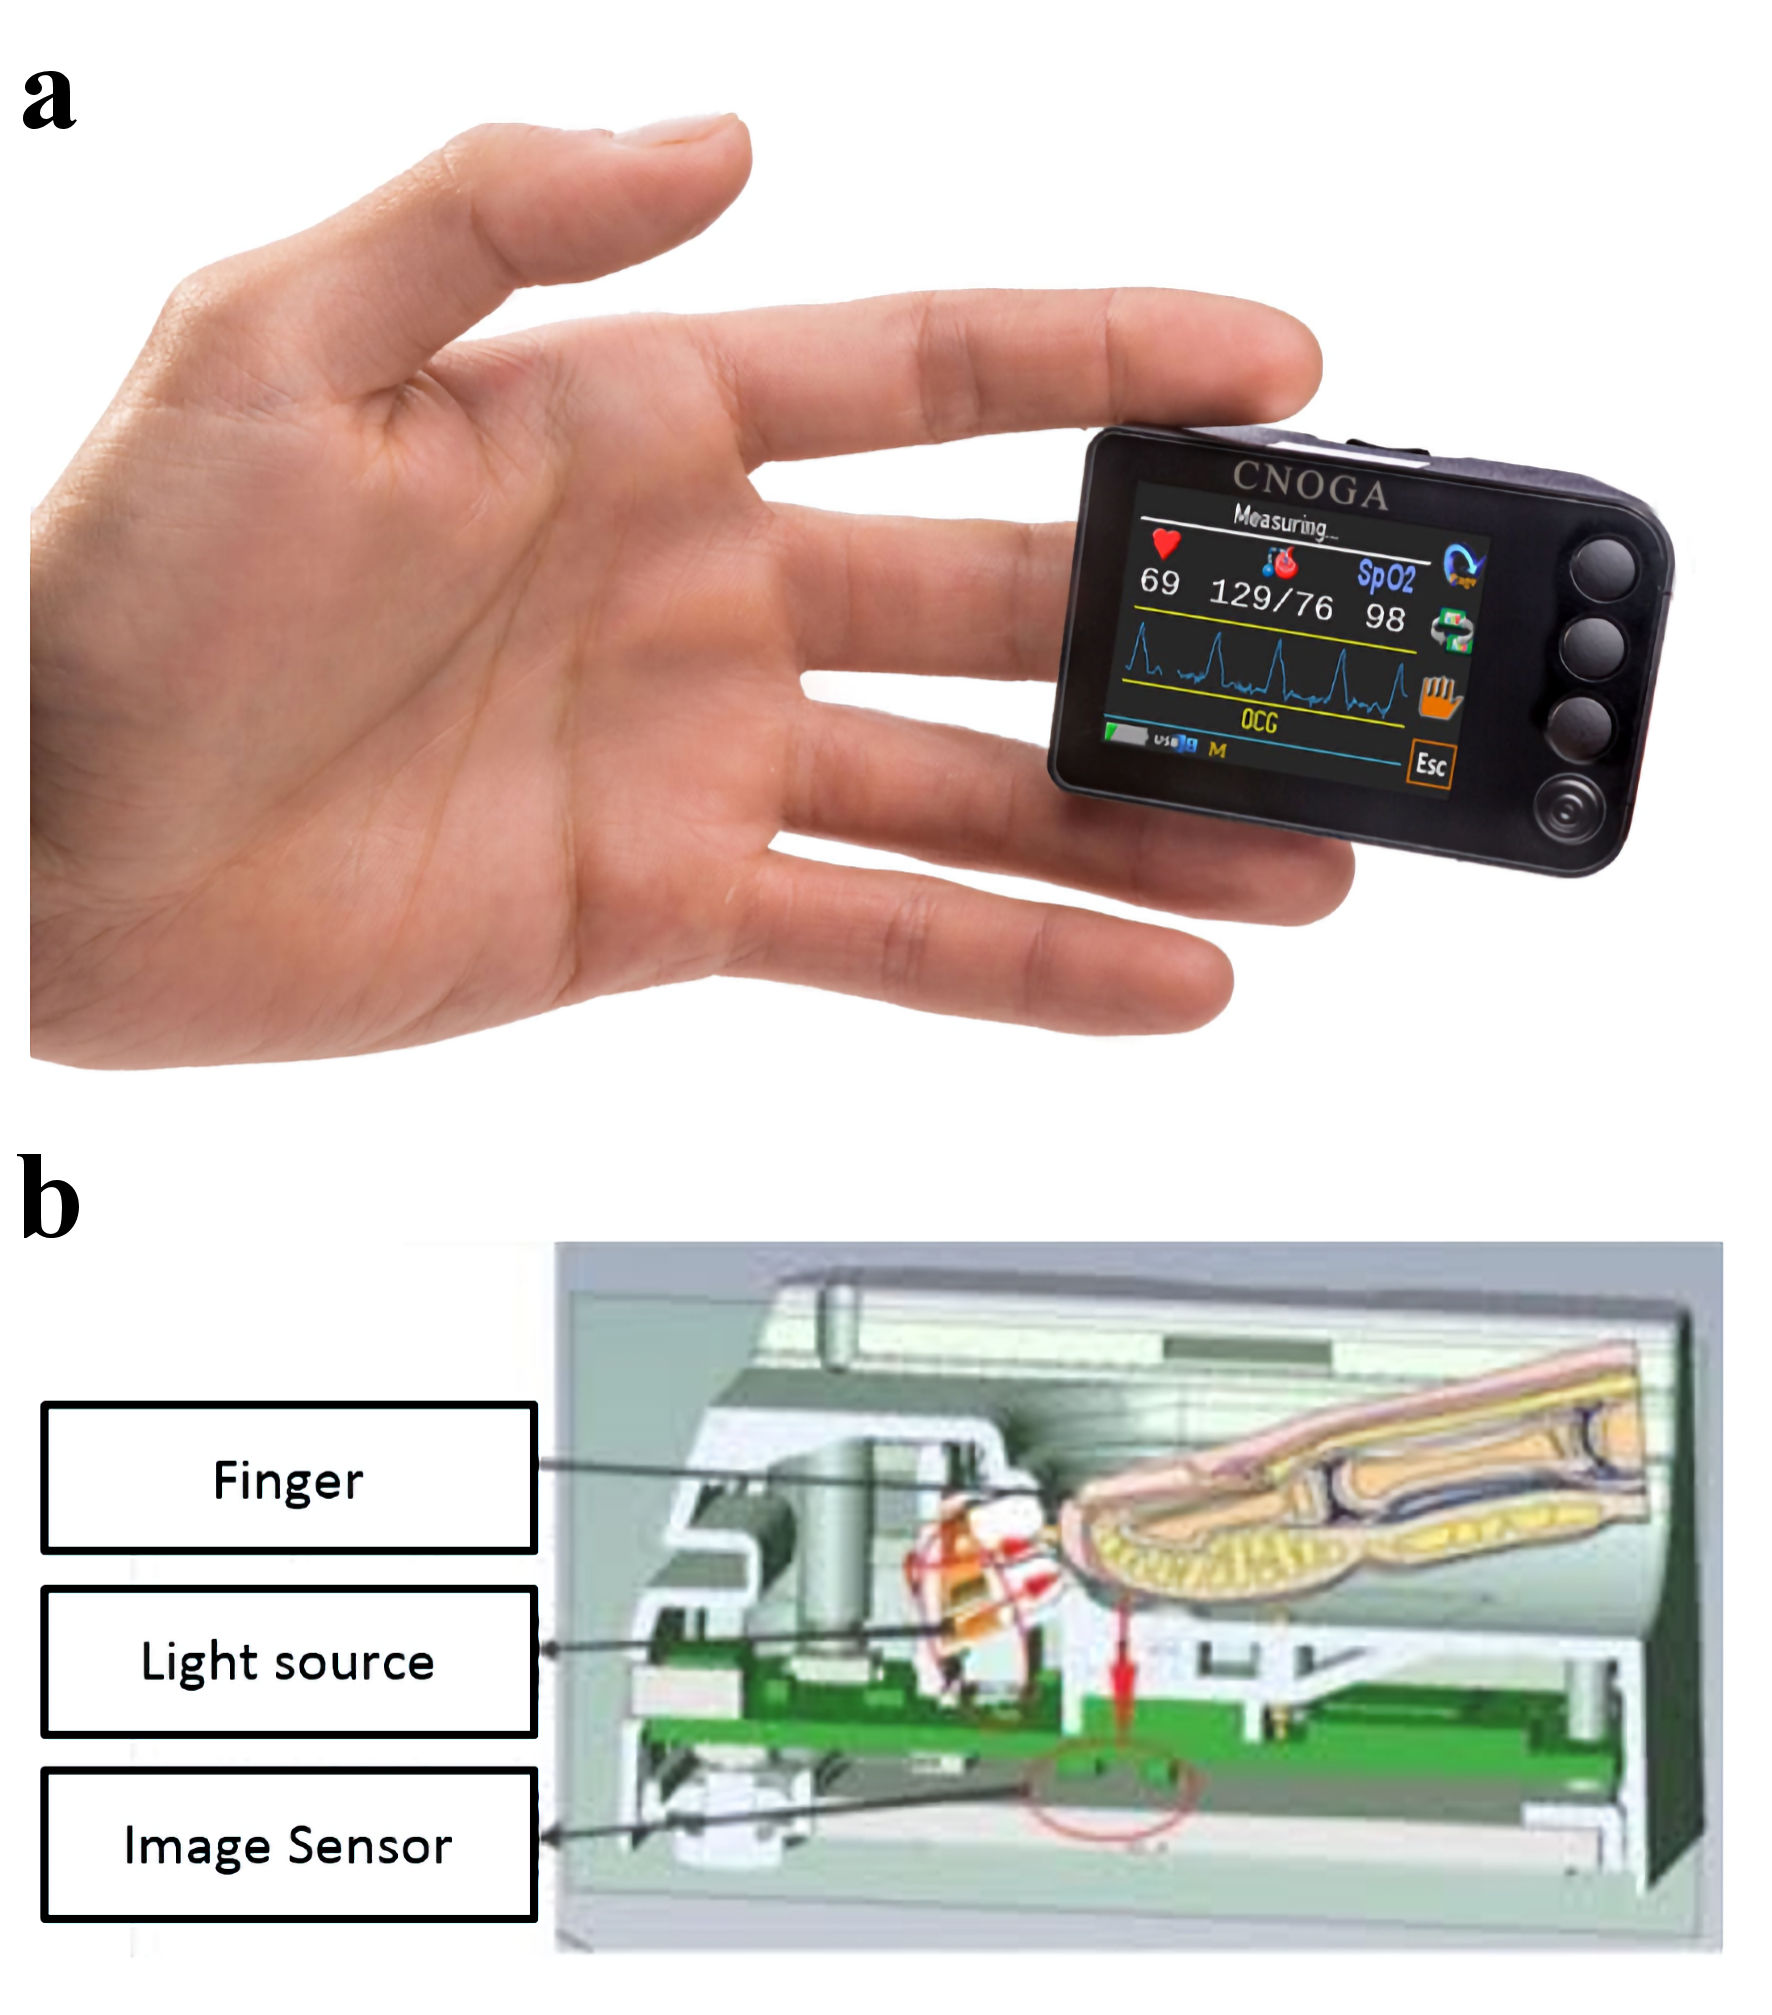
Figure 1. The TensorTip MTX. (a) View of the TensorTip MTX with correct placement. (b) The lower part of the figure shows how measurements technically are performed.
| Cardiology Research, ISSN 1923-2829 print, 1923-2837 online, Open Access |
| Article copyright, the authors; Journal compilation copyright, Cardiol Res and Elmer Press Inc |
| Journal website https://www.cardiologyres.org |
Original Article
Volume 13, Number 6, December 2022, pages 372-379
Perioperative Validation of the TensorTip™ MTX Device for Noninvasive Arterial Pressure Measurement: A Method Comparison Study
Figures
Tables
| Patient characteristics | Median (25-75% percentile) |
|---|---|
| Data are presented as median with interquartile range, absolute numbers, or percentage (%). BMI: body mass index; ASA: American Society of Anesthesiologists. | |
| Patients included (n) | 41 |
| Age (years) | 64.0 (52.0 - 76.0) |
| Height (m) | 1.71 (1.65 - 1.77) |
| Weight (kg) | 73.2 (63.5 - 82.9) |
| BMI (kg/m2) | 24.5 (21.3 - 27.8) |
| Gender, male (n (%)) | 22 (53.7%) |
| ASA classification | |
| ASA 1 | 2 (4.9%) |
| ASA 2 | 14 (34.1%) |
| ASA 3 | 24(58.5%) |
| ASA 4 | 1 (2.4%) |
| Type of surgery | |
| Abdominal | 13 (31.7%) |
| Pulmonal | 13 (31.7%) |
| Urology | 9 (22.0%) |
| Orthopaedic | 2 (4.9%) |
| Intracranial | 2 (4.9%) |
| Vascular | 1 (2.4%) |
| Other | 1 (2.4%) |
| Use of vasopressor (norepinephrine) | 25 (61.0%) |
| Mean (of 25 patients) µg/kg/min | 0.067 (0.031 - 0.102) |
| Temperature of patient (°C) | 36.1 (35.6 - 36.6) |
| Situation at time of measurement | |
| Start of surgery | 11 (26.8%) |
| End of surgery | 10 (24.4%) |
| Admission post anesthetic care unit | 20 (48.8%) |
| SBP (mm Hg) | DBP (mm Hg) | MBP (mm Hg) | |
|---|---|---|---|
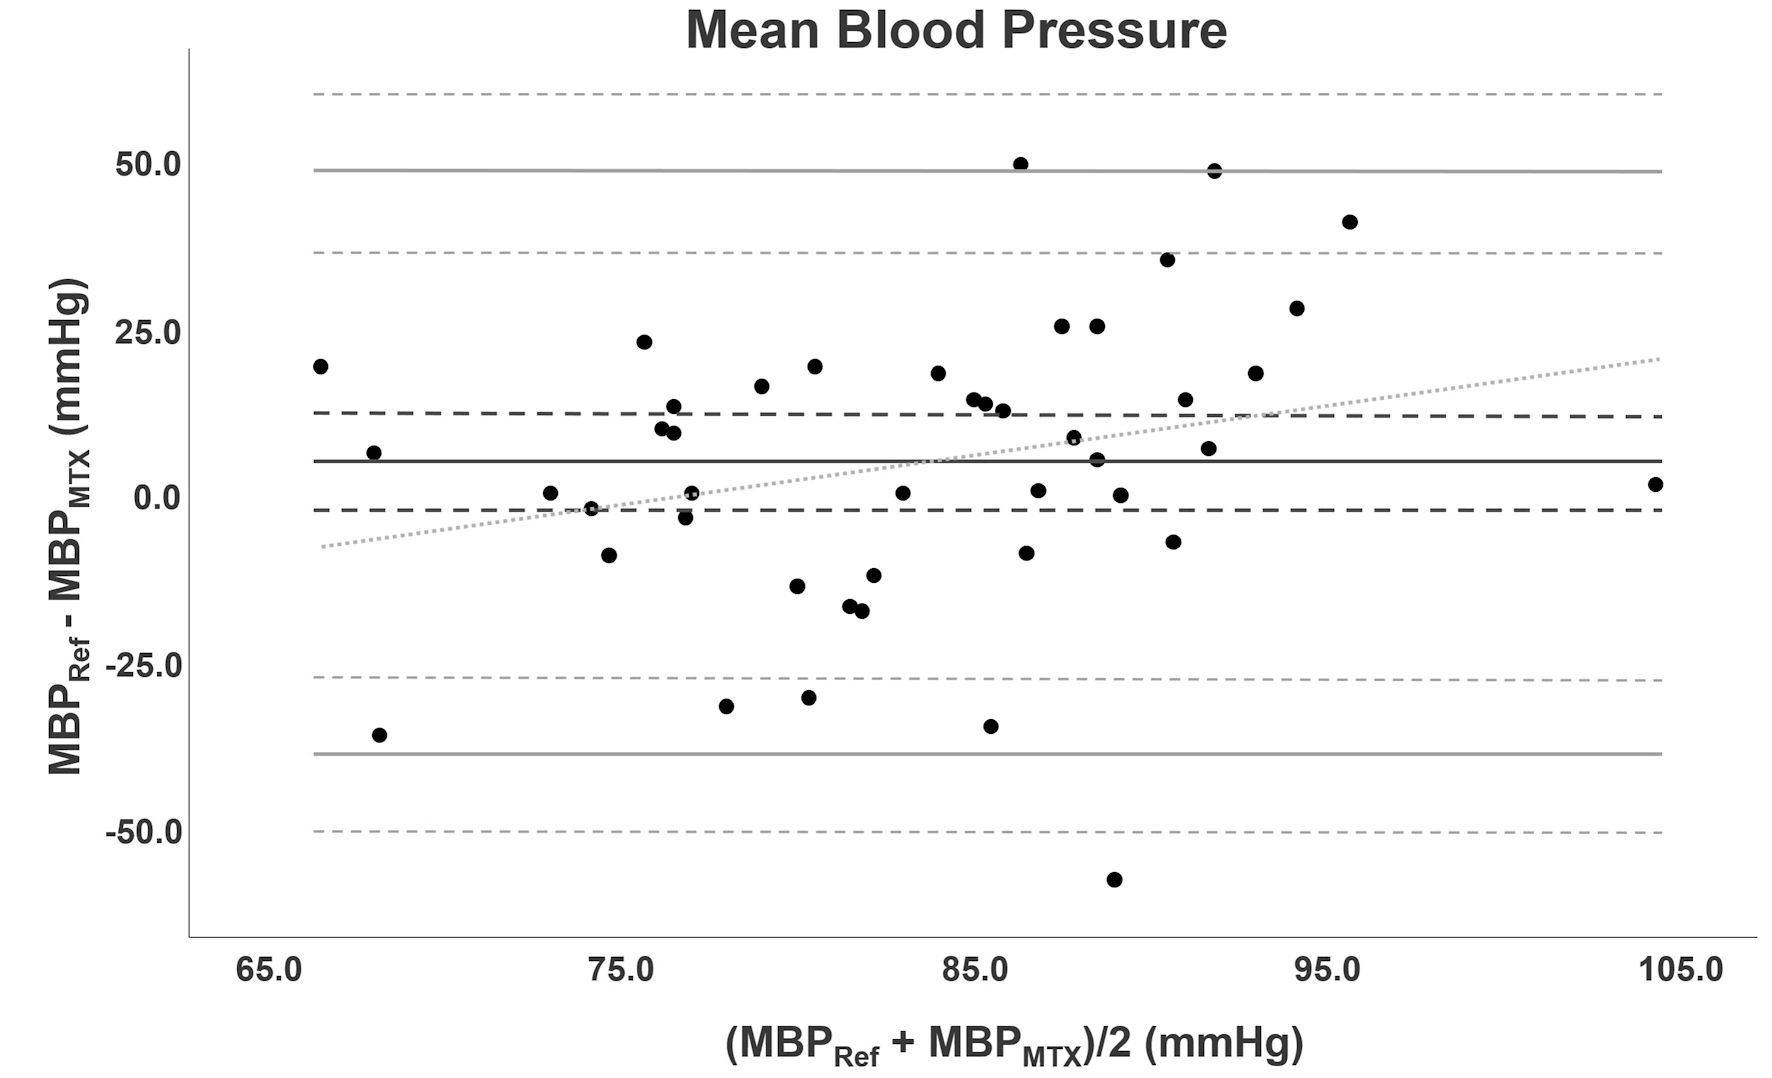
| Mean systolic, diastolic, and mean blood pressure, accompanied with ± standard deviation, measured using invasive (reference) method and the noninvasive MTX. SBP: systolic blood pressure; DBP: diastolic blood pressure; MBP: mean blood pressure. | |||
| Radial artery catheter | 127.1 ± 22.0 | 64.8 ± 11.5 | 85.6 ± 15.3 |
| TensorTip MTX | 120.9 ± 17.7 | 71.7 ± 11.2 | 81.2 ± 11.8 |