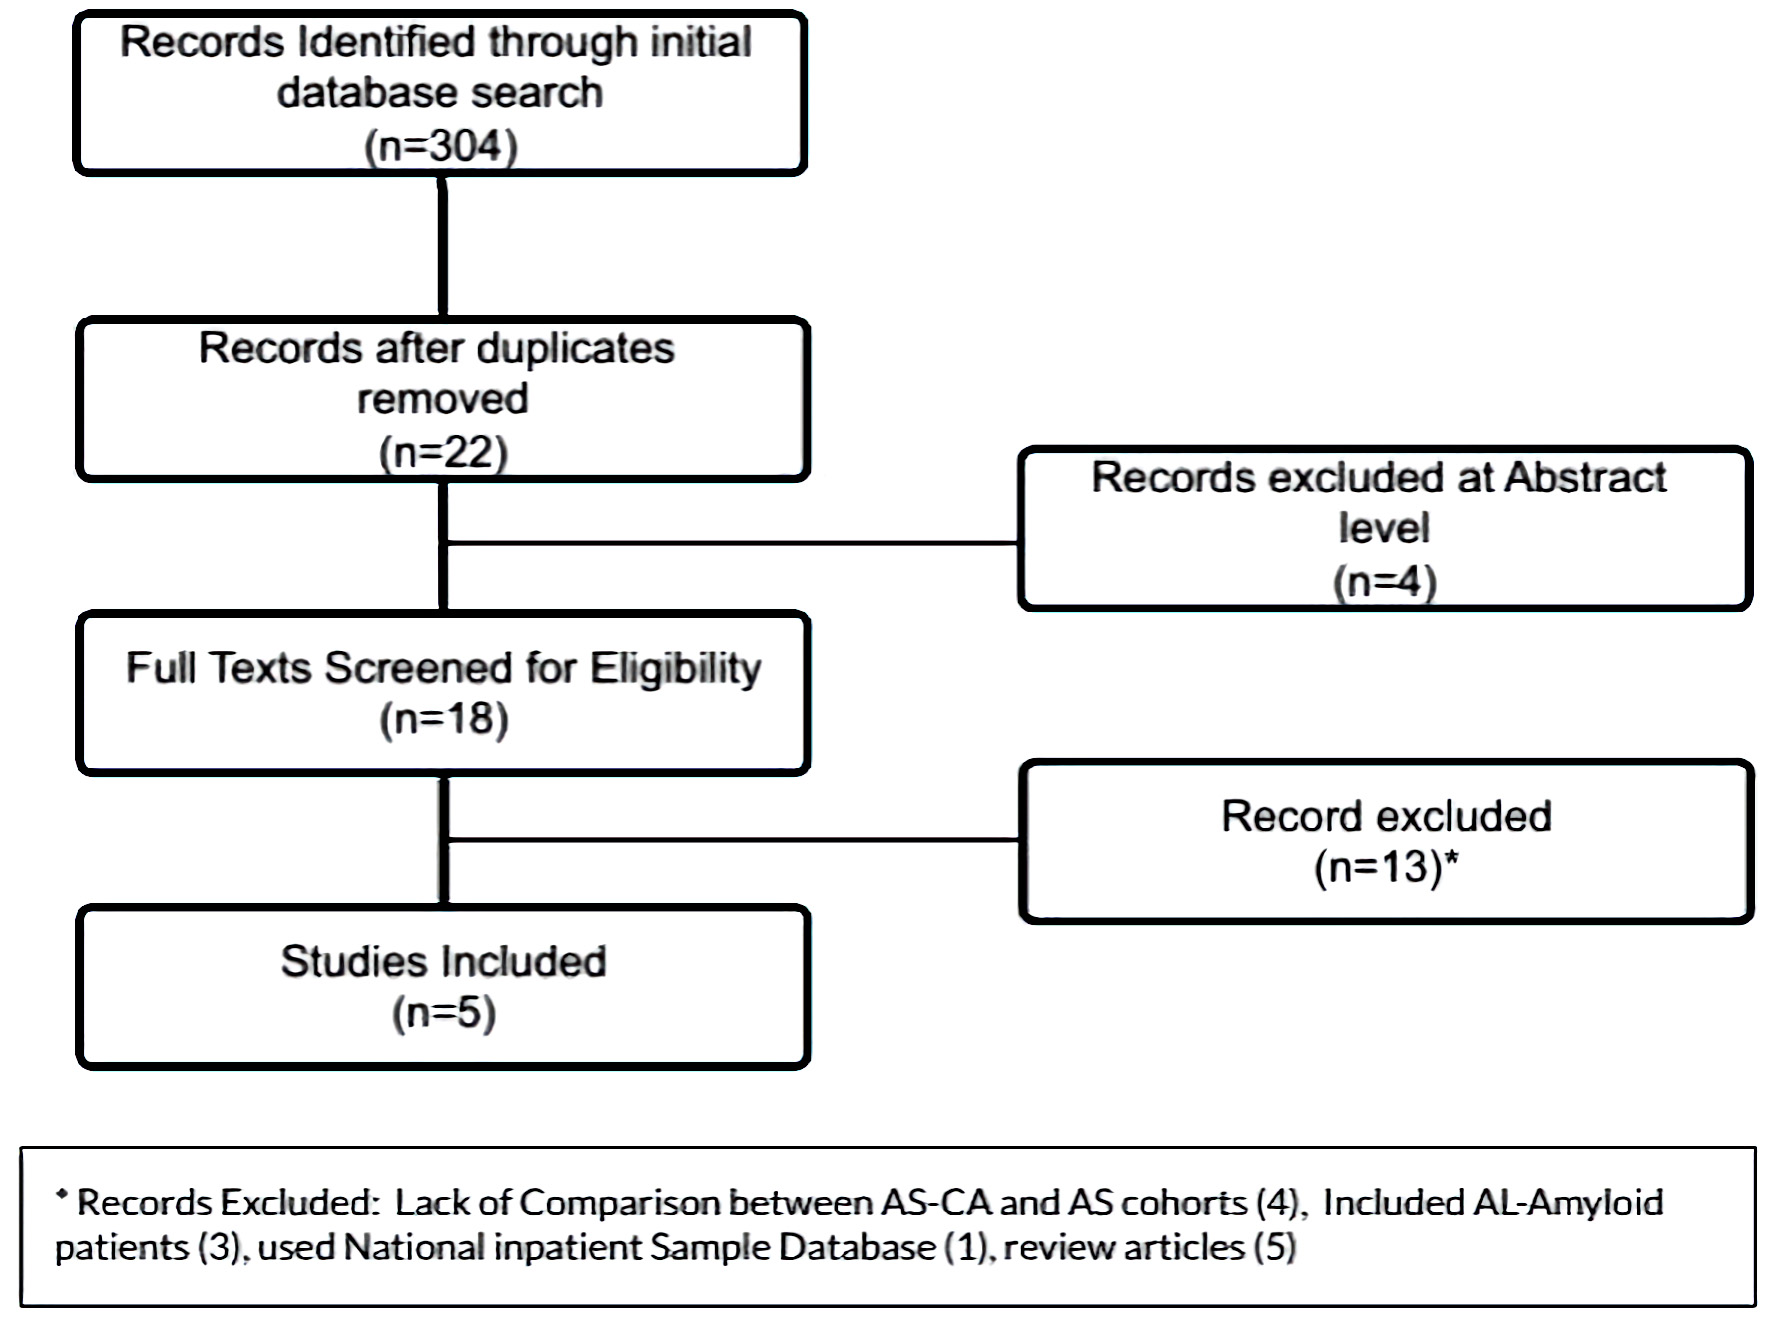
Figure 1. PRISMA flowsheet for inclusion of manuscripts in the meta-analysis. PRISMA: the preferred reporting items for systematic reviews and meta-analyses.
| Cardiology Research, ISSN 1923-2829 print, 1923-2837 online, Open Access |
| Article copyright, the authors; Journal compilation copyright, Cardiol Res and Elmer Press Inc |
| Journal website https://www.cardiologyres.org |
Original Article
Volume 13, Number 6, December 2022, pages 357-371
High Prevalence of Cardiac Amyloidosis in Clinically Significant Aortic Stenosis: A Meta-Analysis
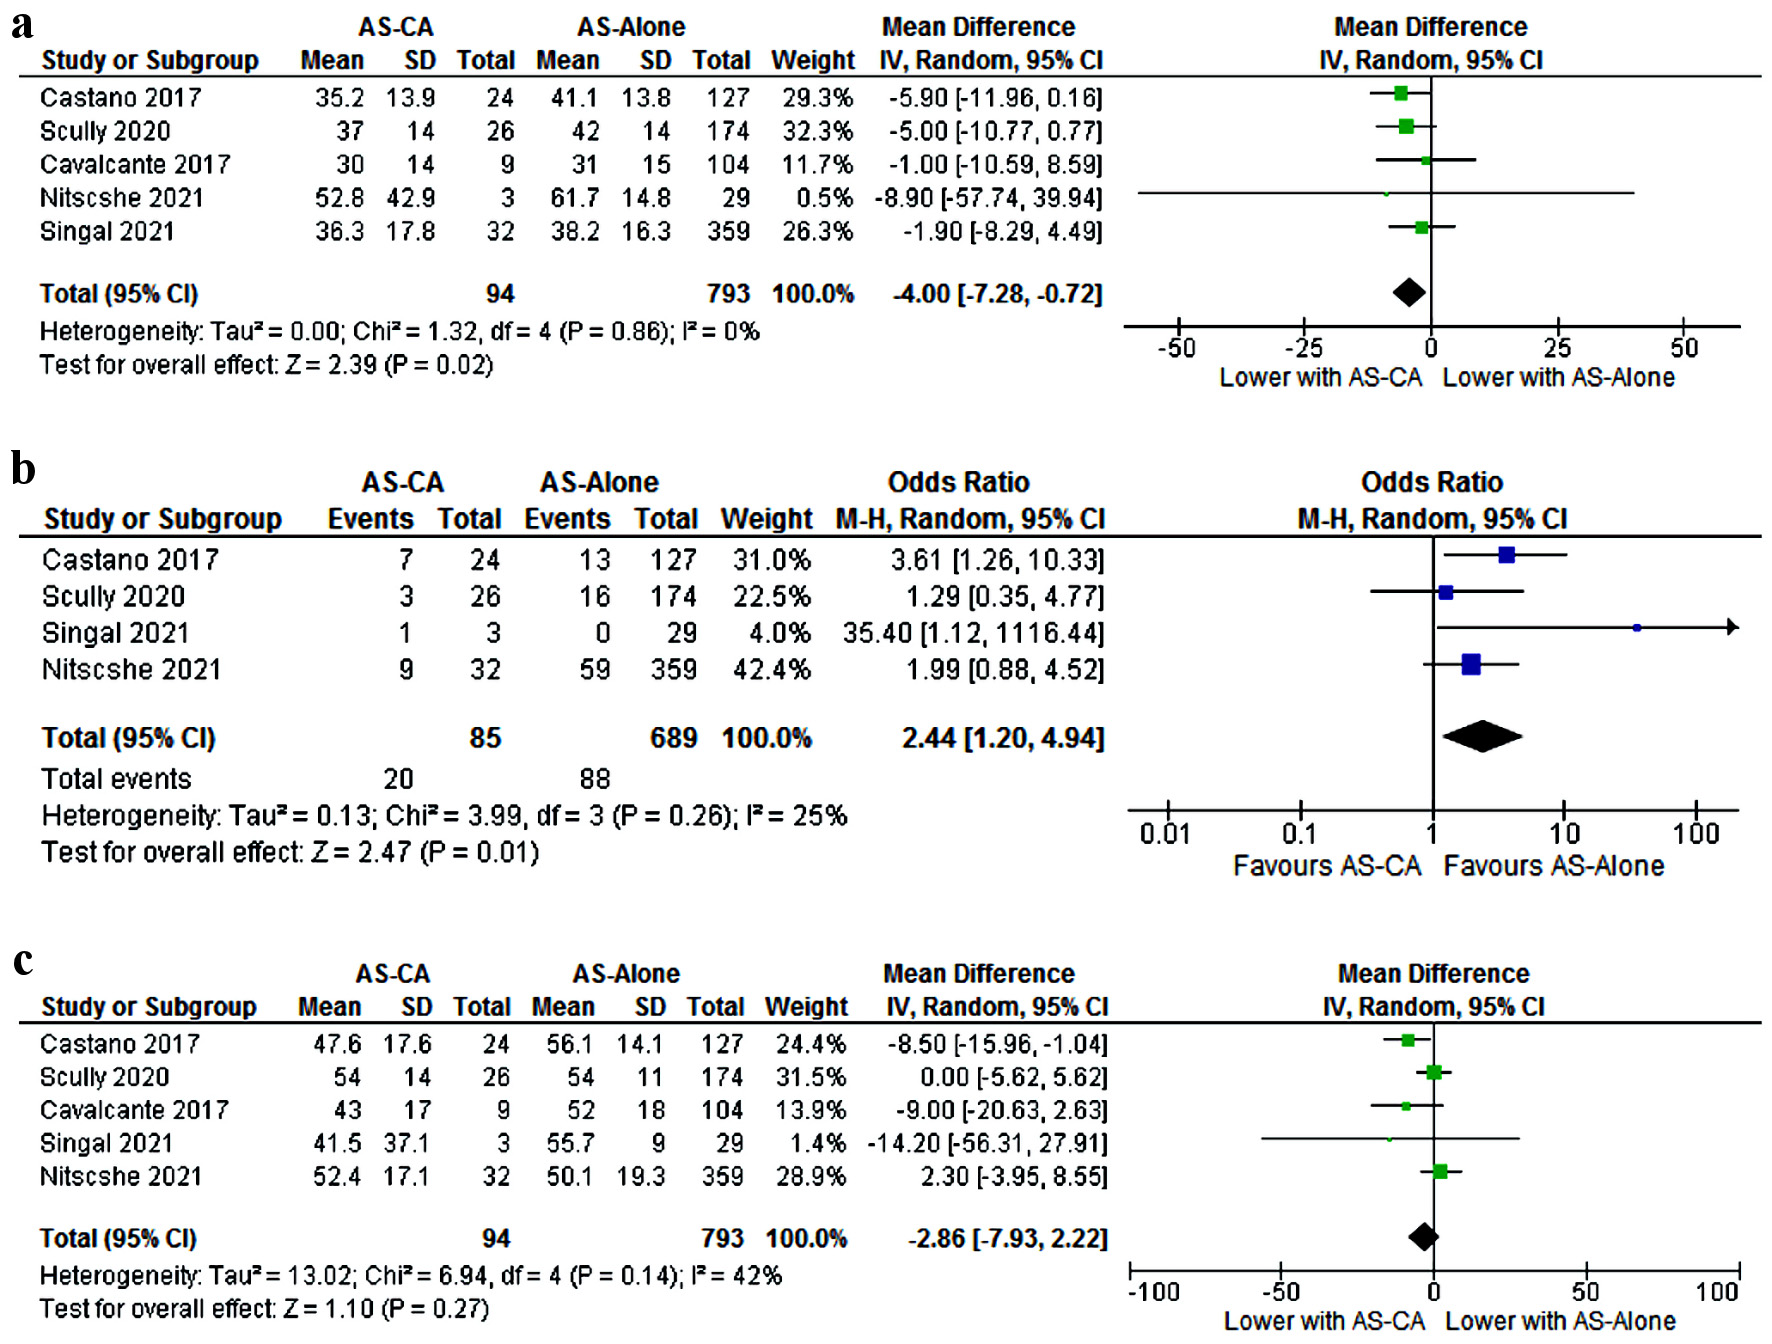
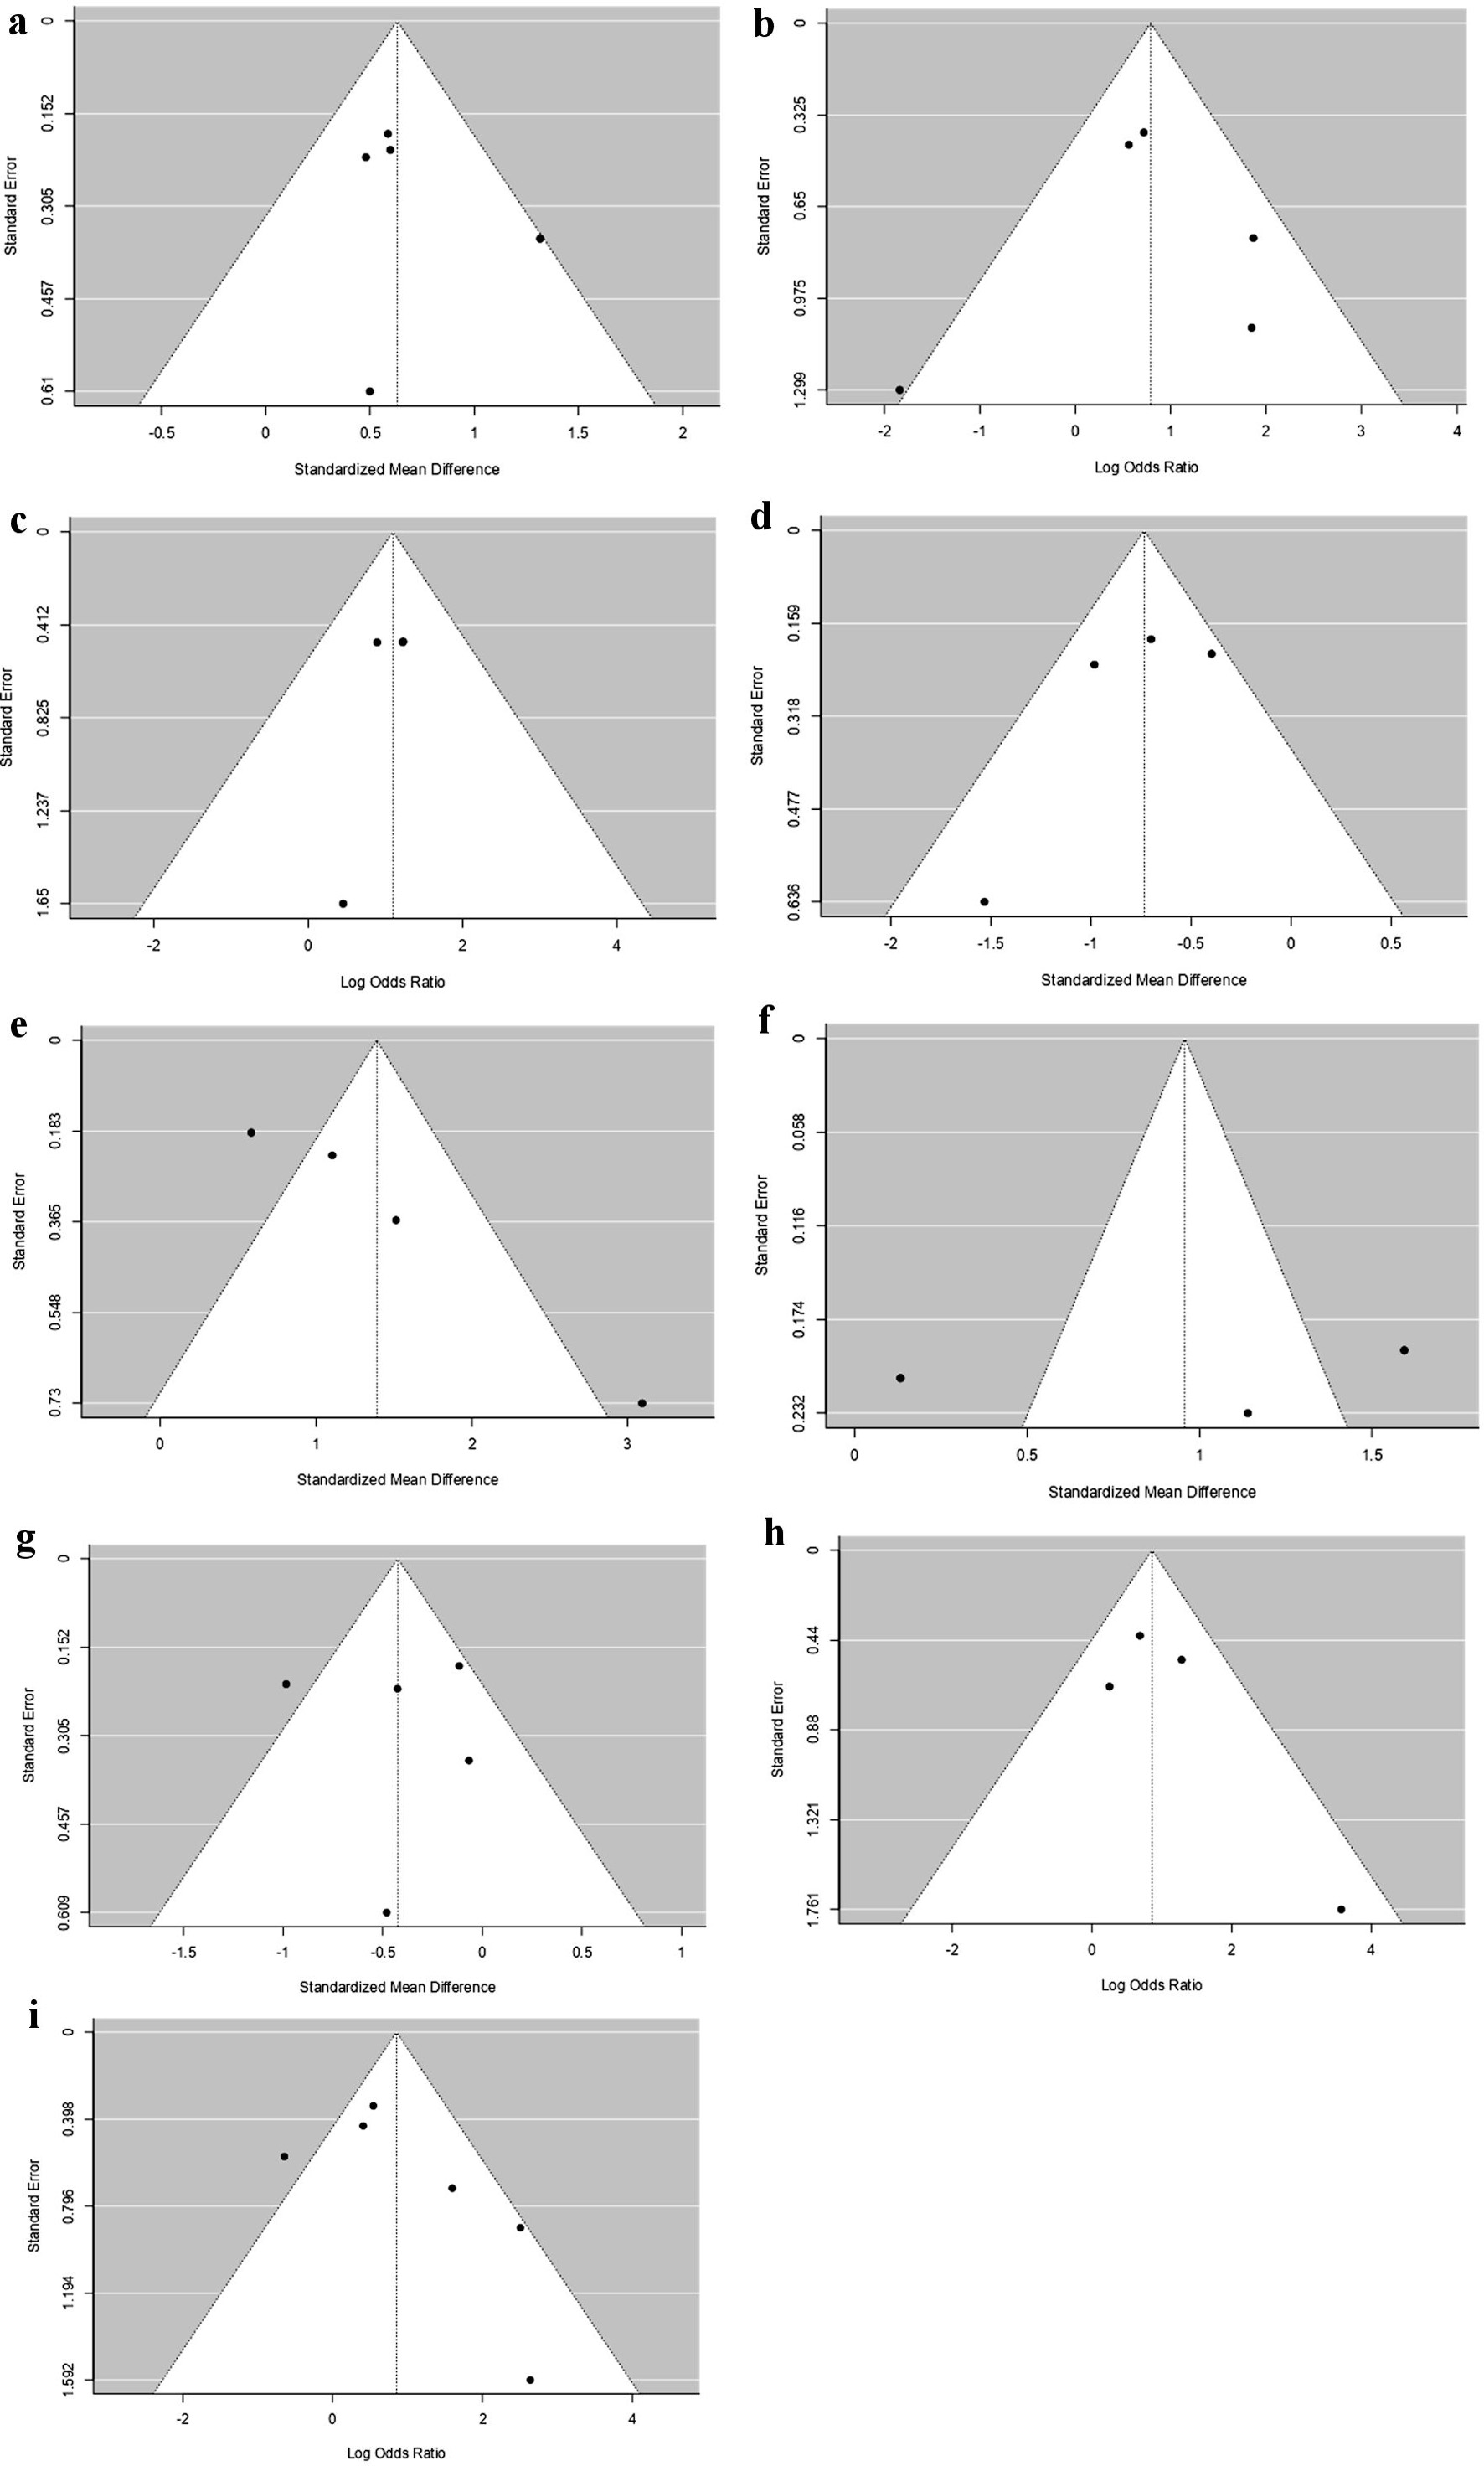
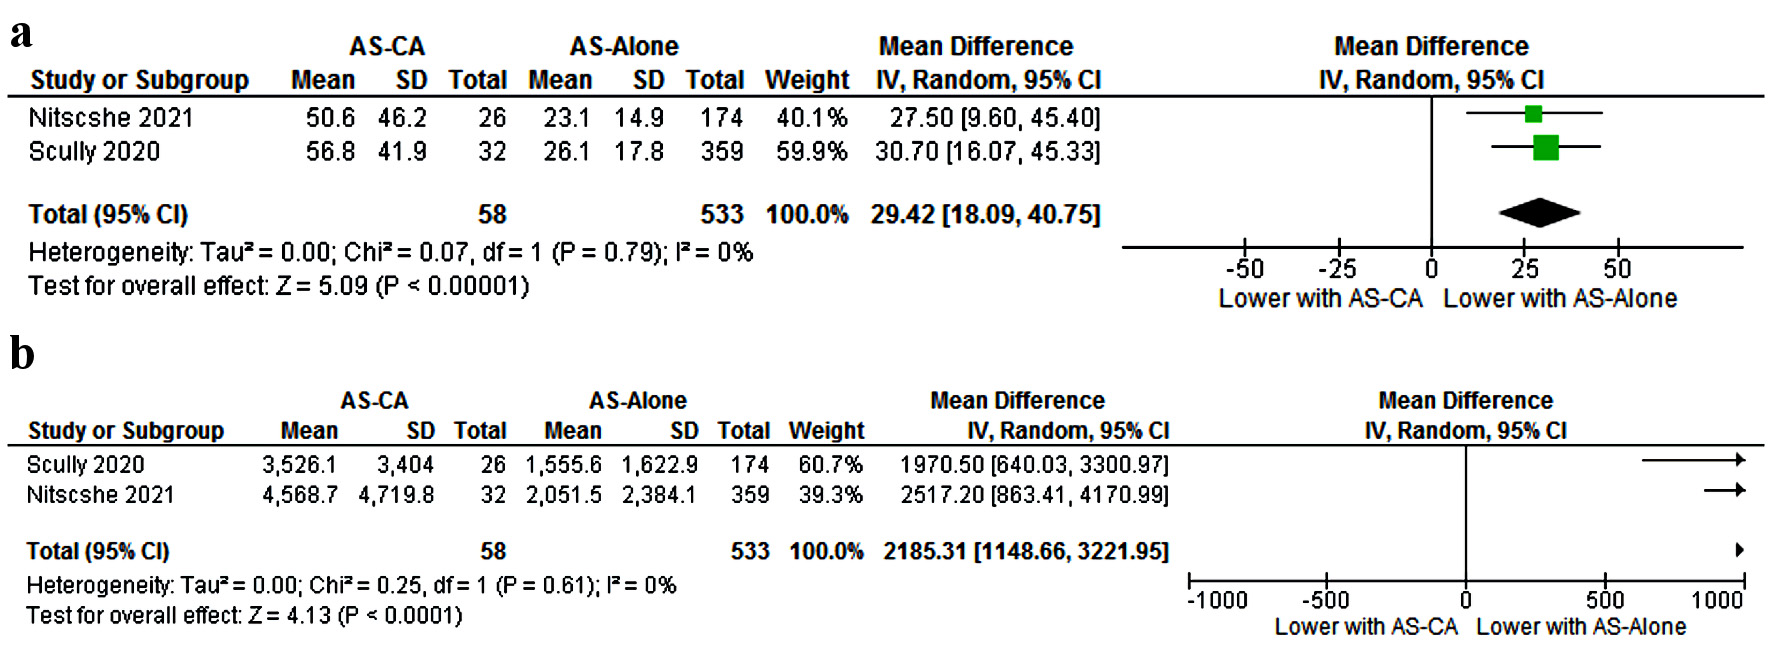
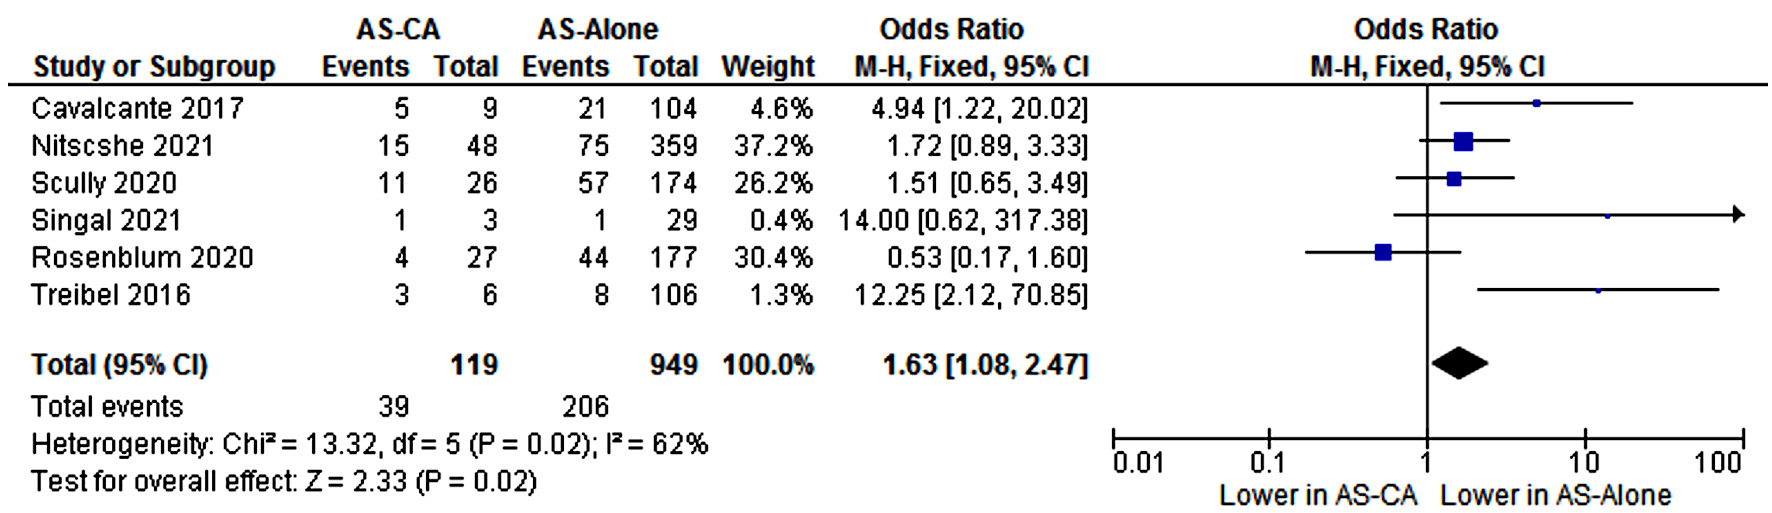
Figures
Tables
| Studies | AS-CA, % | Total patients |
|---|---|---|
| AS-CA: aortic stenosis with cardiac amyloidosis. | ||
| Nitsche et al, 2021 [8] | 32 (8%) | 407 |
| Scully et al, 2020 [9] | 26 (13%) | 200 |
| Castano et al, 2017 [10] | 24 (16%) | 151 |
| Singal et al, 2021 [11] | 3 (9%) | 32 |
| Cavalcante et al, 2017 [12] | 9 (8%) | 113 |
| Rosenblum et al, 2021 [13] | 27 (13%) | 204 |
| Treibel et al, 2016 [14] | 6 (4%) | 146 |
| Oda et al, 2020 [15] | 7 (28%) | 25 |
| Longhi et al, 2016 [16] | 5 (12%) | 43 |
| Total | 139 (11%) | 1,321 |
| Study | Design | Patient population | Primary screening modality for AS-CA | Parameters considered for ATTR-CA | Follow-up | Prevalence of AS-CA | Study center |
|---|---|---|---|---|---|---|---|
| Tc: technetium; DPD: 3,3-diphosphono-1,2-propanodicarboxylic acid; PYP: pyrophosphate; H/CL: heart-to-contralateral count ratio; MRI: magnetic resonance imaging; ATTR-CA: transthyretin cardiac amyloidosis; TAVI: transcatheter aortic valve implantation; TAVR: transcatheter aortic valve replacement; SAVR: surgical aortic valve replacement; AS: aortic stenosis. | |||||||
| Castano et al, 2017 [10] | Prospective cohort | 151 post-TAVR patients | 99mTc PYP | Diffuse 99mTc PYP uptake, visual score ≥ 2 and H/CL ≥ 1.5. Cardiac biopsy not performed. | Not available | 16% | Columbia University’s Center for Interventional Vascular Therapy, USA |
| Scully et al, 2020 [9] | Prospective cohort | 200 patients referred for TAVI | 99mTc-DPD | Perugini grade 1 - 3 indicate increasing uptake. Skewed distribution: none in Perugini grade 3, 69% patients in Perugini grade 2 and 31% patients with Perugini grade 1. Cardiac biopsy was not performed | Median 19 months | 13% | Barts Heart Center, London and John Radcliffe Hospital, Oxford, UK |
| Nitsche et al, 2021 [8] | Prospective cohort | 407 patients prior to TAVR | 99mTc-DPD | Perugini grade 2 and 3 regarded as clinical amyloidosis. | Median 1.7 years | 8% | 3 Centers in Vienna, Austria; Oxford and London, UK |
| Singal et al, 2021 [11] | Prospective cohort | 32 patients prior to SAVR | 99mTc PYP | Diagnosis of ATTR-CA was made based on preoperative 99mTc PYP scan, intraoperatively obtained interventricular septal biopsy and excised native aortic valve histopathology for ATTR-CA. Perugini grade 2 and 3 and H/CL ratio ≥ 1.5 are considered as significantly positive for diagnosis of myocardial ATTR-CA | 1 year | 9% | AIIMS, India |
| Cavalcante et al, 2017 [12] | Retrospective cohort | 113 patients with severe AS | Cardiac MRI | Typical late gadolinium enhancement, and morphological findings including increased left ventricular wall thickness and abnormal myocardial and blood pool kinetics were used to identify CA. Four AS patients underwent cardiac biopsy. | Median 18 months | 8% | University of Pittsburgh, USA |
| Studies | Selection | Comparability | Outcomes | ||||
|---|---|---|---|---|---|---|---|
| Representativeness of exposed cohort | Selection of nonexposed cohort | Ascertainment of exposure | Assessment of outcome | Duration of follow-up | Completeness of follow-up | ||
| N/A: not available. | |||||||
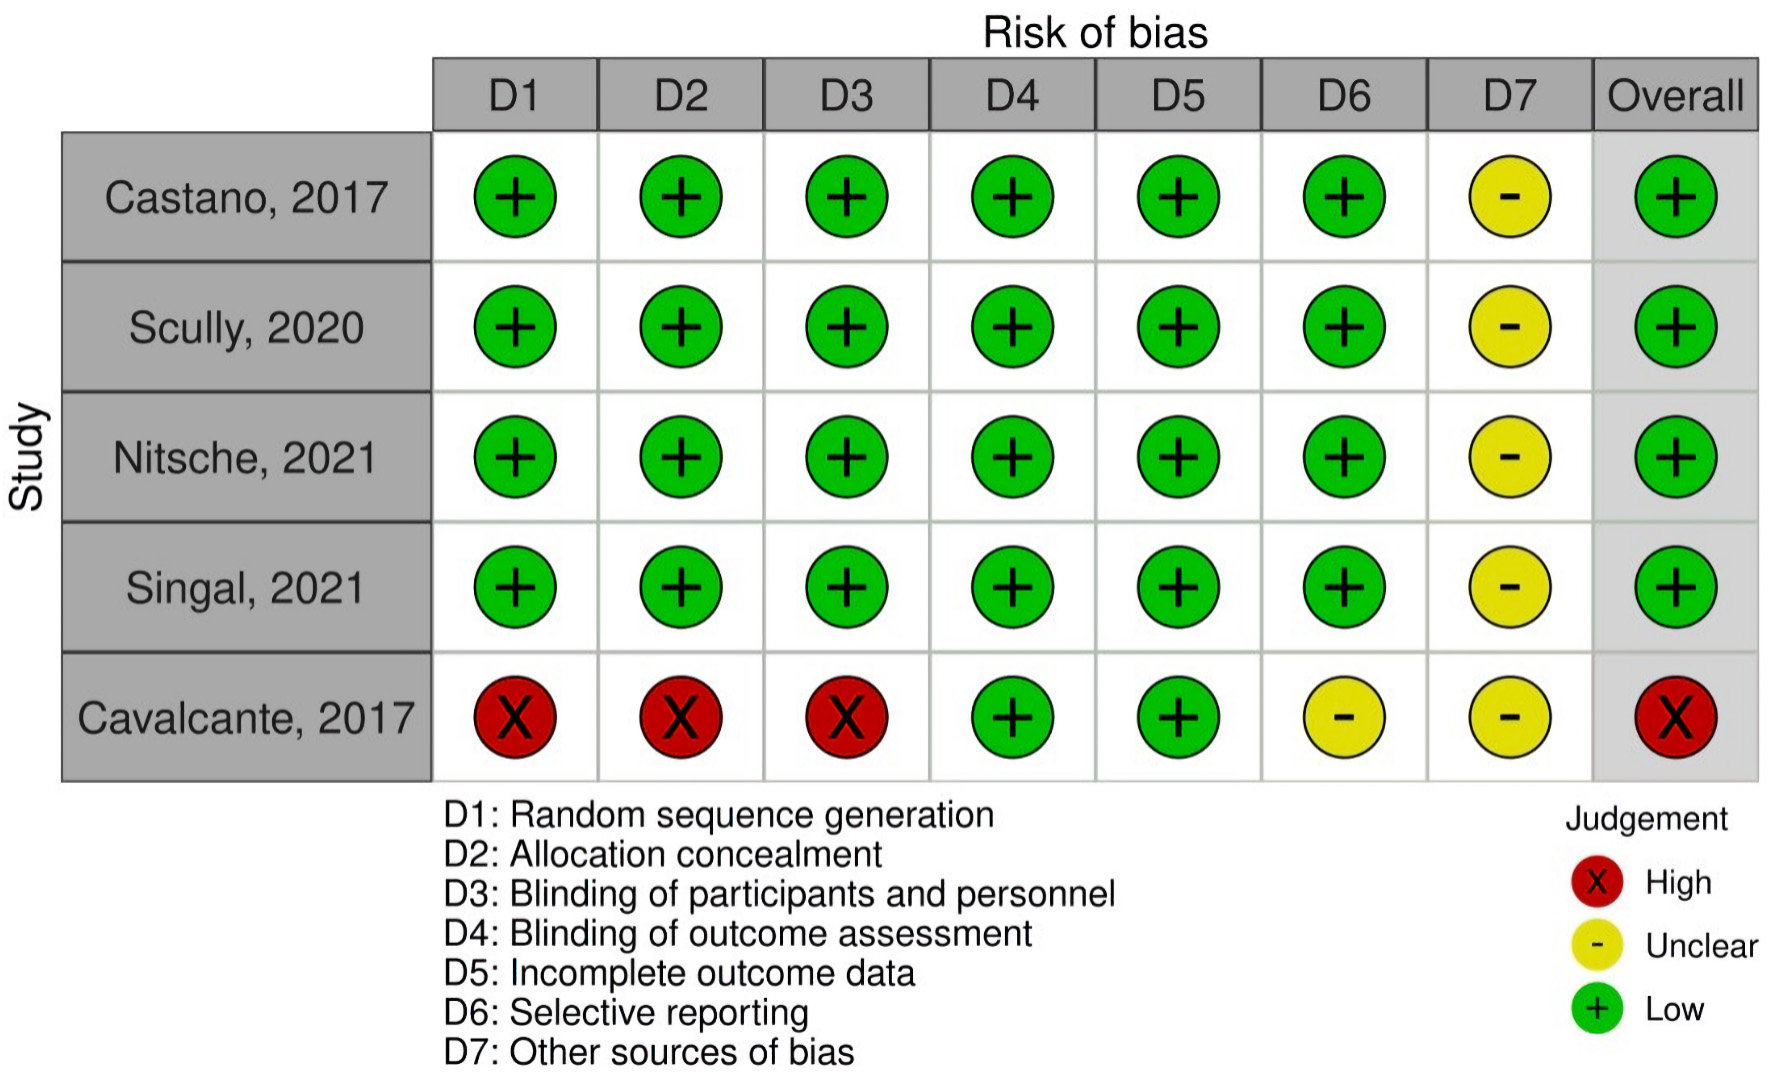
| Castano et al, 2017 [10] | ★ | ★ | N/A | ★★ | ★ | N/A | N/A |
| Scully et al, 2020 [9] | ★ | ★ | N/A | ★★ | ★★ | ★ | ★ |
| Nitsche et al, 2021 [8] | ★ | ★ | N/A | ★★ | ★★ | ★ | ★ |
| Singal et al, 2021 [11] | ★ | ★ | N/A | ★ | ★ | ★ | ★ |
| Cavalcante et al, 2017 [12] | ★ | ★ | N/A | ★ | ★ | N/A | ★ |
| Studies | Cohorts | Age | Males | Hypertension | Diabetes mellitus | Carpal tunnel syndrome | Coronary artery disease | BMI (kg/m2) |
|---|---|---|---|---|---|---|---|---|
| N/A: not available; AS-CA: aortic stenosis with cardiac amyloidosis; AS-alone: aortic stenosis; BMI: body mass index. | ||||||||
| Castano et al, 2017 [10] | AS-CA | 86.3 | 91.7% | 91.7% | N/A | 16.7% | 75% | 25.5 |
| AS-alone | 83.3 | 63% | 84.3% | N/A | 5.5% | 61.4% | 27 | |
| Scully et al, 2020 [9] | AS-CA | 88 | 62% | 73% | 12% | N/A | N/A | N/A |
| AS-alone | 85 | 48% | 78% | 26% | N/A | N/A | N/A | |
| Cavalcante et al, 2017 [12] | AS-CA | 88 | 89% | 77.8% | 33.3% | N/A | N/A | N/A |
| AS-alone | 70 | 56% | 73.1% | 34.6% | N/A | N/A | N/A | |
| Singal et al, 2021 [11] | AS-CA | 72.3 | 33.3% | 33.3% | 66.7% | N/A | 66.7% | N/A |
| AS-alone | 69 | 75.8% | 41.4% | 20.7% | N/A | 31% | N/A | |
| Nitsche et al, 2021 [8] | AS-CA | 87.5 | 65.6% | 90.6% | 18.8% | 18.8% | 21.9% | 26 |
| AS-alone | 81 | 48.2% | 82.6% | 25.6% | 1.8% | 46.8% | 27 | |
| NT-proBNP: N-terminal pro-brain natriuretic peptide; 6MWT: 6-min walk test; ECG: electrocardiogram; RBBB: right bundle branch block; hsTNT: high-sensitivity cardiac troponin; NT-proBNP: N-terminal pro-brain natriuretic peptide; IVS: interventricular septum; LVMI: left ventricular mass index; LFLG: low-flow low-gradient; LA: left atrial; MCF: myocardial contraction fraction; SVI: stroke volume index. |
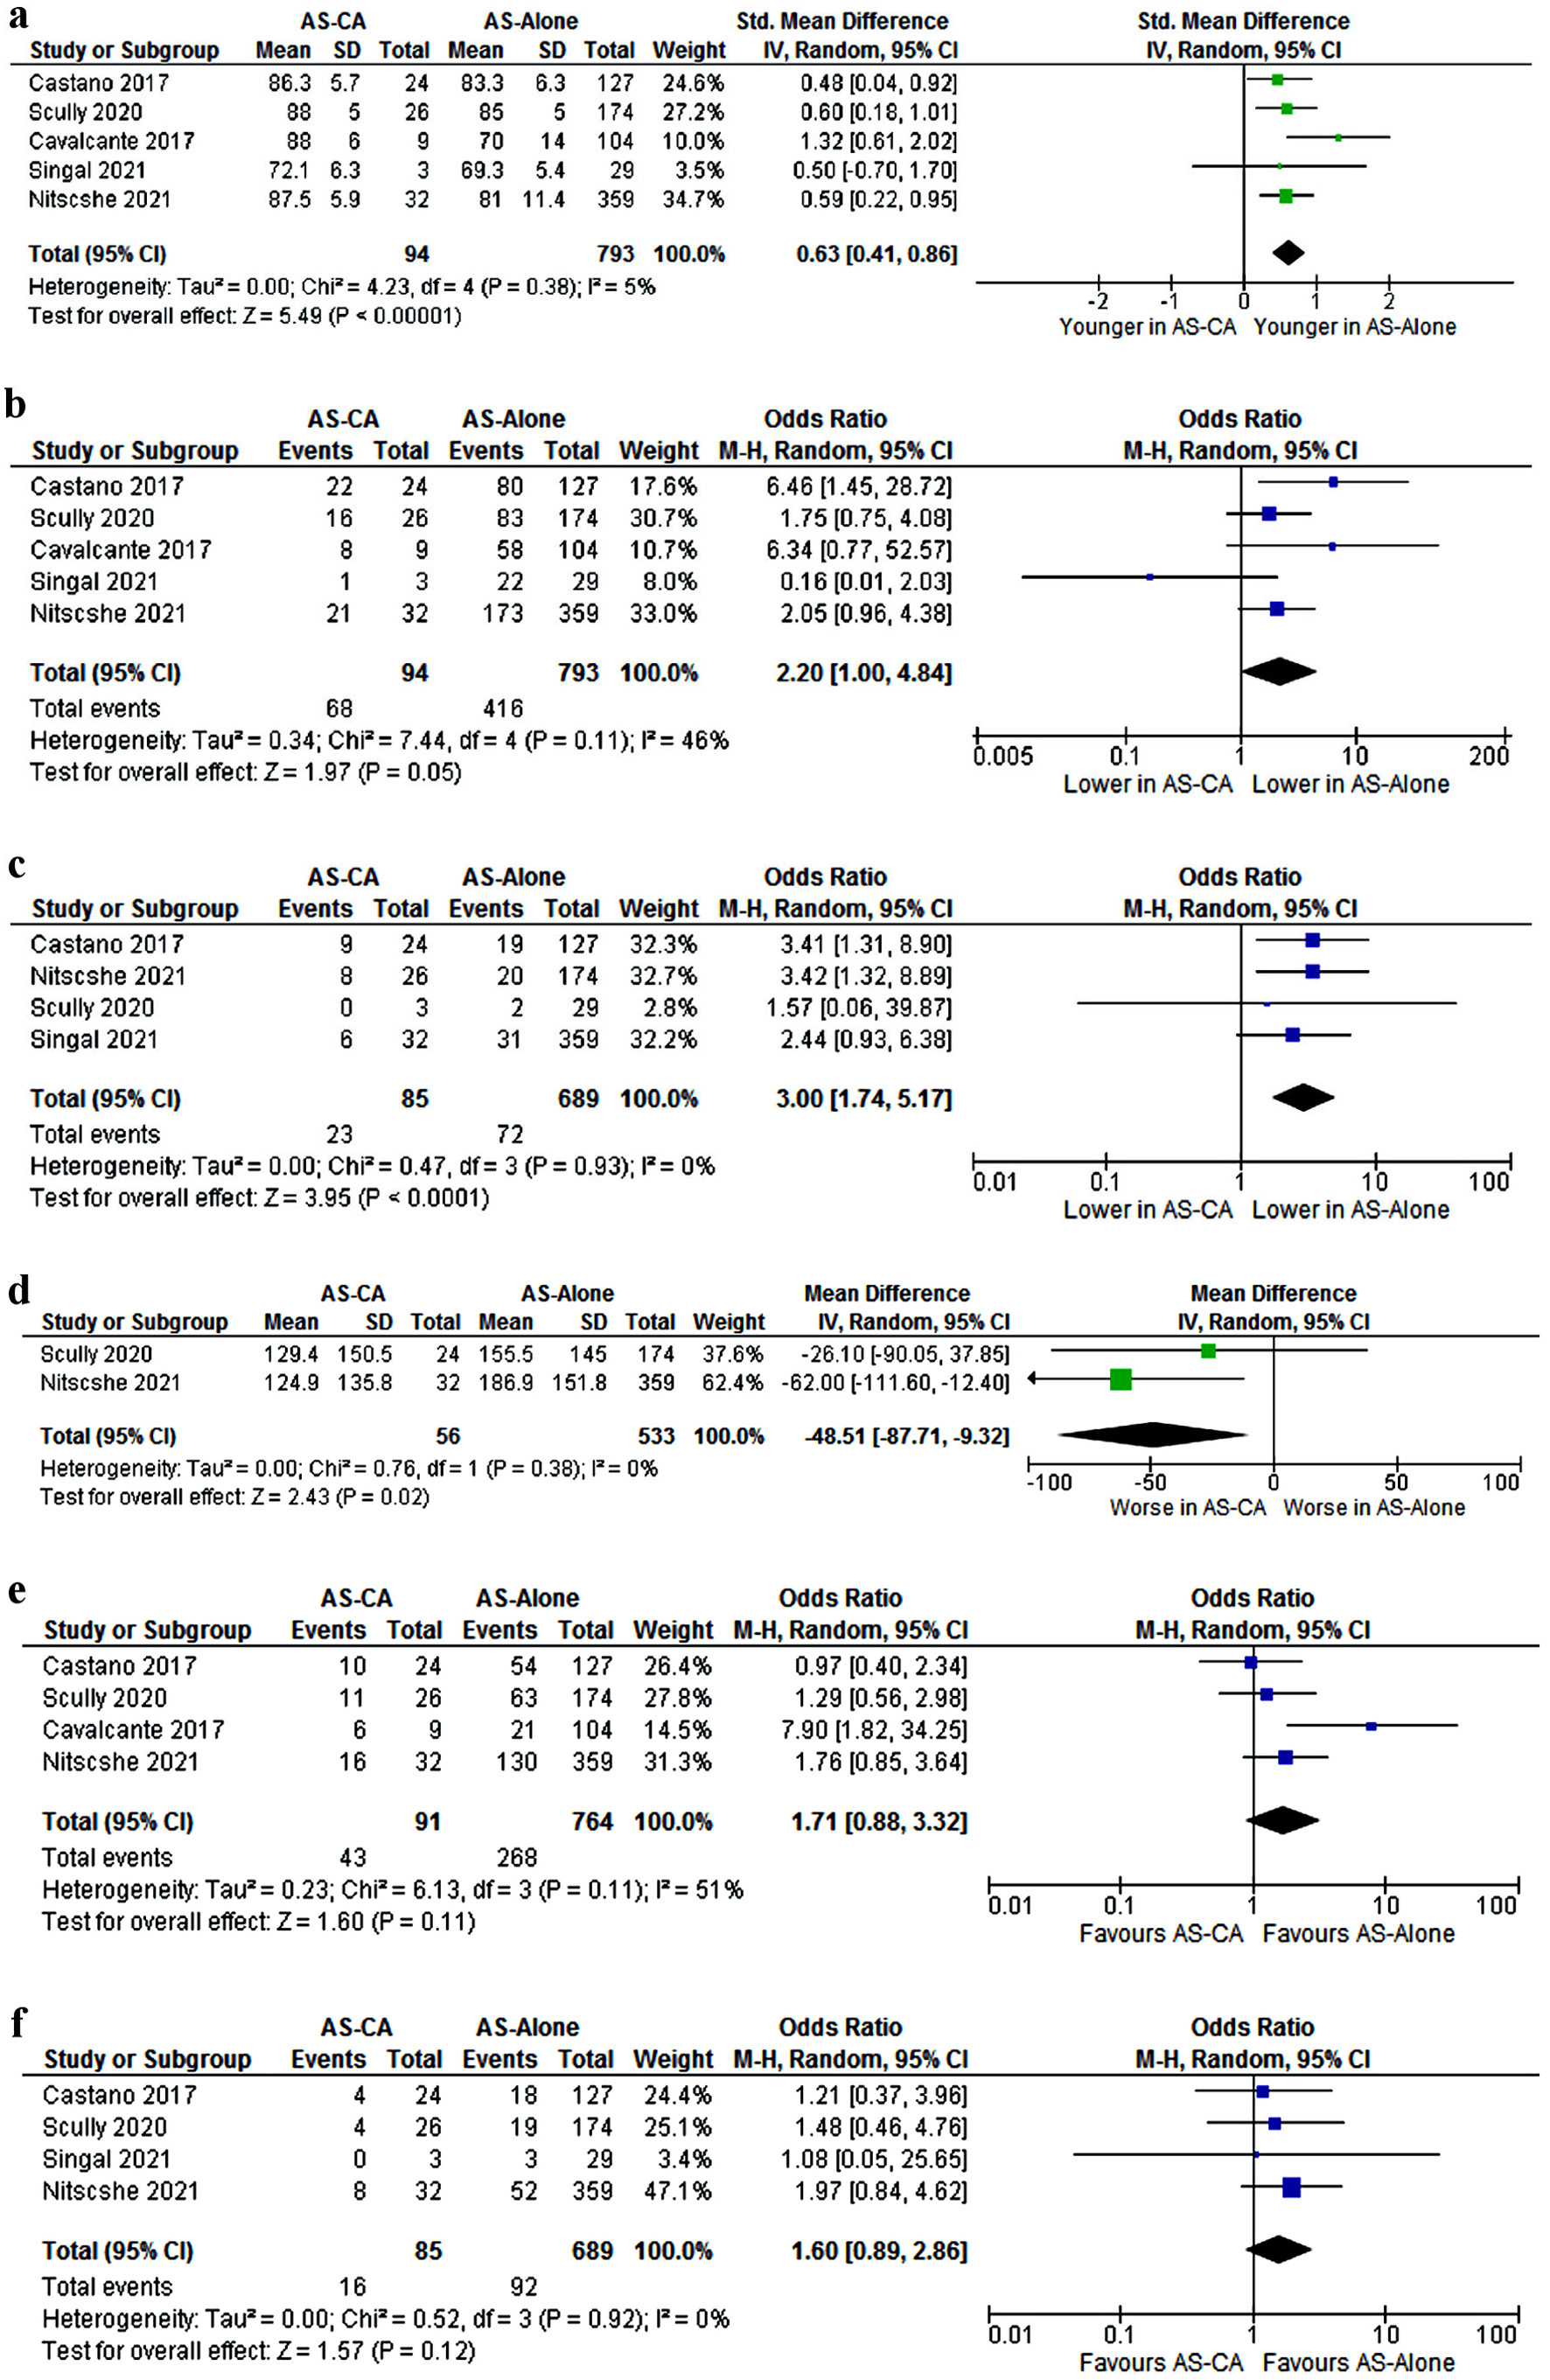
| Clinical parameters |
| Old age (mean 84 vs. 78 years) |
| Carpal tunnel syndrome |
| Low 6MWT (127 m vs. 171 m) |
| ECG |
| RBBB |
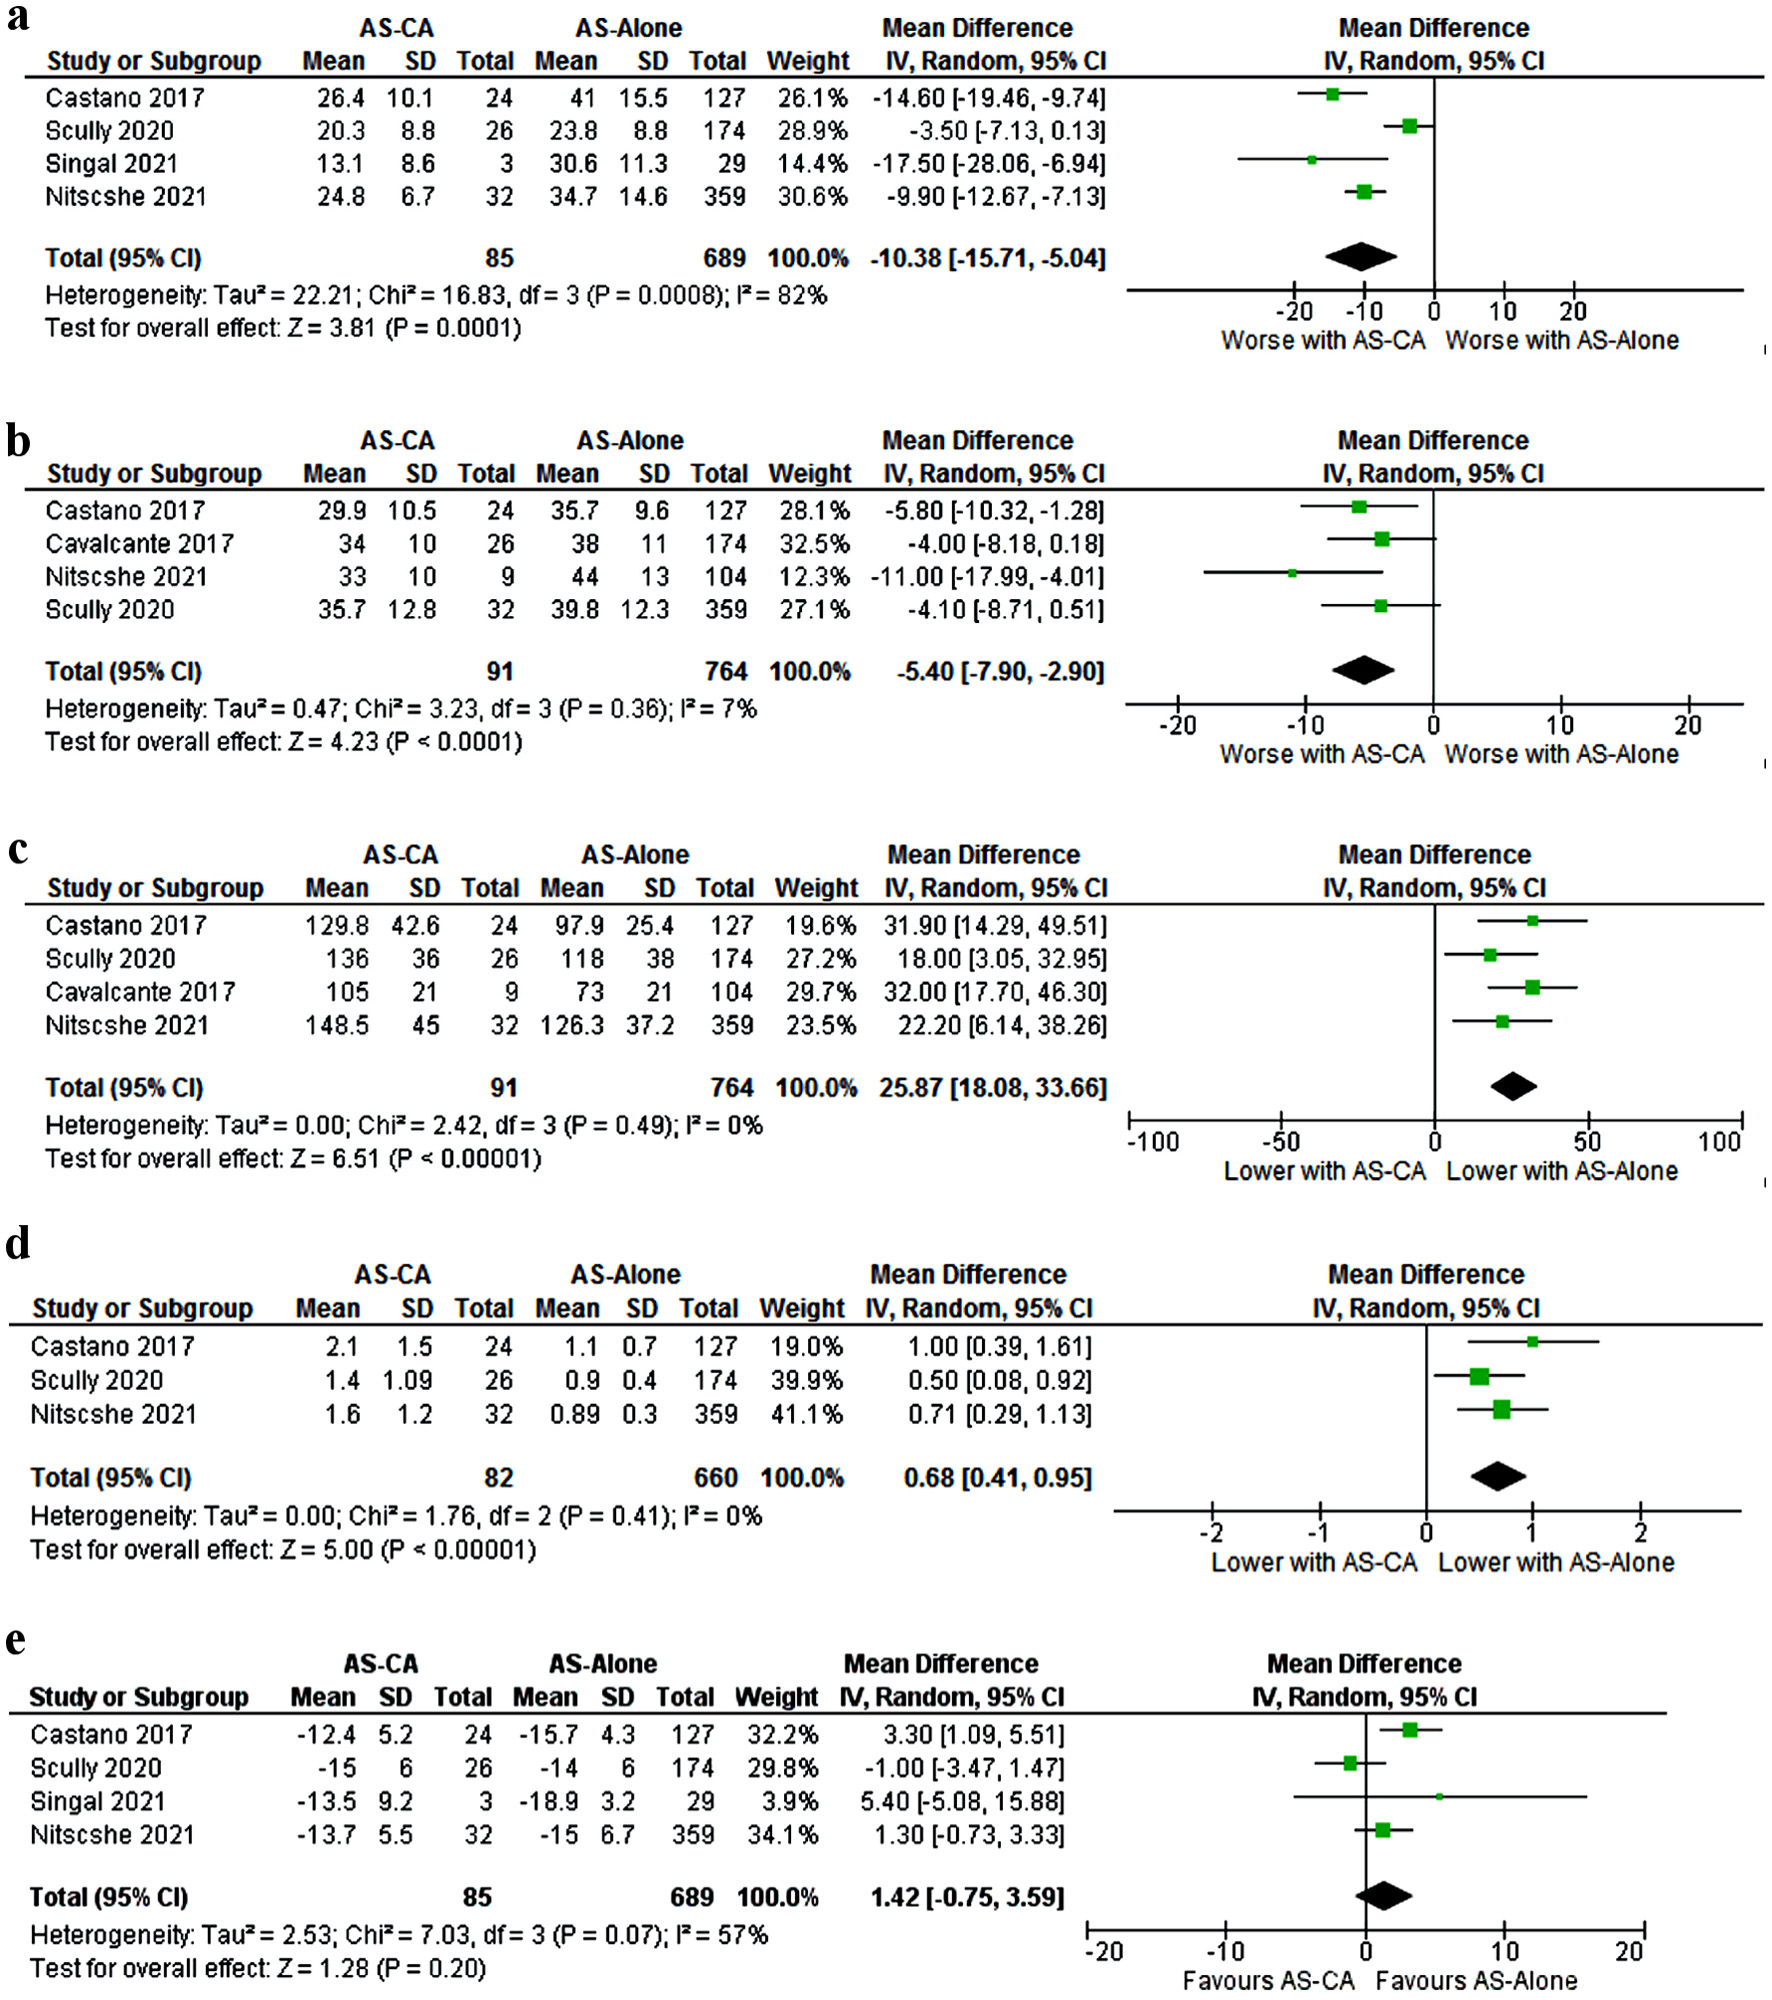
| Laboratory |
| Higher hsTNT (53.7 vs. 24.6 ng/L) |
| Higher NT-proBNP (4,047 vs. 1,803 ng/L) |
| Echocardiogram (dimensions) |
| Thick IVS (1.5 vs. 1.3 cm) |
| Large LVMI (129.8 vs. 103.8 g/m2) |
| Large LA diameter (4.9 vs. 4.5 cm) |
| Echocardiogram (Doppler) |
| Classical LFLG |
| Higher E/A ratio (1.7 vs. 0.9) |
| Lower mitral annular S’ (4.5 vs. 6.3 cm/s) |
| Functional assessment |
| Low MCF (21.15% vs. 32.5%) |
| Low SVI (33.1 vs. 39.3 mL/m2) |
| Effect | AS-CA | AS alone | Estimate | 95% CI | Standard error | P value | |
|---|---|---|---|---|---|---|---|
| LL | UL | ||||||
| CI: confidence interval; LL: lower limit; UL: upper limit; AS-CA: aortic stenosis with cardiac amyloidosis; AS-alone: aortic stenosis; hsTNT: high-sensitivity cardiac troponin; NT-proBNP: N-terminal pro-brain natriuretic peptide; 6MWT: 6-min walk test; MCF: myocardial contraction fraction; SVI: stroke volume index. | |||||||
| E/A ratio | 1.7 | 0.9 | 4.654 | 3.495 | 0.592 | 5.813 | < 0.001 |
| hsTNT | 53.7 | 24.6 | 3.733 | 2.6 | 0.578 | 4.866 | < 0.001 |
| NT-proBNP (ng/mL) | 4,047.4 | 1,803.5 | 3.185 | 2.331 | 0.436 | 4.04 | < 0.001 |
| MCF (%) | 21.15 | 32.5 | -2.567 | -3.566 | 0.51 | -1.567 | < 0.001 |
| 6MWT (m) | 127 | 171 | -2.294 | -3.41 | 0.569 | -1.179 | < 0.001 |
| SVI (mL/m2) | 33.1 | 39.3 | -1.388 | -2.324 | 0.478 | -0.452 | 0.004 |
| Mitral annular S’ (cm/s) | 4.5 | 6.3 | -1.031 | -2.042 | 0.516 | -0.019 | 0.046 |
| Intercept | 0.224 | 0.005 | 0.111 | 0.442 | 0.045 | ||