Figures
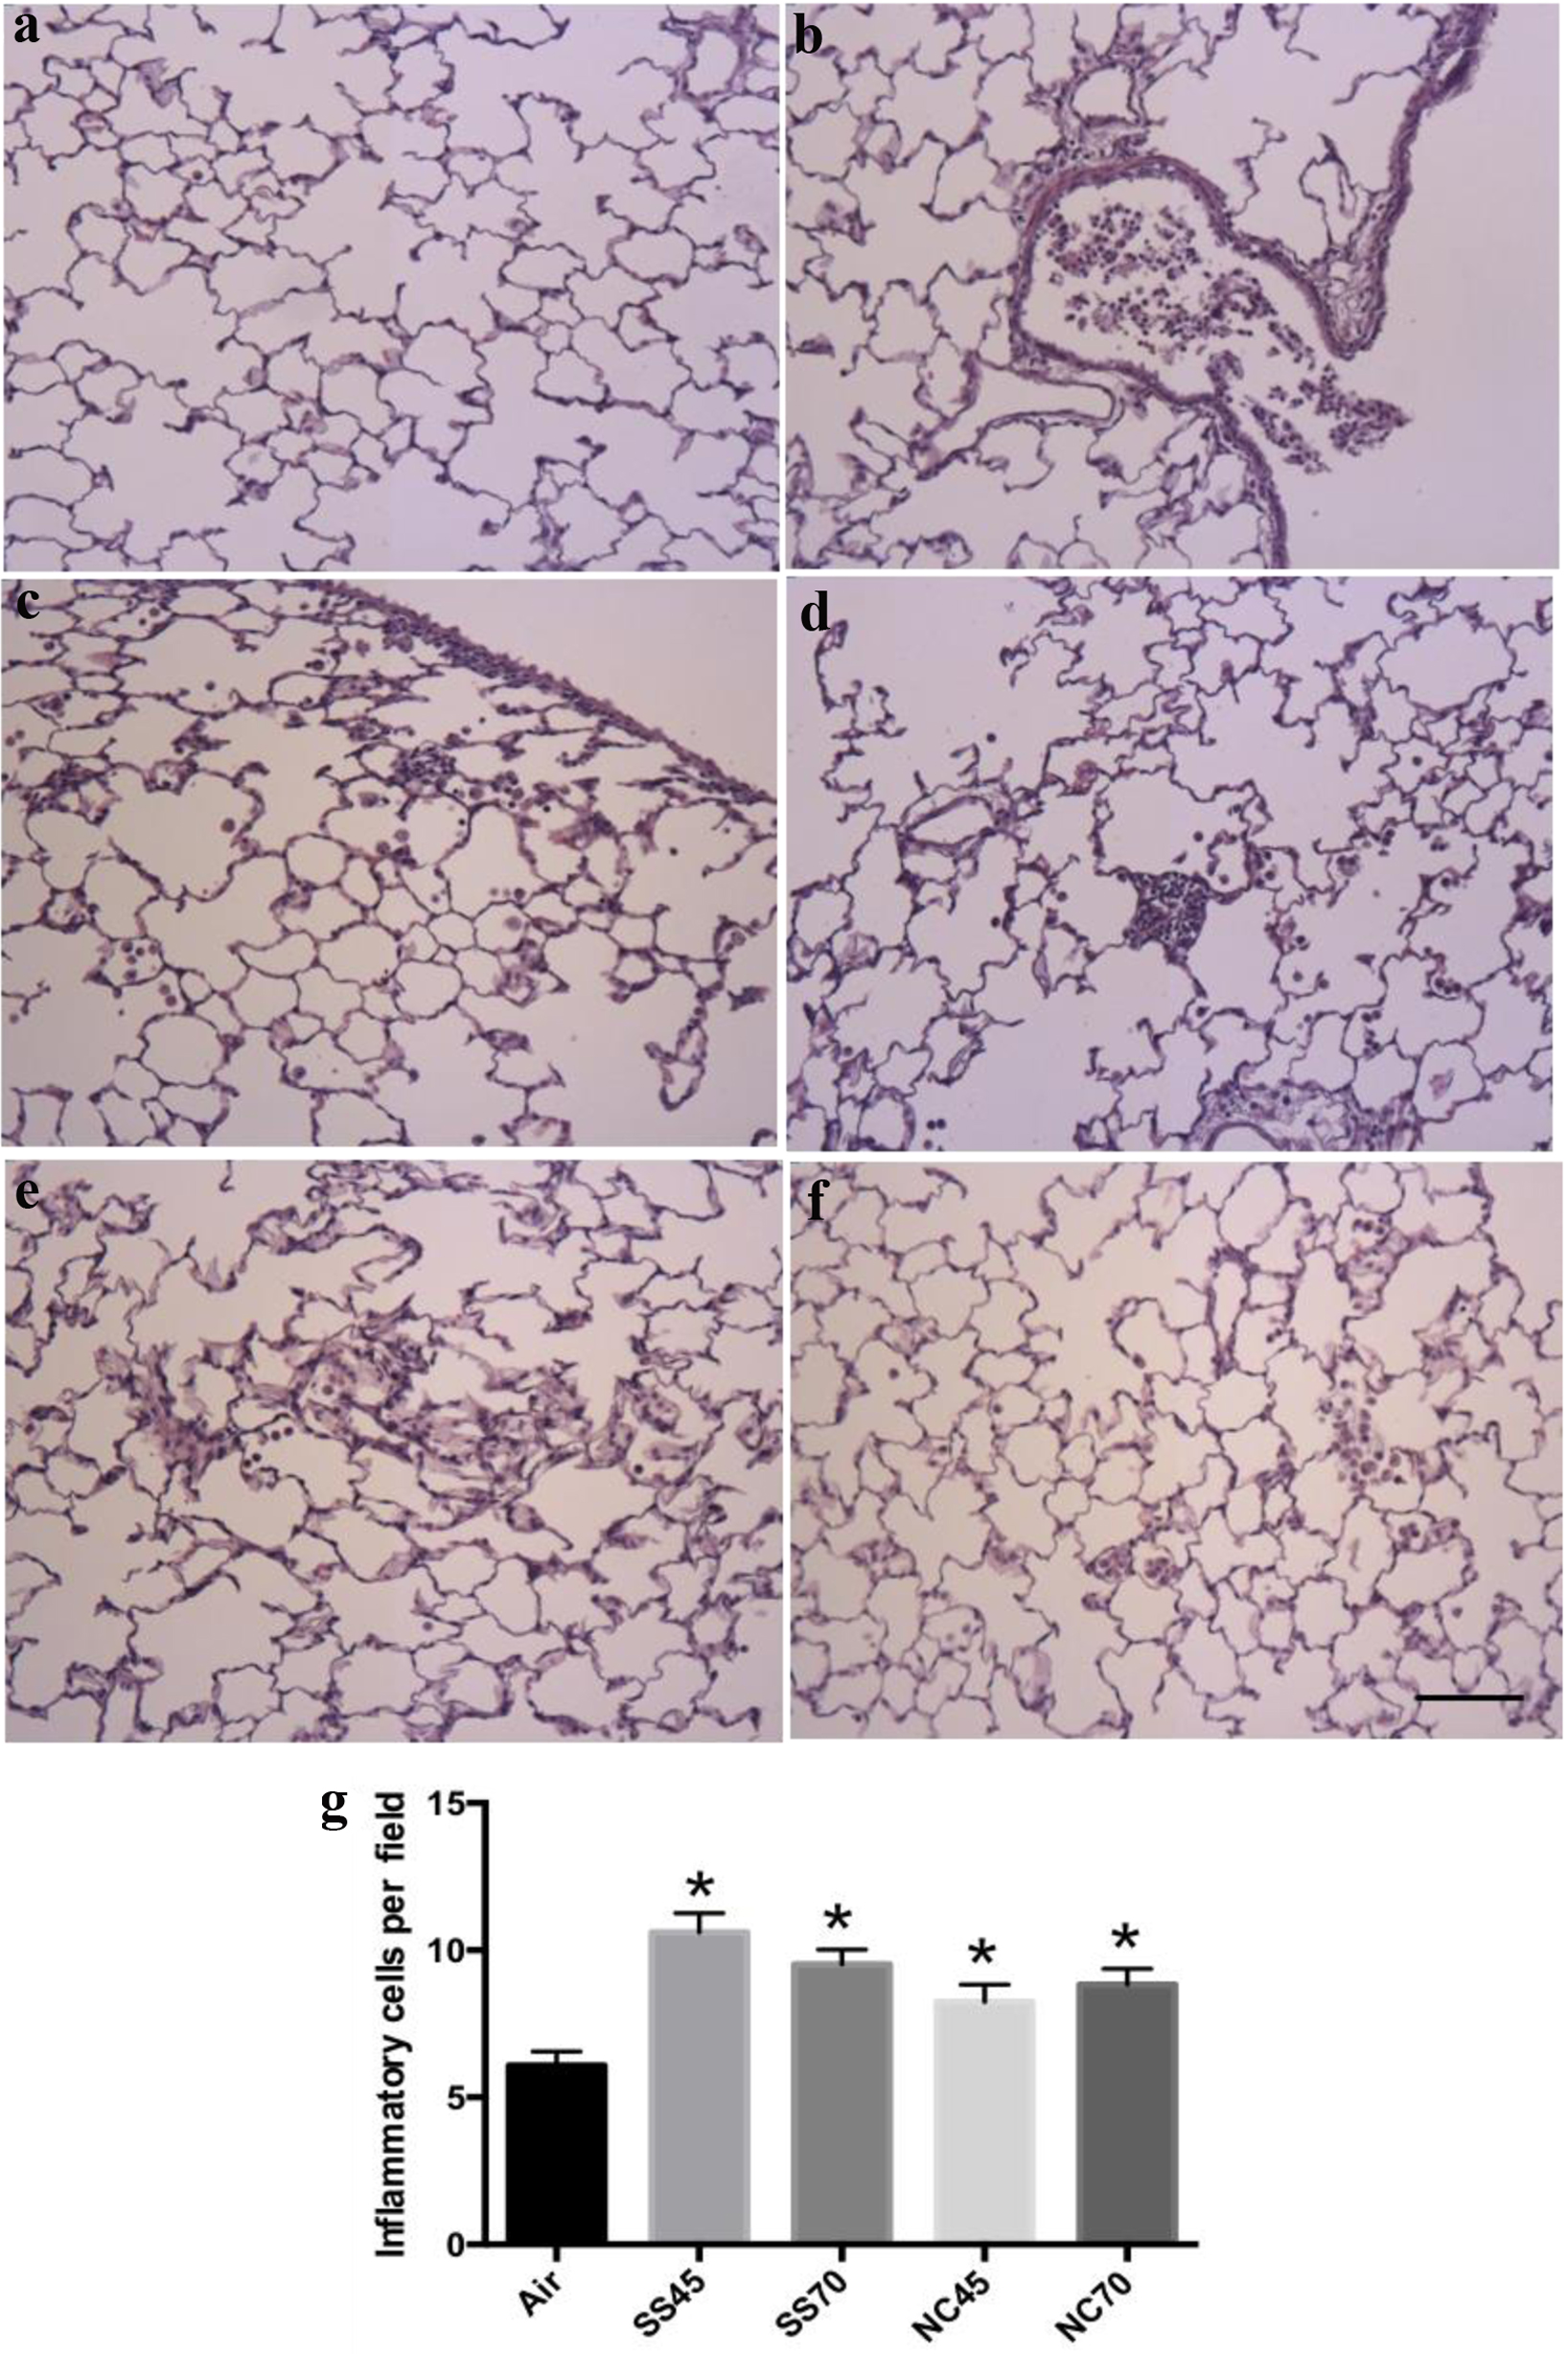
Figure 1. H&E staining of lung sections of rat models. (a) Alveoli from air rat, showing intact epithelial cells and thin alveolar walls. (b) Bronchus from eC exposed rats (SS45) shows accumulation of inflammatory cells in lumen. (c) Alveolar region of eC exposed rats (SS45) shows large accumulation of inflammatory cells near the pleura. (d) Alveolar region of eC exposed rats (SS70) shows accumulation of inflammatory cells. (e) Alveolar region of eC exposed rats (NC45) shows infiltration of inflammatory cells and intra-alveolar fluid. (f) Alveolar region of eC exposed rats (NC70) shows infiltration of inflammatory cells and intra-alveolar fluid (scale bar = 100 µm). (g) The numbers of inflammatory cells per field were significantly greater in the rats exposed to eC using NC or SS heating element compared to the air group (n = 16 in each group, P < 0.05, one-way ANOVA, Tukey test). The result was expressed as means ± SEM. H&E: hematoxylin and eosin; eC: electronic cigarette; SS: stainless steel; NC: nickel-chromium; ANOVA: analysis of variance; SEM: standard error of the mean. *P < 0.05 vs. air.
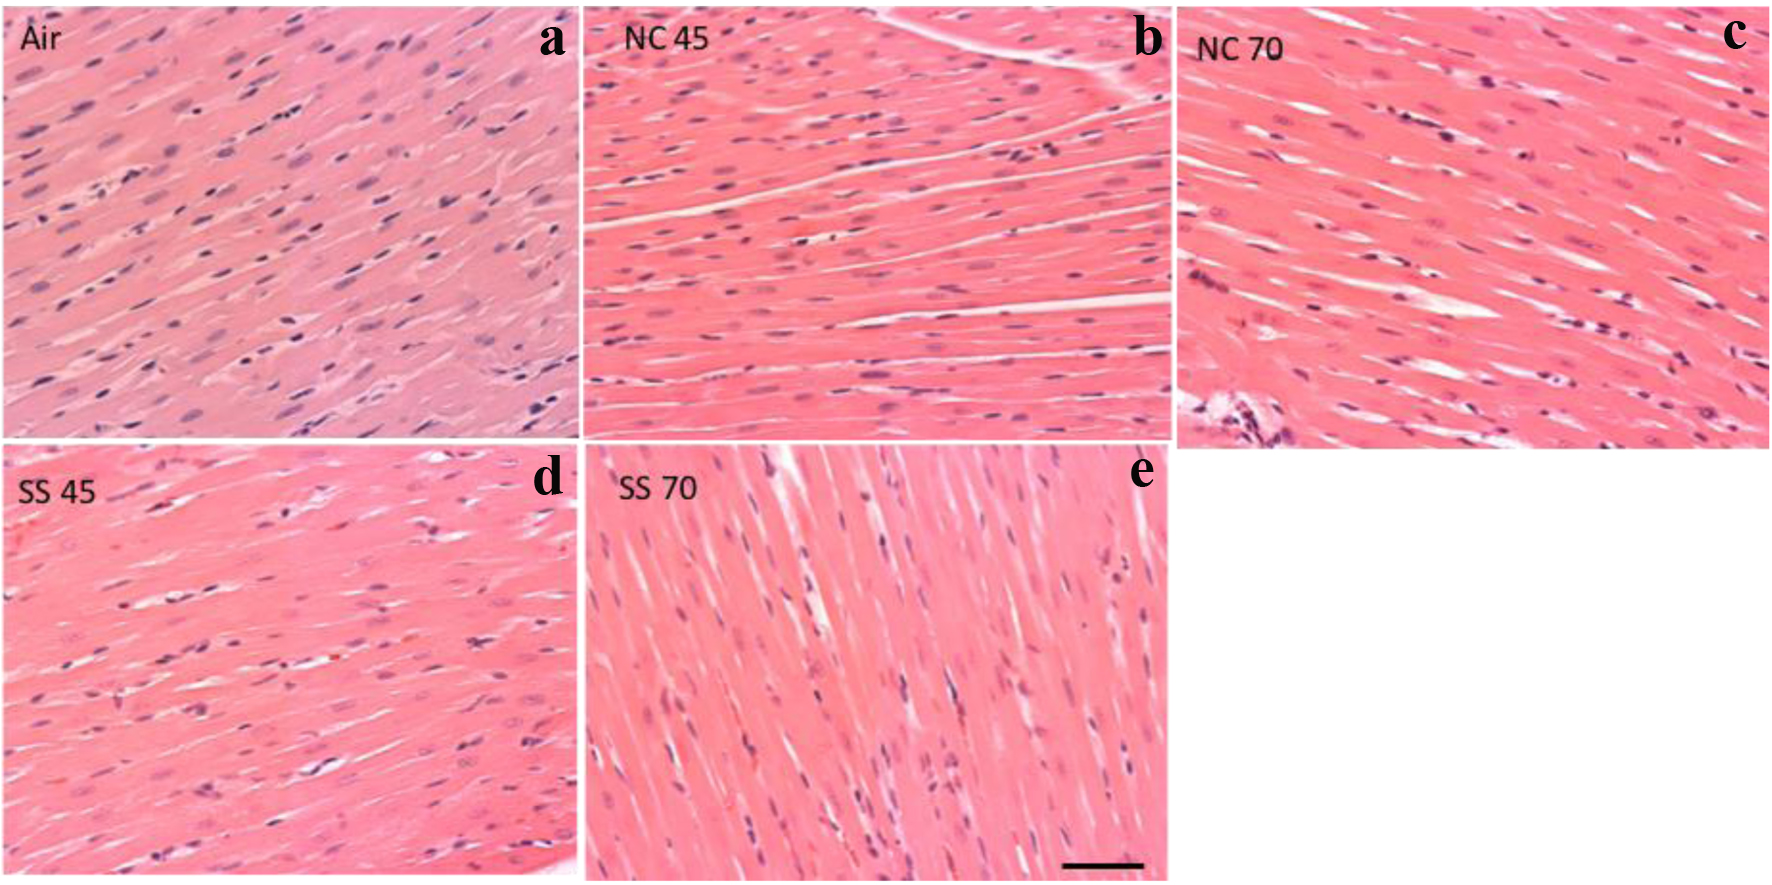
Figure 2. Cardiac tissue in H&E-stained hearts. Representative images of heart in air group (a), NC45 group (b), NC70 group (c), SS45 group (d), and SS70 group (e, scale bar = 50 µm). The heart tissue appears normal in all of these groups. H&E: hematoxylin and eosin; SS: stainless steel; NC: nickel-chromium.
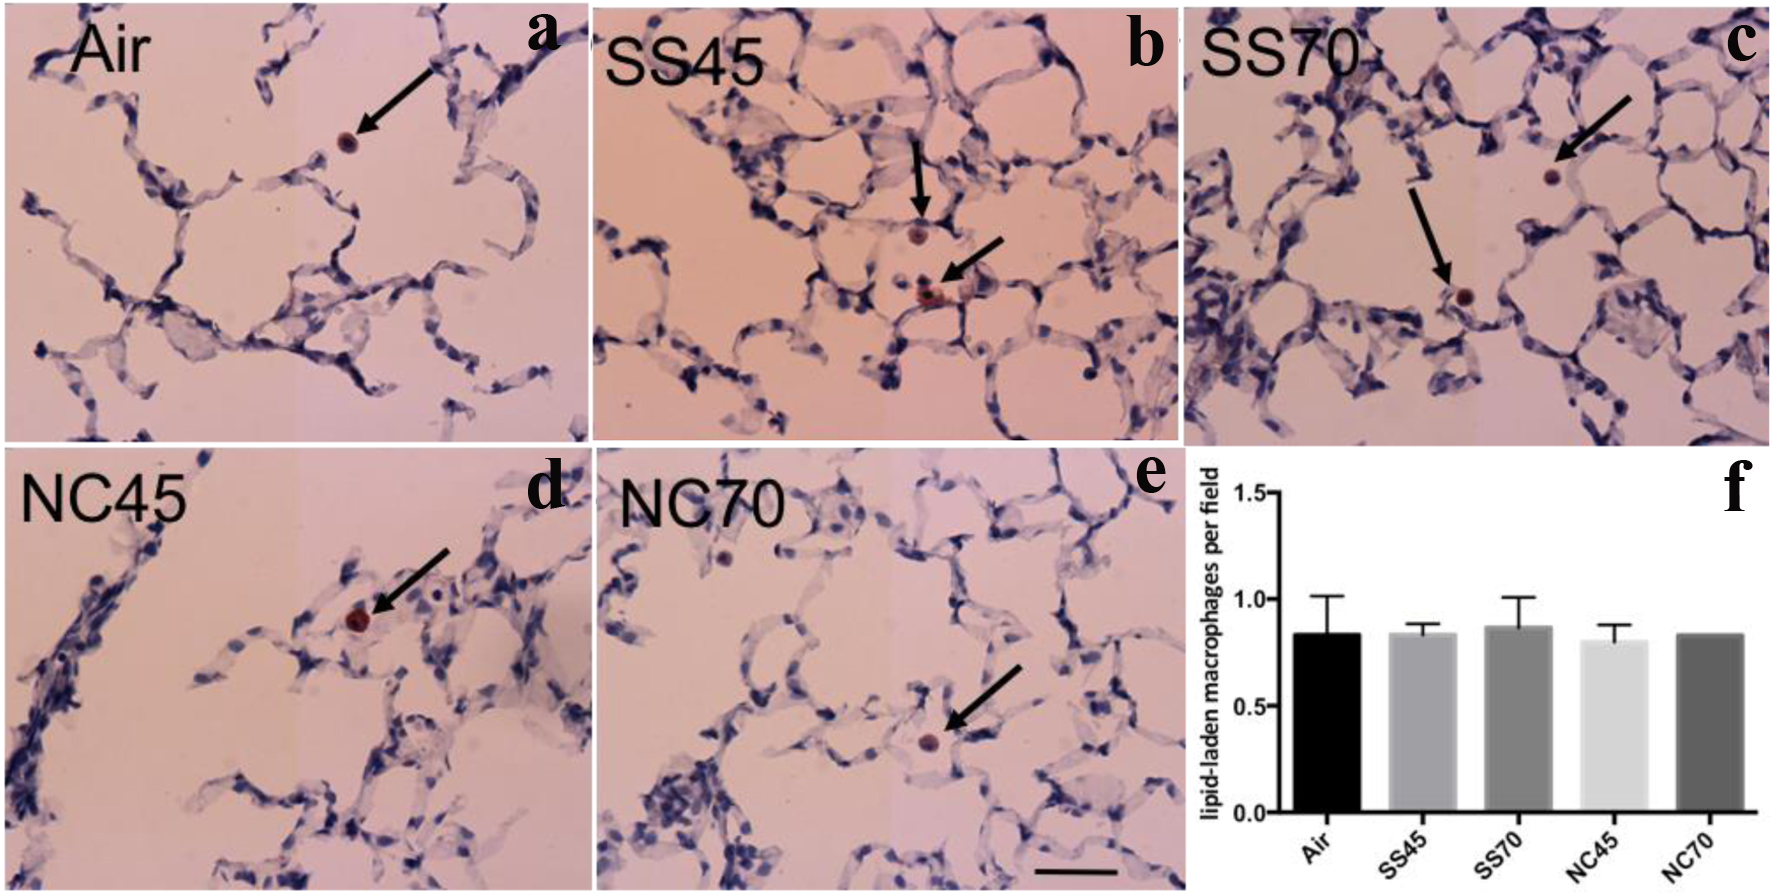
Figure 3. Lipid-laden macrophage in oil red O-stained lung. Representative images of lung: (a) air group, (b) SS45 group, (c) SS70 group, (d) NC45 group, (e) NC70 group and (f) the numbers of lipid-laden macrophage per field. Only occasional scattered, lipid-laden macrophages (red stain) were observed in these groups. There were no differences in the number of lipid-laden macrophage among any of the groups (n = 5 in each group). The result was expressed as means ± SEM. Scale bar = 50 µm. SS: stainless steel; NC: nickel-chromium; SEM: standard error of the mean.
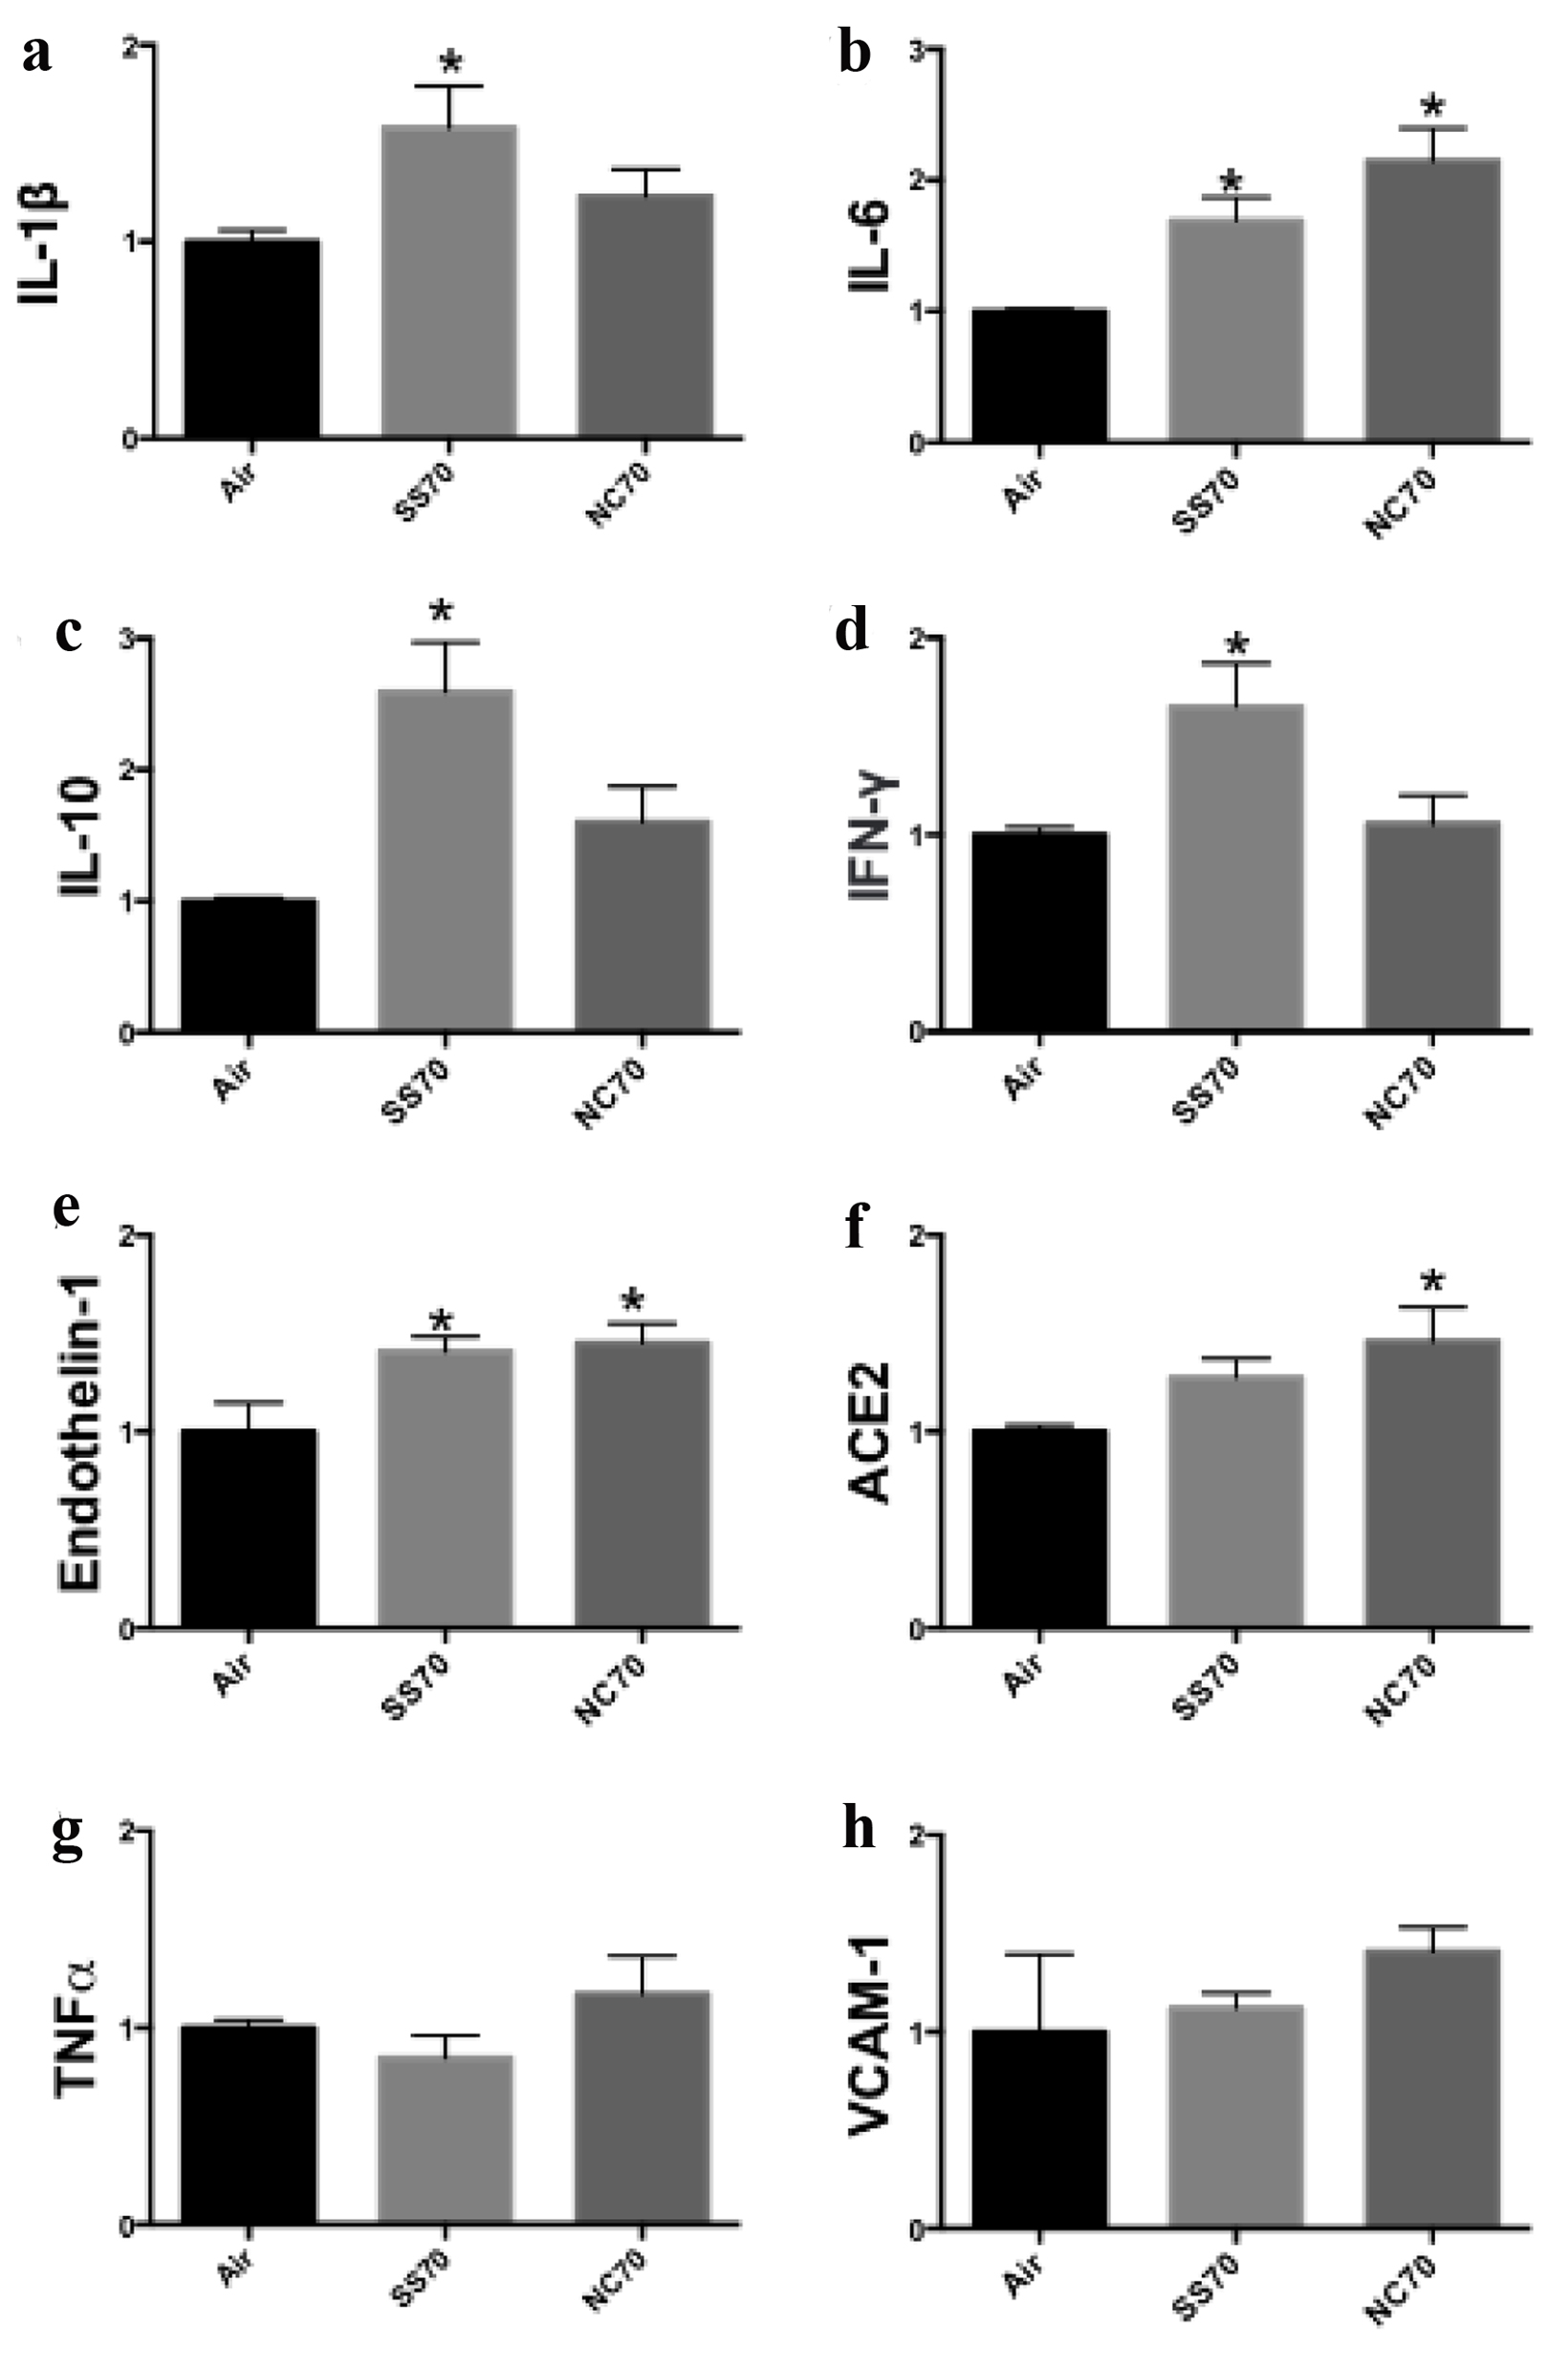
Figure 4. Gene analysis within lung tissue. qRT-PCR analysis (n = 4 to 16 in each group) for (a) IL-1β, (b) IL-6, (c) IL-10, (d) IFN-γ, (e) endothelin-1, (f) ACE2, (g) TNF-α and (h) VCAM-1 inflammatory gene expression in rats assigned to 70 W power. *P < 0.05 vs. air group. All data were normalized to GAPDH. qRT-PCR: quantitative reverse transcriptase polymerase chain reaction; IL: interleukin; IFN-γ: interferon gamma; ACE2: angiotensin converting enzyme 2; TNF-α: tumor necrosis factor-α; VCAM-1: vascular cell adhesion protein-1.
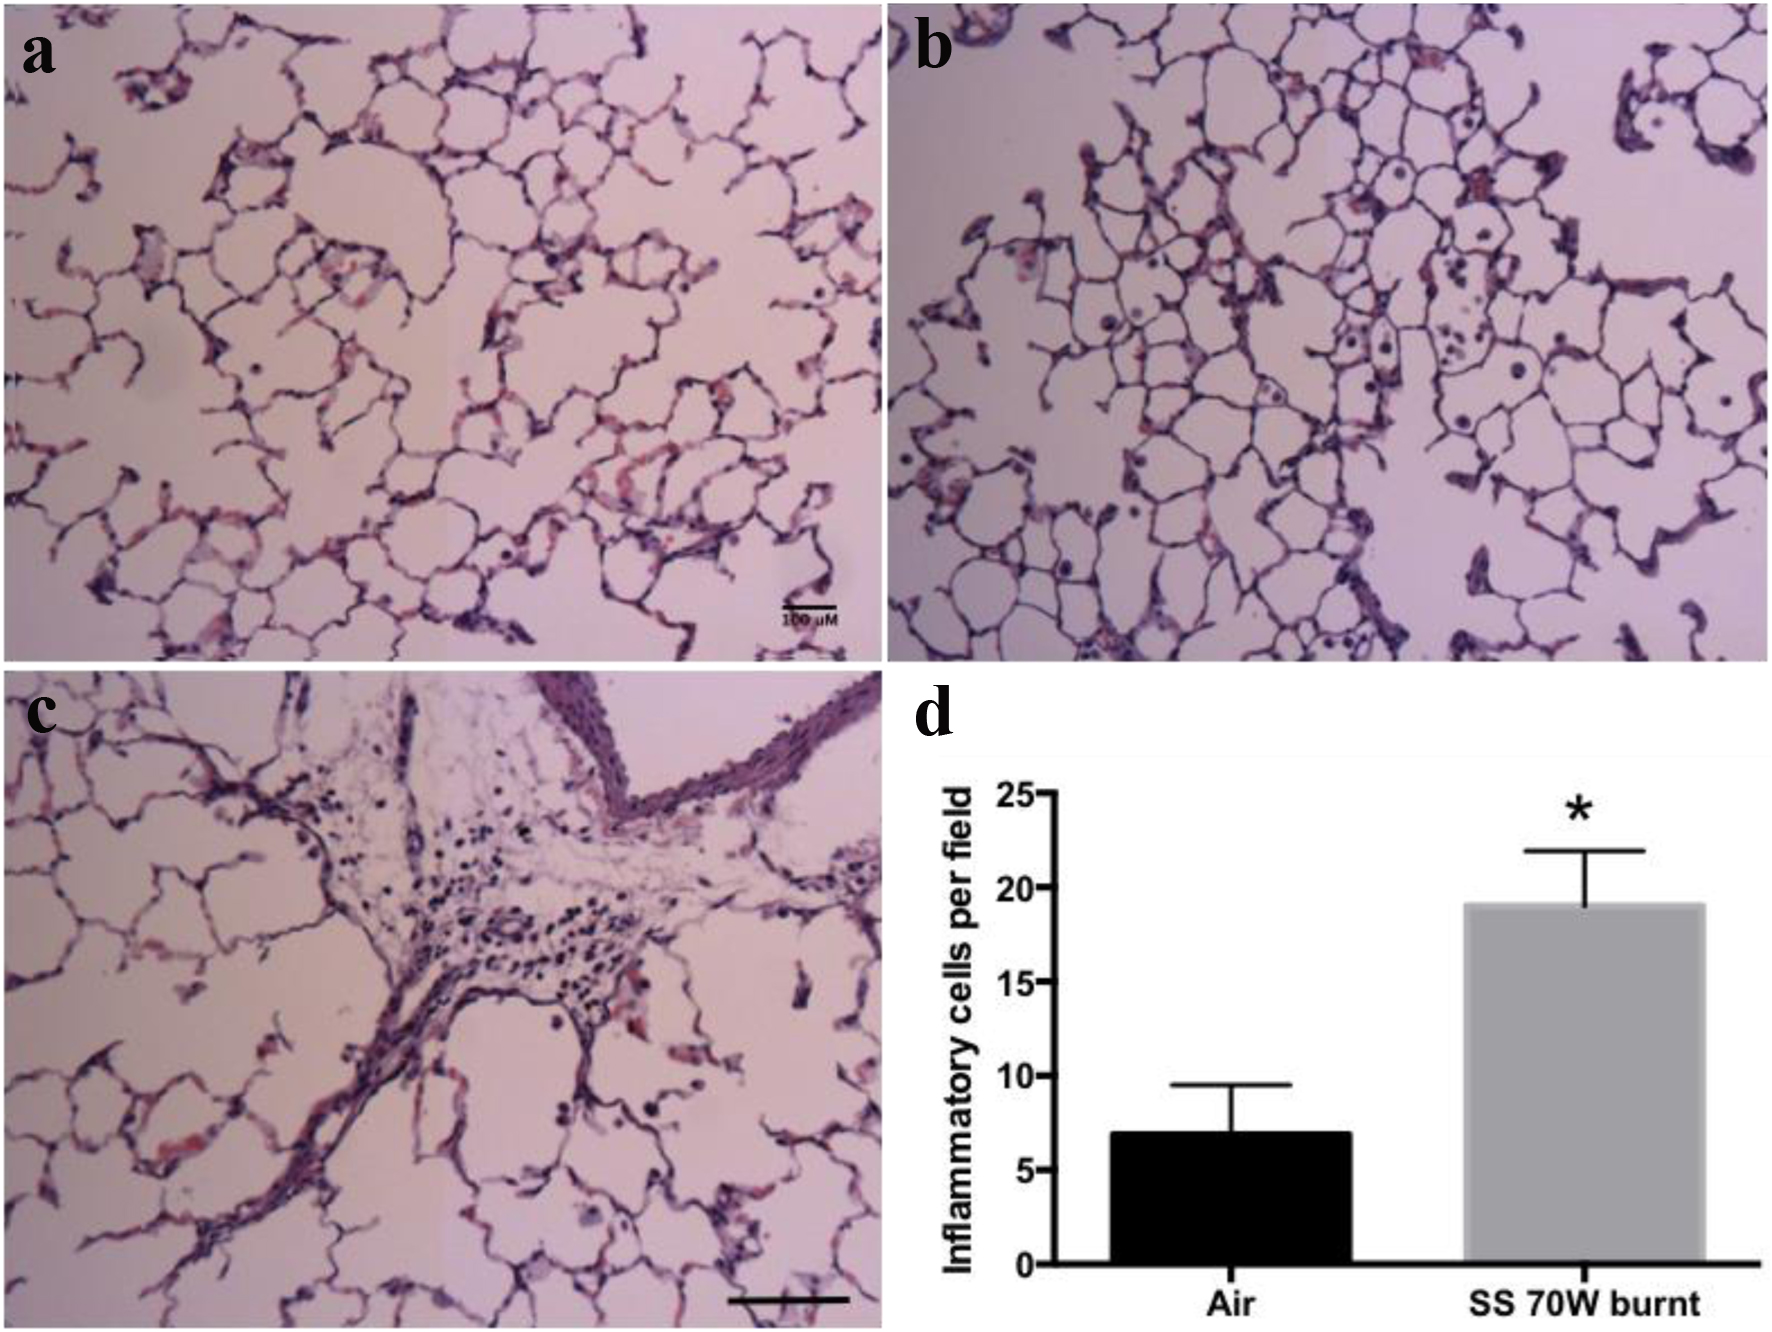
Figure 5. H&E staining of respiratory system sections of burnt coil rat models. (a) Alveoli from air control rat, showing intact epithelial cells and thin alveolar walls. (b) Alveolar region of an eC exposed rat using the SS heating element with a burnt coil showing infiltration of inflammatory cells inside alveoli. (c) An eC exposed rat using the SS heating element with burnt coil showing foci of inflammatory cell including neutrophil infiltration (scale bar = 100 µm). (d) The numbers of inflammatory cells per high power field in the lung parenchyma were significantly greater in the rats exposed to eC using SS heating element with burnt coil (19 ± 2.9, n = 4, randomly chosen) compared to the air group (6.9 ± 3.7, n = 2; P < 0.047). H&E: hematoxylin and eosin; eC: electronic cigarette; SS: stainless steel.
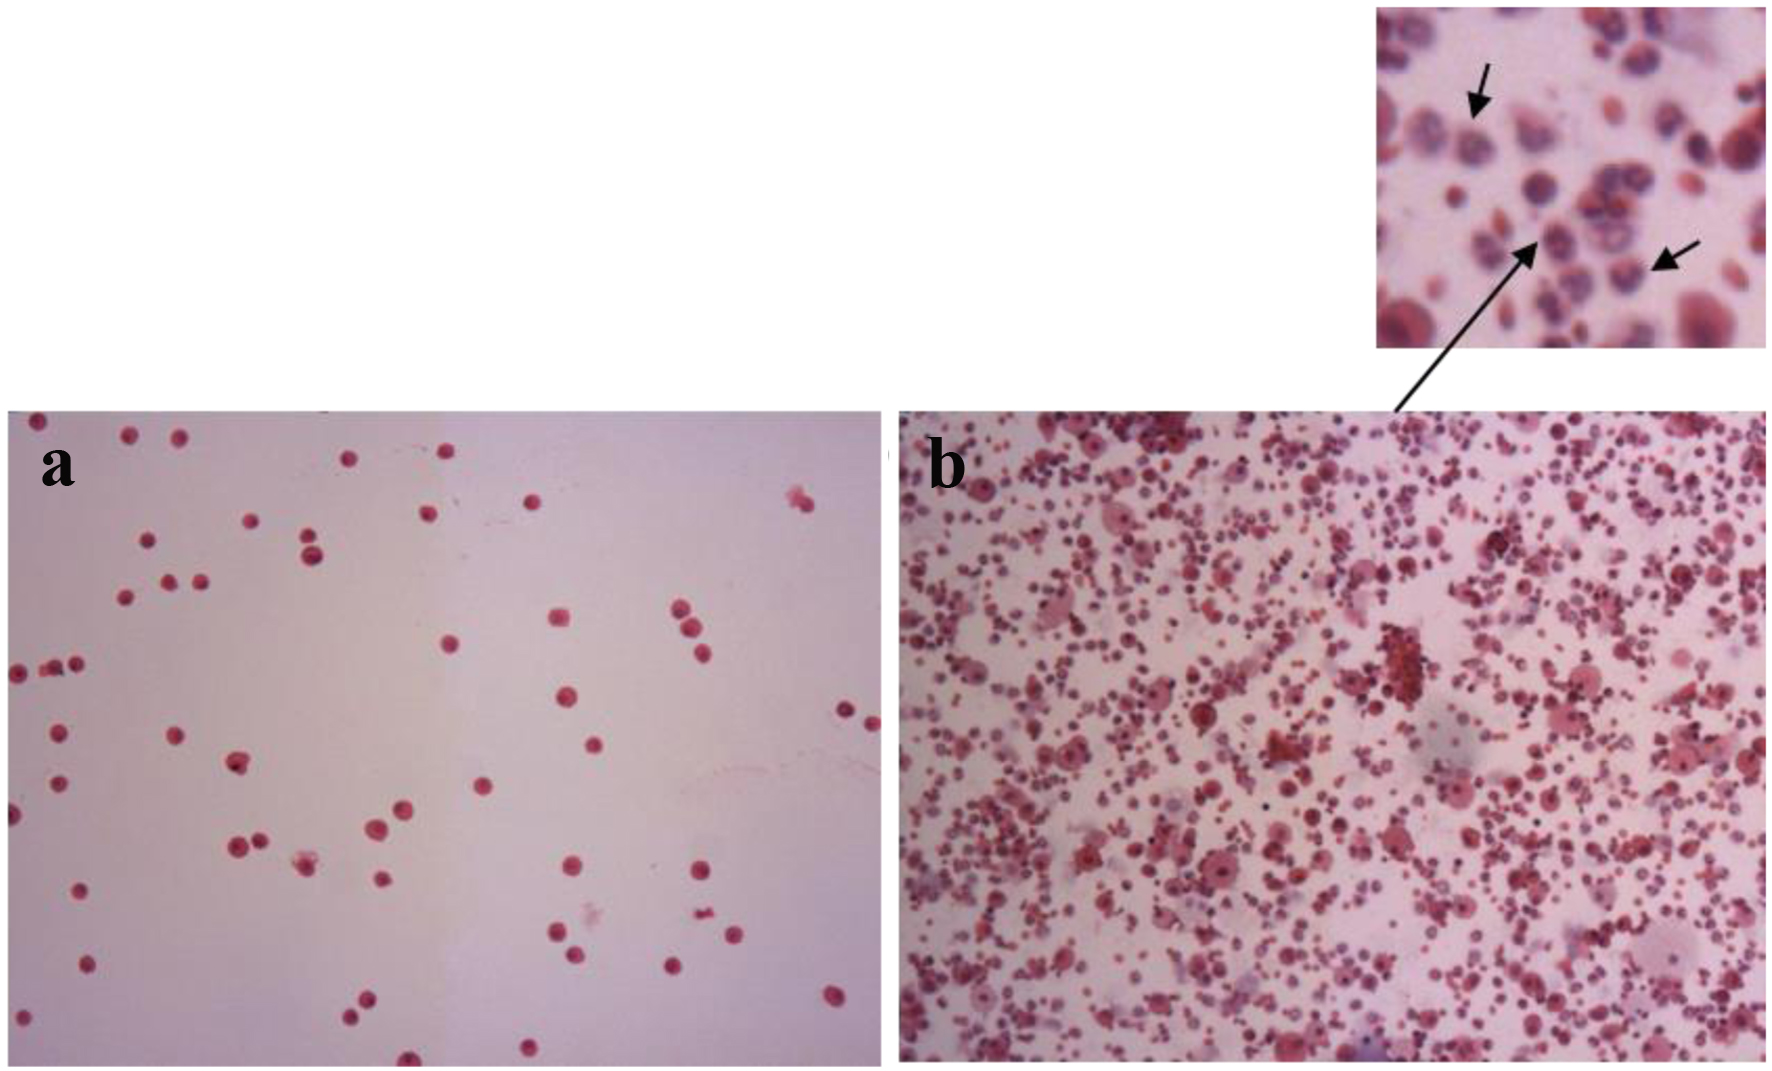
Figure 6. Cytology of bronchoalveolar lavage. Majority of the cells were macrophages in air group (a). The predominance of neutrophils (arrows) was observed in burnt coil rats (b).
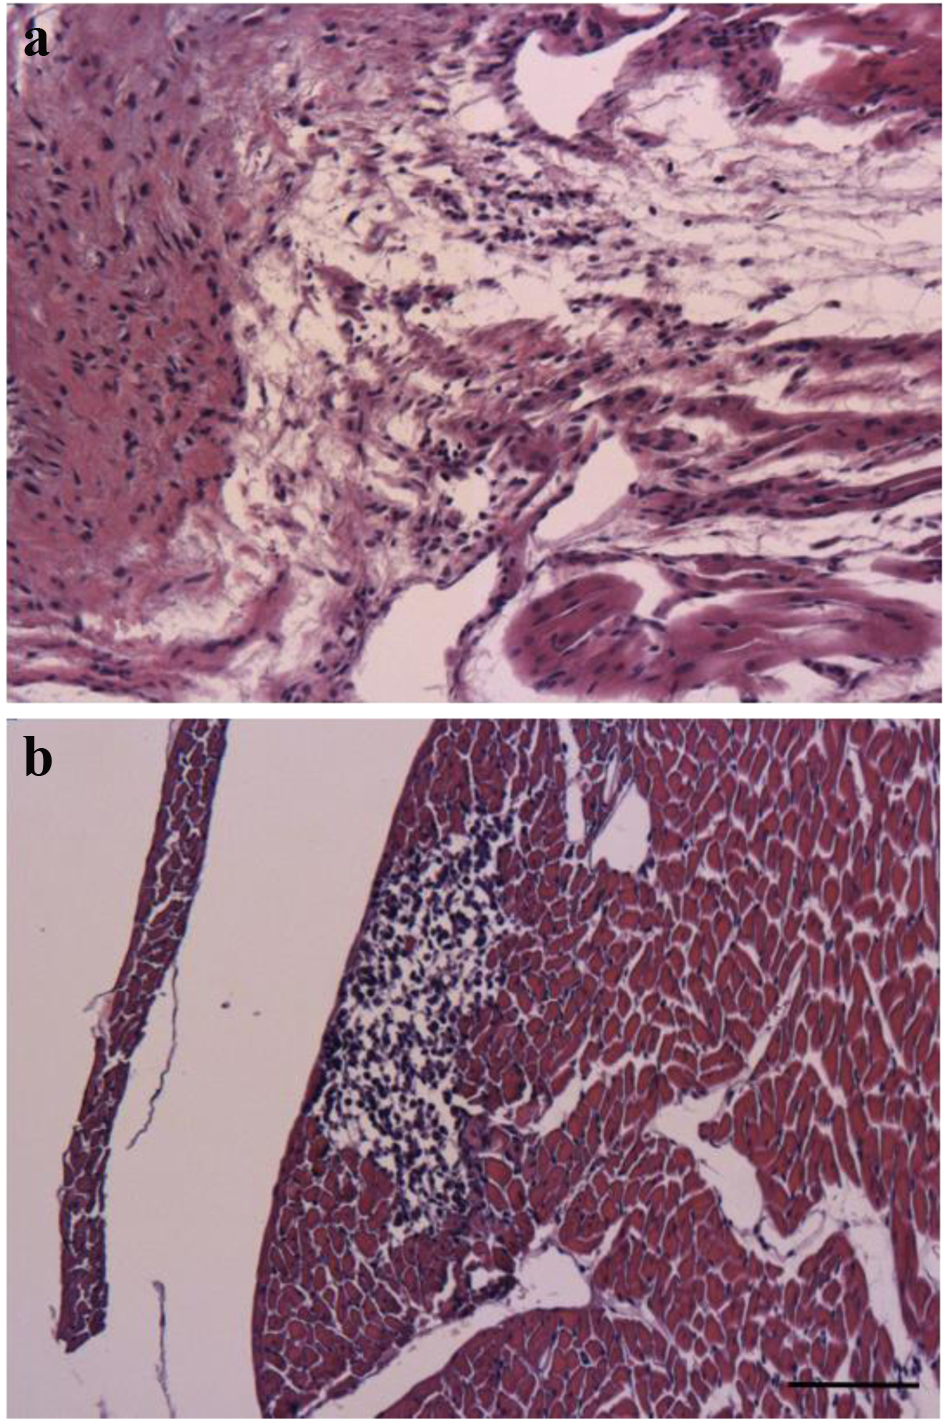
Figure 7. Representative images for the H&E-stained cardiac tissue. (a) Loss of the normal myocardial architecture and inflammatory cellular infiltration. (b) Focal inflammatory area (scale bar = 100 µm). H&E: hematoxylin and eosin.