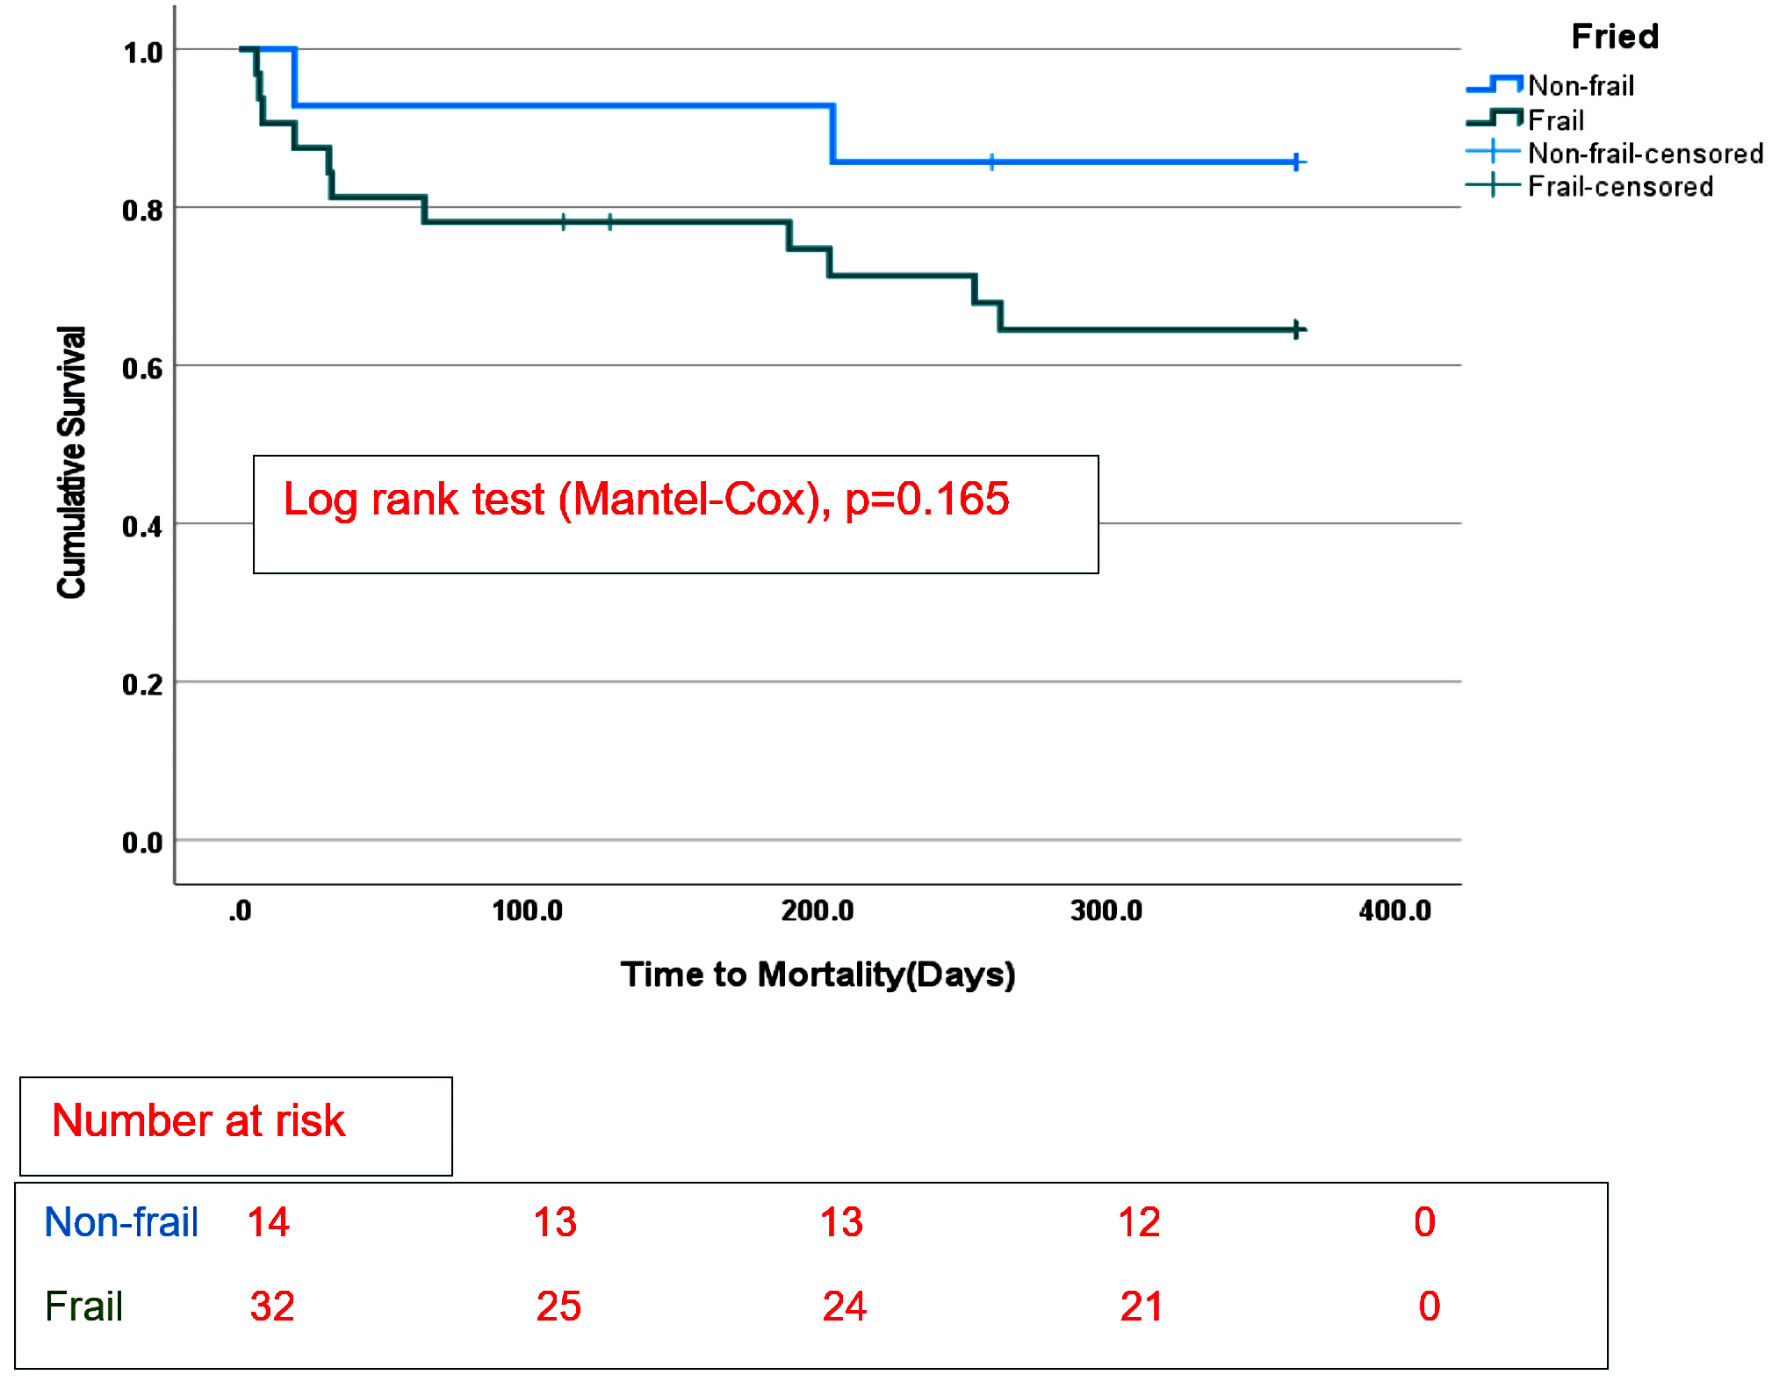
Figure 1. Survival categorized by frailty phenotype in the whole cohort with long-term mechanical circulatory support.
| Cardiology Research, ISSN 1923-2829 print, 1923-2837 online, Open Access |
| Article copyright, the authors; Journal compilation copyright, Cardiol Res and Elmer Press Inc |
| Journal website https://www.cardiologyres.org |
Original Article
Volume 13, Number 6, December 2022, pages 315-322
Impact of Fried Frailty Phenotype on Postoperative Outcomes After Durable Contemporary Mechanical Circulatory Support: A Single-Center Experience
Figures
Tables
| Variables | Total (n = 46) | Non-frail (n = 14) | Frail (n = 32) | P value |
|---|---|---|---|---|
| IQR: interquartile range; LVAD: left ventricular assist device; TAH: total artificial heart; LVEF: left ventricular ejection fraction; DM: diabetes mellitus; COPD: chronic obstructive pulmonary disease; CKD: chronic kidney disease; INTERMACS: Interagency Registry for Mechanically Assisted Circulatory Support; BTT: bridge to transplant; DT: destination therapy. | ||||
| Age (years), median (IQR) | 67 (60, 71) | 66 (55,73) | 68 (58, 71) | 0.867 |
| Gender, n (%) | 1.000 | |||
| Female | 8 (17%) | 2 (14%) | 6 (19%) | |
| Male | 38 (83%) | 12 (86%) | 26 (81%) | |
| Device type, n (%) | 0.651 | |||
| LVAD | 40 (87%) | 13 (93%) | 27 (84%) | |
| TAH | 6 (13%) | 1 (7%) | 6 (16%) | |
| Ischemic etiology, n (%) | 23 (50%) | 8 (57%) | 15 (47%) | 0.688 |
| LVEF (%), median (IQR) | 15 (10, 20) | 20 (10, 25) | 11 (10, 15) | 0.017 |
| Comorbidities, n (%) | ||||
| DM | 17 (37%) | 7 (50%) | 10 (31%) | 0.225 |
| COPD | 8 (17%) | 2 (14%) | 6 (19%) | 1.000 |
| Malignancy | 8 (17%) | 3 (21%) | 5 (16%) | 0.684 |
| Depression | 7 (15%) | 0 (0) | 7 (22%) | 0.083 |
| Obstructive sleep apnea | 7 (15%) | 2 (14%) | 5 (16%) | 1.000 |
| Atrial fibrillation | 21 (46%) | 6 (43%) | 15 (47%) | 0.801 |
| CKD | 16 (35%) | 1 (7%) | 15 (47%) | 0.016 |
| Lab parameters, median (IQR) | ||||
| Albumin (g/dL) | 3.6 (3.2, 4.0) | 4.0 (3.5, 4.2) | 3.5 (3.2, 3.7) | 0.021 |
| Prealbumin (mg/dL) | 15 (13, 19) | 15 (12, 21) | 15 (13, 18) | 0.867 |
| Total protein (g/dL) | 6.4 (5.9, 6.9) | 6.4 (5.7, 7.1) | 6.4 (6.0, 6.8) | 0.858 |
| Hemoglobin (g/dL) | 9.8 (8.7, 10.7) | 9.3 (8.5, 10.5) | 9.8 (8.5, 10.7) | 0.702 |
| INTERMACS profile (0 - 7) | 3.0 (2.8, 3.0) | 3.0 (2.8, 4.0) | 3.0 (2.3, 3.0) | 0.177 |
| Aim of surgery, n (%) | 0.497 | |||
| BTT | 14 (30%) | 3 (21%) | 11 (34%) | |
| DT | 32 (70%) | 11 (79%) | 21 (66%) | |
| Postoperative variables | Total (n = 46) | Non-frail (n = 14) | Frail (n = 32) | P value |
|---|---|---|---|---|
| Drive-line infections | 6 (16%) | 4 (31%) | 2 (8%) | 0.154 |
| Gastrointestinal bleeding | 8 (21%) | 2 (16%) | 6 (24%) | 0.689 |
| Pump thrombosis | 2 (5%) | 0 (0) | 2 (8%) | 0.538 |
| Neurological events | 7 (18%) | 3 (23%) | 4 (16%) | 0.672 |