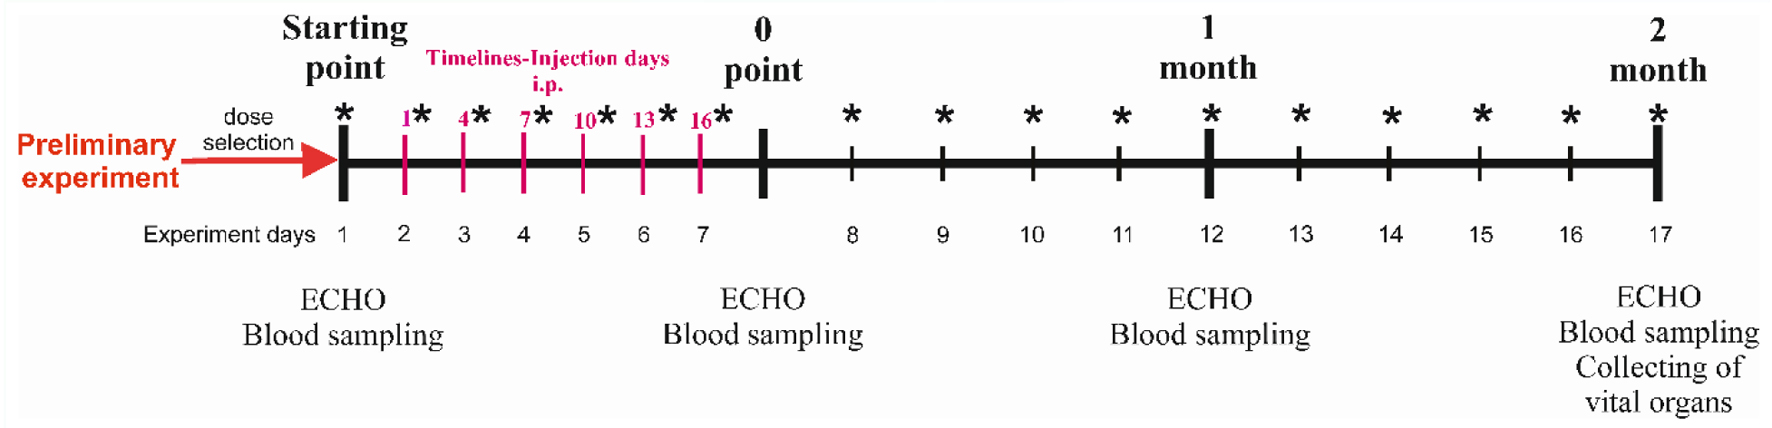
Figure 1. Experiment scheme. *Weighing points. IP: intraperitoneally.
| Cardiology Research, ISSN 1923-2829 print, 1923-2837 online, Open Access |
| Article copyright, the authors; Journal compilation copyright, Cardiol Res and Elmer Press Inc |
| Journal website https://www.cardiologyres.org |
Original Article
Volume 13, Number 6, December 2022, pages 339-356
Modeling Doxorubicin-Induced Cardiomyopathy With Fibrotic Myocardial Damage in Wistar Rats
Figures
Tables
| Group, n | The route of administration | Dose | Frequency of administration | Cumulative dose |
|---|---|---|---|---|
| IP: intraperitoneally. | ||||
| The first stage - modeling of acute doxorubicin cardiomyopathy | ||||
| DOX-25 (n = 10) | IP | 2.5 mg/kg | Ten times over 1.5 weeks given every day | 25 mg/kg |
| DOX-20.4 (n = 10) | IP | 3.4 mg/kg | Six times over 1.5 weeks given every other day | 20.4 mg/kg |
| DOX-15 (n = 10) | IP | 2.5 mg/kg | Six times over 1.5 weeks given every other day | 15 mg/kg |
| Control (n = 5) | IP | 1 mL 0.9% sodium chloride | Six times over 1.5 weeks given every other day | 6 mL |
| The second stage - modeling of chronic doxorubicin cardiomyopathy | ||||
| DOX-15 (n = 10) | IP | 2.5 mg/kg | Six times over 2.5 weeks given in 2 days | 15 mg/kg |
| DOX-10 (n = 10) | IP | 1.67 mg/kg | Six times over 2.5 weeks given in 2 days | 10 mg/kg |
| DOX-5 (n = 10) | IP | 0.83 mg/kg | Six times over 2.5 weeks given in 2 days | 5 mg/kg |
| Control (n = 10) | IP | 1 mL 0.9% sodium chloride | Six times over 2.5 weeks given in 2 days | 6 mL |
| Genes | Primers | Sequences (5'-3') |
|---|---|---|
| α-SMA: alpha-smooth muscle actin; MMP: matrix metalloproteinases; TIMP: tissue inhibitor of metalloprotease; TGF: transforming growth factor; FGF: fibroblast growth factors; TNF: tumor necrosis factor; RT-qPCR: reverse transcription quantitative real time polymerase chain reaction. | ||
| ACTA (α-SMA) | Forward | CACCGCTGAACGTGAAATTG |
| Reverse | CTTCTCCAGAGAGGAGGAAG | |
| TGF-β1 | Forward | GACTCTCCACCTGCAAGACC |
| Reverse | GGACTGGCGAGCCTTAGTTT | |
| FGF2 | Forward | TCCATCAAGGGAGTGTGTGC |
| Reverse | TCCGTGACCGGTAAGTGTTG | |
| FGF4 | Forward | CTACCTGCTGGGCCTCAAAA |
| Reverse | CACACCCCGCTGCTGTC | |
| Col1a1 | Forward | GTGGATGGCTGCACGAGTC |
| Reverse | GAGTTTGGGTTGTTGGTCTG | |
| Col2a1 | Forward | GCTGTGGAAGTGGATGAAGA |
| Reverse | GAGGAACTGTGGAGAGACG | |
| Col3a1 | Forward | CAGGCCAATGGCAATGTAAAG |
| Reverse | CATCCTCTAGAACTGTGTAAG | |
| TNF-α | Forward | GGCTCCCTCTCATCAGTTC |
| Reverse | CTGCTTGGTGGTTTGCTAC | |
| ET-1 (endothelin-1) | Forward | TGATTCTCTTGCCTCTTCTTG |
| Reverse | TATGGAATCTCCTGGCTCTC | |
| TIMP-1 | Forward | CTGAGAAGGGCTACCAGAG |
| Reverse | GTCATCGAGACCCCAAGGT | |
| TIMP-2 | Forward | GGACCTGACAAGGACATCG |
| Reverse | TTCTTTCCTCCAACGTCCAG | |
| MMP-1 | Forward | GATGAAAGGTGGACCAACAAT |
| Reverse | CCAAGAGAATGGCCGAGTTC | |
| MMP-2 | Forward | TGGGGGAGATTCTCACTTTG |
| Reverse | CCATCAGCGTTCCCATACTT | |
| MMP-14 | Forward | TGGGGTCATCTGCTTCTCTT |
| Reverse | TAGGGCTCATATGCCCAAAG | |
| Housekeeping genes | Primers | Sequences (5'- 3') |
| GAPDH | Forward | CAAGTTCAACGGCACAGTCA |
| Reverse | CATACTCAGCACCAGCATCA | |
| α-tubulin | Forward | CAATTCCATCCTCACCACC |
| Reverse | CAACCTGTTTAAGTTAGTGTAG | |
| TBP (TATA-box binding protein) | Forward | TGCGTTGATCTTCAGTTCTG |
| Reverse | CTTGCTGCTAGTCTGGATTG | |
| ACTB (β-actin) | Forward | GGTGTGATGGTGGGTATGG |
| Reverse | GTTGGTGACAATGCCGTGTT | |
| Time | Groups | |||
|---|---|---|---|---|
| DOX-15 | DOX-10 | DOX-5 | Control | |
| *DOX-15, DOX-10, DOX-5 vs. control (*P < 0.05, **P < 0.01, ***P < 0.001). GR: granulocytes; Hb: hemoglobin; Hct: hematocrit; Lym: lymphocytes; MCH: mean concentration hemoglobin; MCHC: mean corpuscular hemoglobin concentration; MCV: mean corpuscular volume; Mi: monocytes; Plt: platelets; RBCs: red blood cells; WBCs: white blood cells. | ||||
| WBCs, × 109 g/L | ||||
| Starting point | 9.4 (7.8 - 13.7) | 13.3 (7.7 - 17.3) | 10.7 (7.6 - 12.7) | 9.1 (8.2 - 12.9) |
| 0 point | 6.1 (4.7 - 7.4)** | 10.3 (7.4 - 11.7) | 7.9 (5.7 - 10.1) | 12.2 (9.5 - 13.6) |
| First month | 11.4 (7.7 - 15.5) | 13.8 (13 - 14.9) | 12.7 (10.3 - 12.8) | 10.3 (8.5 - 13.3) |
| Second month | 6.3 (4.1 - 7.1) | 6.9 (4.9 - 11.3) | 7.9 (6.3 - 9.5)* | 11.2 (3.8 - 6.3) |
| Lym, × 109 g/L | ||||
| Starting point | 7.1 (4.8 - 7.9) | 6.2 (5 - 8.9) | 8.1 (6.2 - 8.2) | 7.1 (6.3 - 7.8) |
| 0 point | 3.8 (3 - 7.5)** | 6.9 (5.3 - 7.9) | 5.6 (4.7 - 7.8) | 8.9 (7.3 - 9.8) |
| First month | 6.8 (5.9 - 8.4) | 10.5 (8.7 - 11.7) | 10 (7.2 - 10.9) | 7.9 (6.6 - 10.1) |
| Second month | 3.1 (2.8 - 6) | 5.7 (3.8 - 7.4) | 5.6 (4.2 - 7.1) | 7.6 (2.8 - 4.4) |
| Mi, % | ||||
| Starting point | 8.9 (7 - 10.3) | 4.0 (0.5 - 9.9) | 7.5 (0.6 - 13) | 1.4 (0.6 - 8.1) |
| 0 point | 0.7 (0.6 - 2.6) | 0.6 (0.6 - 0.7)** | 3.1 (0.6 - 5.4) | 4.4 (2.9 - 7) |
| First month | 9 (3 - 11.4) | 4.4 (1.2 - 12.3) | 4.2 (3 - 12) | 3.8 (3.2 - 10.4) |
| Second month | 2.8 (1.9 - 9.5) | 7.3 (3.1 - 9.7) | 4.9 (2.8 - 9.8) | 8.7 (6.4 - 9.8) |
| GR, % | ||||
| Starting point | 20.9 (18.3 - 24.5) | 14.2 (13.4 - 21.1) | 14.2 (8.5 - 18.8) | 13.3 (9.2 - 18.8) |
| 0 point | 29.8 (24.1 - 35.8) | 26.7 (20.6 - 31.3) | 17.5 (14.5 - 20.4) | 19.6 (16.3 - 23.8) |
| First month | 19 (17.6 - 38.8) | 17.9 (15.8 - 21.6) | 16.4 (10.4 - 20) | 15.4 (14.3 - 19.1) |
| Second month | 12.7 (9.2 - 39.3) | 16.8 (14.1 - 19.4) | 22.80 (18.1 - 25.5) | 24.85 (20.5 - 28.6) |
| RBCs, 1012/L | ||||
| Starting point | 8.3 (7.4 - 8.9) | 8 (7.9 - 8.5) | 9.6 (8.7 - 9.9) | 9.4 (8.7 - 9.7) |
| 0 point | 8.6 (8.1 - 9.3) | 9.6 (9.2 - 10.6) | 8.8 (8.4 - 9.1) | 8.7 (8.2 - 9.3) |
| First month | 8.1 (7.7 - 8.5) | 8.2 (6.9 - 8.8) | 9.7 (9.4 - 10.6) | 8.6 (8.3 - 9.6) |
| Second month | 7.7 (6.8 - 8.8) | 8 (7.6 - 8.7) | 7.9 (7.7 - 8.2) | 7.5 (7.2 - 7.7) |
| Hb, g/L | ||||
| Starting point | 174 (156 - 189) | 166 (160 - 170.5) | 168.5 (157.5 -173.8) | 167 (158.5 - 170.3) |
| 0 point | 134 (128.3 -139.8)** | 161 (154 - 165) | 161 (155 - 164.3) | 169 (162 - 172) |
| First month | 169 (164 - 183.5) | 177 (169 - 189.5) | 169 (164 - 171) | 168 (165.5 - 178.3) |
| Second month | 154 (134 - 190.5) | 170 (166 - 176.5)* | 155.5 (152 - 160.8) | 156 (150.8 - 160) |
| Hct, % | ||||
| Starting point | 43.4 (38.85 - 45.47) | 40.9 (39.66 - 45.82) | 46.9 (44.8 - 48.7) | 44.2 (41.8 - 46.6) |
| 0 point | 42.5 (40.2 - 47.3) | 48.8 (46.8 - 49.2) | 40.1 (37.5 - 42.7) | 42.7 (39.1 - 44.9) |
| First month | 39.5 (38.2 - 42.2) | 41.9 (39.5 - 45.4) | 47.9 (45.8 - 50.4) | 40.4 (38.7 - 44.9) |
| Second month | 34.5 (29.2 - 43.7) | 38.1 (36.7 - 39.9)** | 35.2 (34.8 - 36.1) | 41.1 (33.4 - 35.3) |
| MCV, fL | ||||
| Starting point | 52 (51 - 52) | 51 (50 - 54) | 47.5 (46.7 - 51.) | 48 (47 - 49) |
| 0 point | 50 (50 - 50.7) | 51 (48 - 51.5) | 45 (45 - 45.7) | 48 (46 - 50) |
| First month | 50 (46.5 - 51.5) | 50 (47.7 - 53) | 48 (47 - 50) | 47 (46.2 - 49.5) |
| Second month | 46 (42.5 - 50) | 47.5 (46 - 51) | 44.5 (42.7 - 45) | 46 (45 - 46) |
| MCH, pg | ||||
| Starting point | 21 (21 - 21.2) | 20.2 (19.3 - 21.3) | 17 (16 - 18.6) | 17.9 (16.6 - 19.2) |
| 0 point | 15.6 (14.4 -17.4)** | 16.9 (14.7 - 18.2)* | 18.1 (17.6 - 18.9) | 19.2 (18.3 - 19.8) |
| First month | 21.2 (20.3 - 21.9) | 21.8 (20.5 - 22.1)* | 17 (16 - 17.7) | 19.3 (18.4 - 19.9) |
| Second month | 20.6 (19.4 - 21.7) | 21.7 (20.3 - 22) | 19.6 (19.4 - 19.4)* | 20.6 (20.3 - 21.7) |
| MCHC, g/L | ||||
| Starting point | 406 (401 - 412) | 406 (357 - 422) | 363 (340 - 373.8) | 384 (343 - 399.5) |
| 0 point | 307.5 (292.3 -350.3)* | 327 (306.5 - 349.5) | 392 (383 - 403) | 395.5 (368 - 403.8) |
| First month | 437 (424.5 - 443.5) | 423 (414.8 - 428) | 351 (340 - 357) | 411.5 (364.3 - 430) |
| Second month | 445 (435.5 - 457.5) | 446.5 (437.3 - 459.3) | 445.5 (439.3 -455.8) | 453.5 (446.5 - 462.5) |
| Plt, 109 g/L | ||||
| Starting point | 579 (566 - 649) | 628 (572 - 820) | 775.5 (689 - 862) | 785.5 (785 - 786) |
| 0 point | 1,722 (1,358 -1,816)*** | 967 (852 - 1,051) | 709.5 (654.5 -746.3) | 644 (483 - 659.5) |
| First month | 497.5 (409.8 - 626) | 558 (510.3 - 681) | 727 (593 - 820) | 687 (531 - 731) |
| Second month | 512 (437 - 643) | 569 (482 - 592.8) | 550 (479.5 - 567.5) | 580 (564 - 616.8) |