Figures
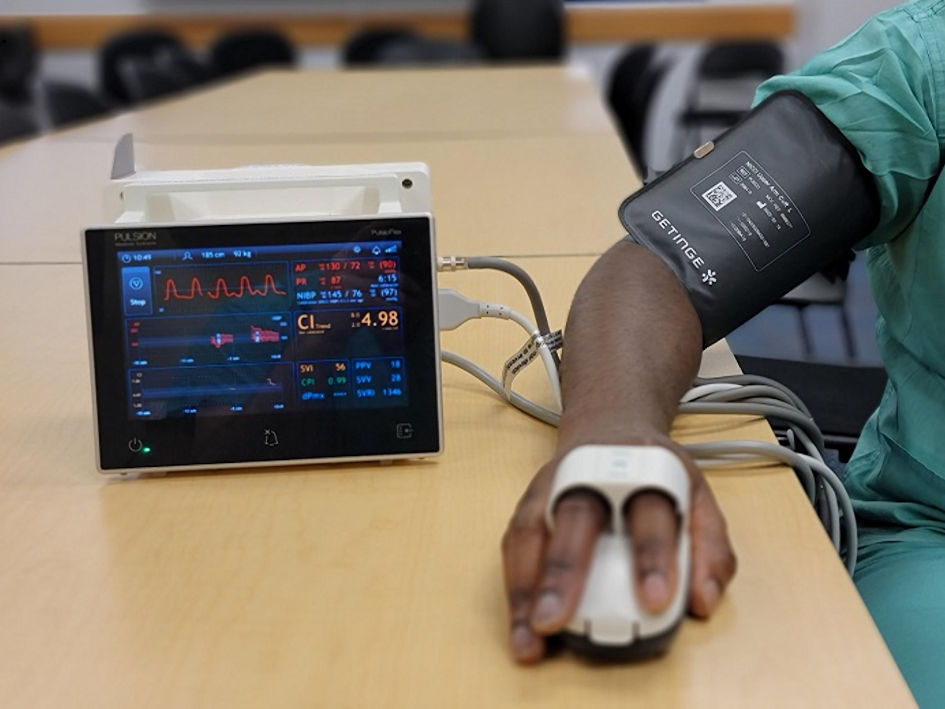
Figure 1. The NICCI device with the calibrating noninvasive blood pressure cuff and finger cuffs in place. The inflation of the two finger cuffs is alternated to avoid pressure injury. The external pressure required to maintain blood flow within the fingers is measured using infrared technology which is converted into a continuous waveform on the monitor.
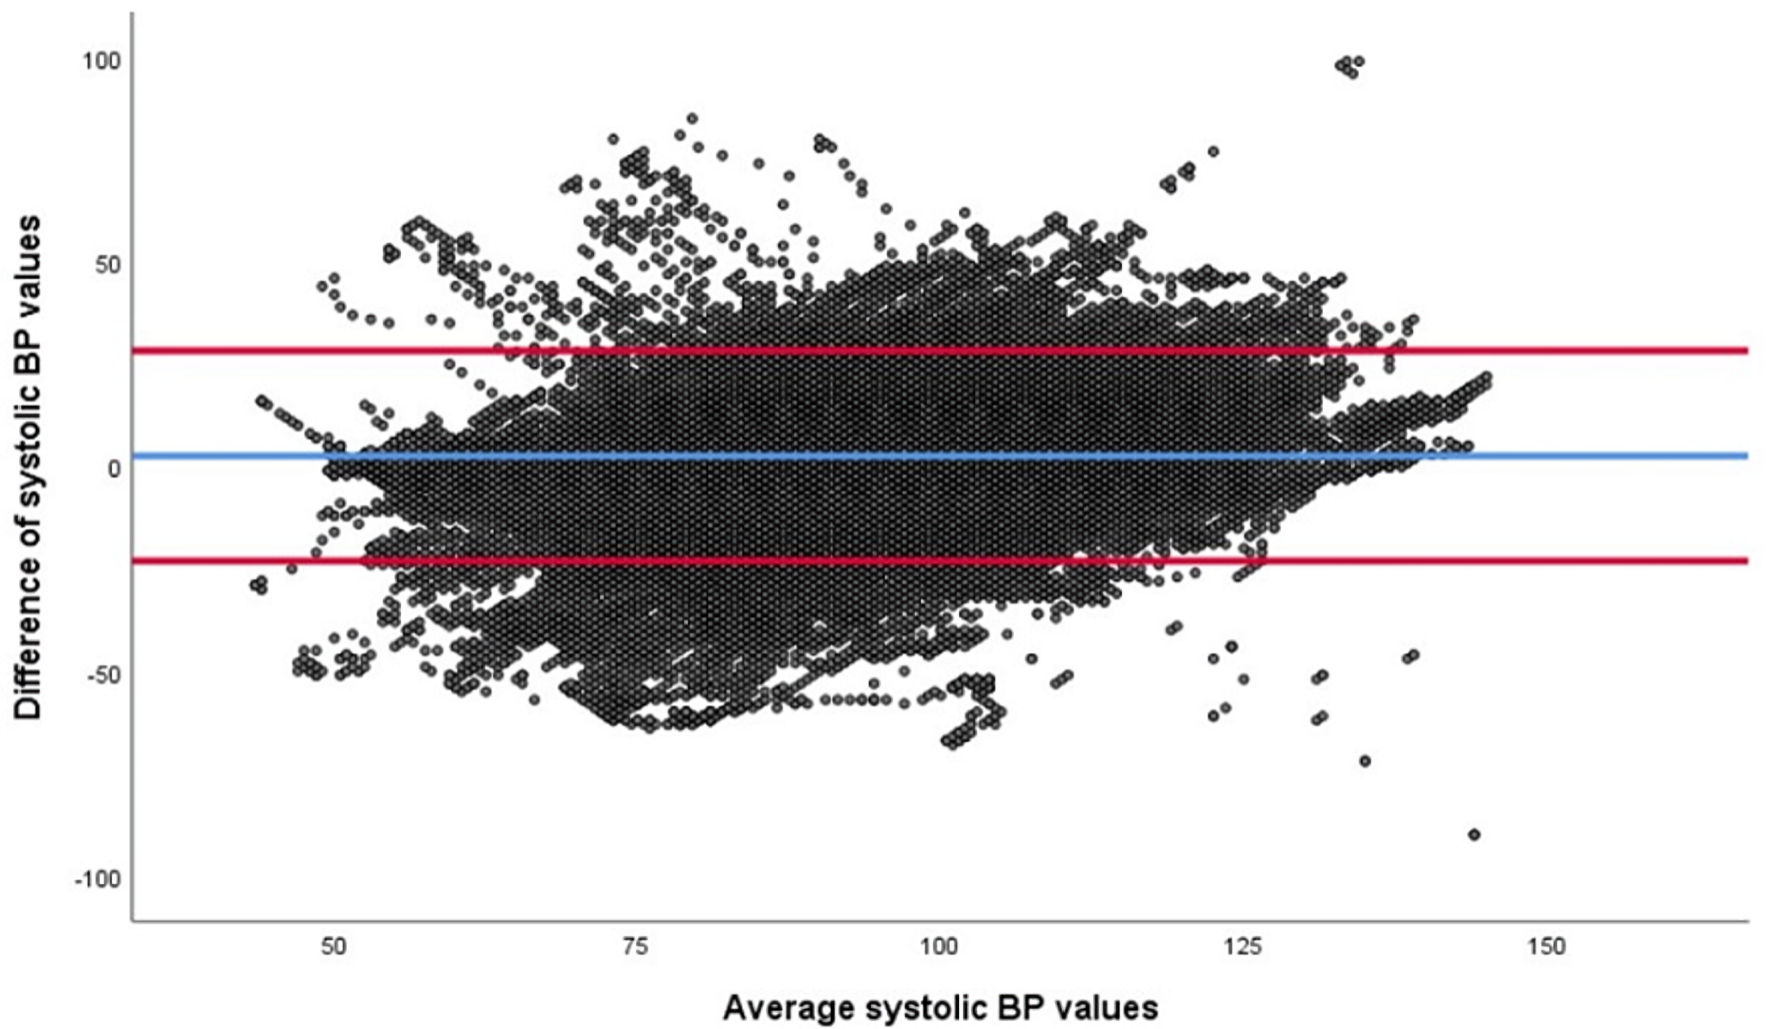
Figure 2. Bland-Altman analysis of the systolic blood pressure (SBP) from the arterial cannula (AC) and the NICCI device, both in mm Hg. The difference between the values (NICCI and AC) are plotted on the vertical axis and the average of the two values on the horizontal access. The red lines demonstrate the 95% limits of agreement (-23 to +31 mm Hg), and the blue line corresponds to the bias (2 mm Hg). BP: blood pressure.
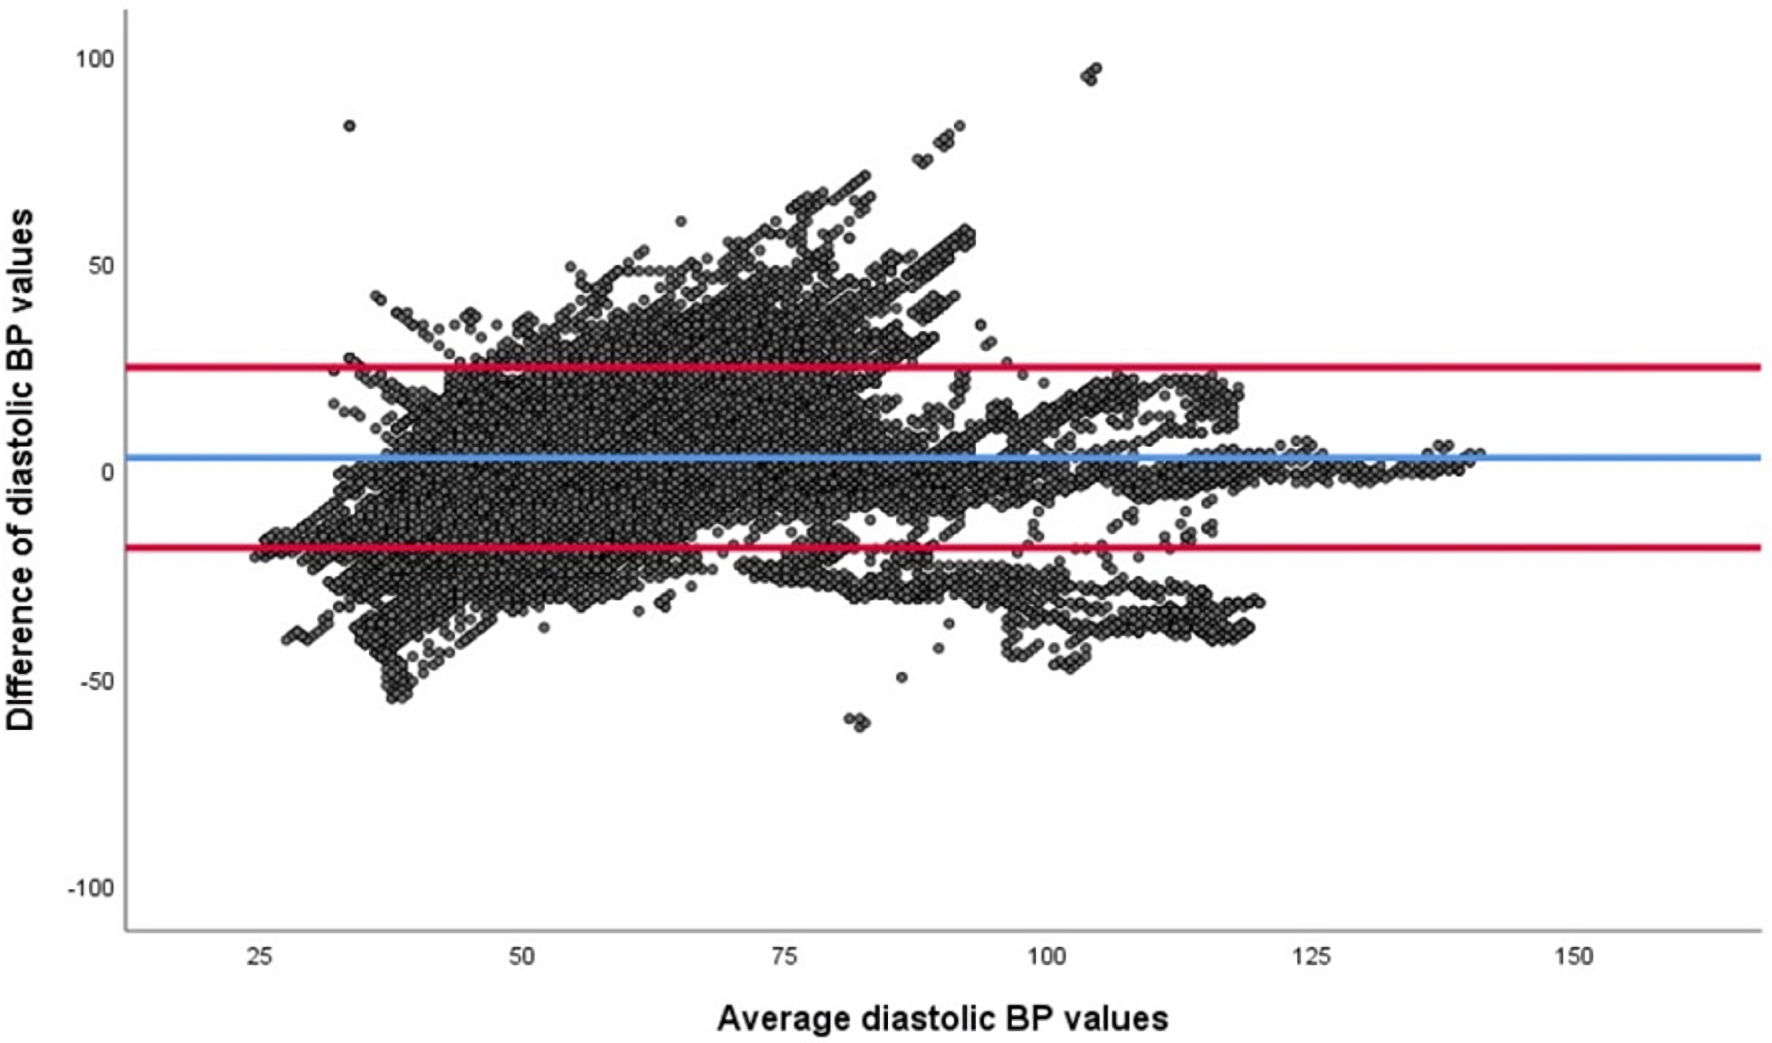
Figure 3. Bland-Altman analysis of the diastolic blood pressure (DBP) from the arterial cannula (AC) and the NICCI device, both in mm Hg. The difference between the values (NICCI and AC) are plotted on the vertical axis and the average of the two values on the horizontal access. The red lines demonstrate the 95% limits of agreement (-19 to +26 mm Hg), and the blue line corresponds to the bias (3 mm Hg). BP: blood pressure.
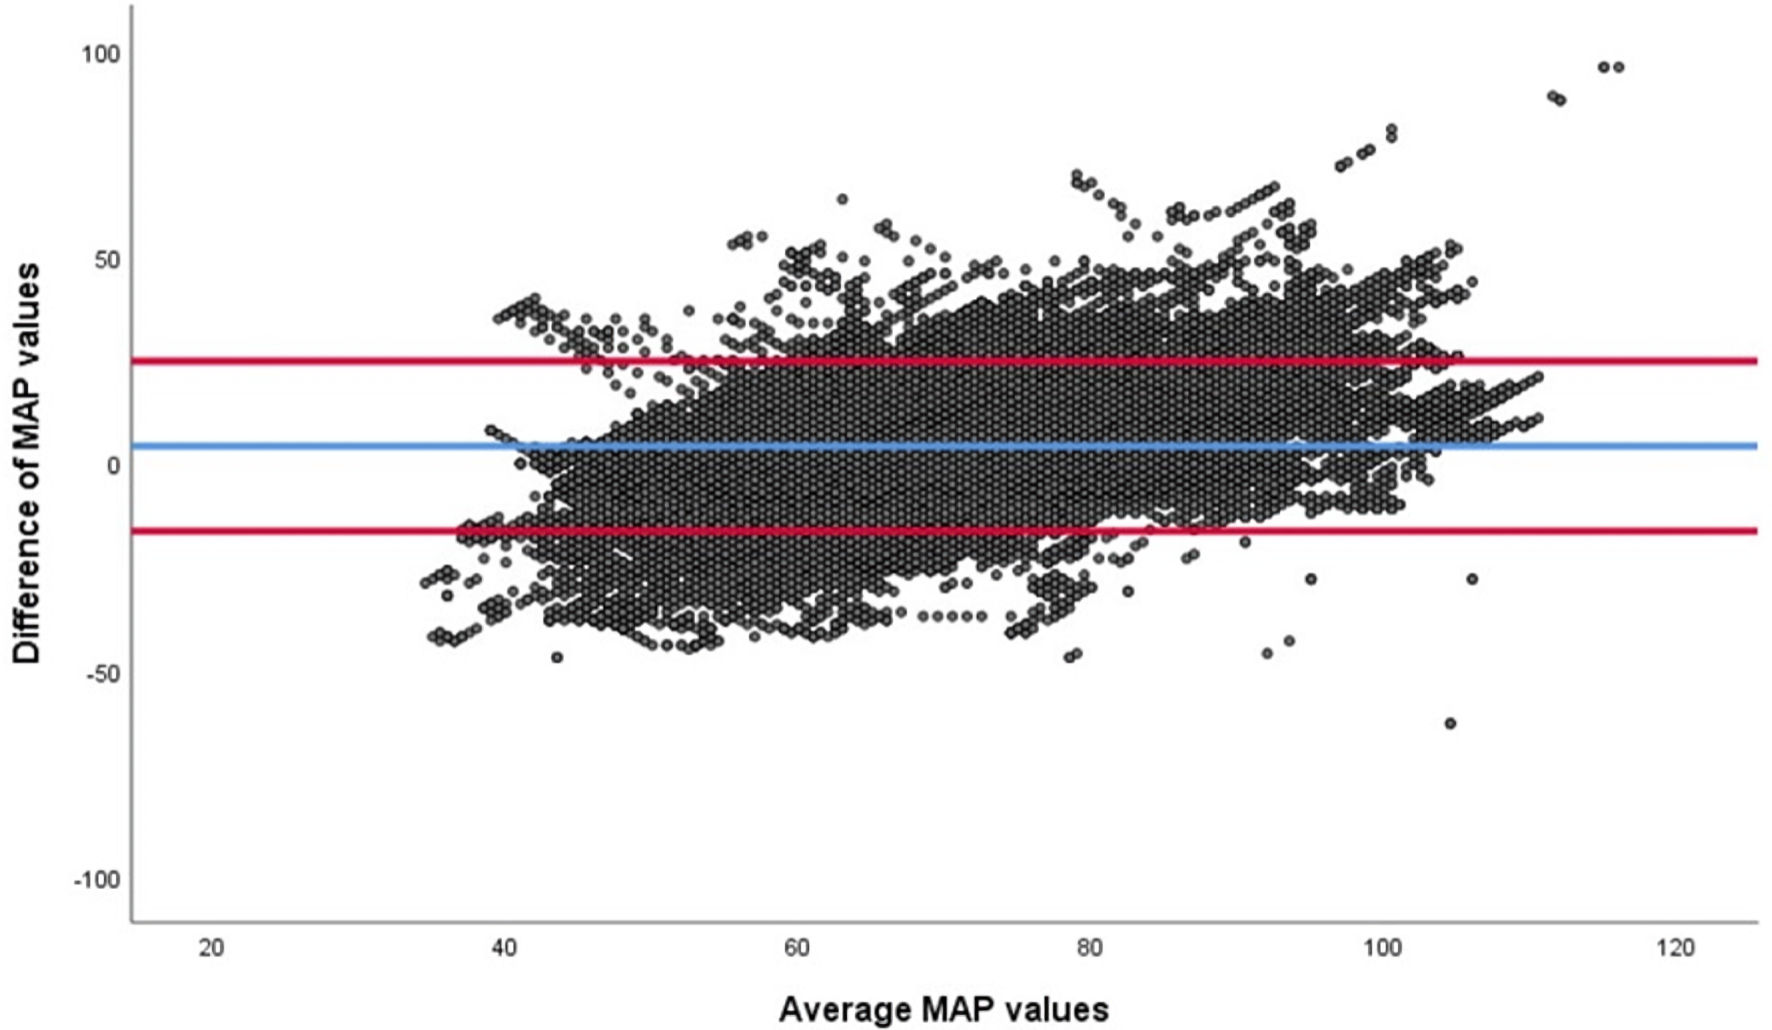
Figure 4. Bland-Altman analysis of the mean arterial pressure (MAP) from the arterial cannula (AC) and the NICCI device, both in mm Hg. The difference between the values (NICCI and AC) are plotted on the vertical axis and the average of the two values on the horizontal access. The red lines demonstrate the 95% limits of agreement (-16 to +25 mm Hg), and the blue line corresponds to the bias (4 mm Hg).
Tables
Table 1. Demographic and Clinical Characteristics of the Study Cohort
| Patient and surgical characteristics | Data |
|---|
| Data are presented as n (%), mean ± SD. SD: standard deviation; ASA: American Society of Anesthesiology; BMI: body mass index. |
| Gender (female/male) | 23/21 |
| Age (years) | 15 ± 2 |
| Weight (kg) | 56 ± 10 |
| Height (cm) | 162 ± 9 |
| BMI (kg/m2) | 22 ± 4 |
| Type of procedure | |
| Orthopedic | 40 |
| Cardiothoracic | 2 |
| Neurosurgical | 2 |
| Patient position | |
| Prone | 40 |
| Supine | 3 |
| Lateral | 1 |
| ASA Physical Classification | |
| I | 8 |
| II | 22 |
| III | 13 |
| IV | 1 |
Table 2. Comparison of Blood Pressure Readings From the AC and the NICCI Monitor
| Parameter | Difference between AC and NICCI | Percentage of NICCI readings ≤ 5 mm Hg from AC value | Percentage of NICCI readings ≤ 10 mm Hg from AC value | Percentage of NICCI readings > 10 mm Hg from AC value | Correlation coefficient |
|---|
| Data are displayed in mm Hg as the mean ± SD of absolute values or as percentages. Values are compared to those obtained from the AC. *Correlation is significant with a P value ≤ 0.01 (two-tailed). SD: standard deviation; SBP: systolic blood pressure; DBP: diastolic blood pressure; MAP: mean arterial pressure; AC: arterial cannula. |
| SBP | 10 ± 8 | 35% | 60% | 40% | 0.60* |
| DBP | 9 ± 7 | 39% | 67% | 33% | 0.55* |
| MAP | 9 ± 7 | 31% | 56% | 44% | 0.59* |
Table 3. Comparison of Blood Pressure Readings From the AC and the NICCI Monitor Based on Weight
| Parameter | Difference between AC and NICCI | Percentage of NICCI readings ≤ 5 mm Hg from AC value | Percentage of NICCI readings ≤ 10 mm Hg from AC value | Percentage of NICCI readings > 10 mm Hg from AC value | Correlation coefficient |
|---|
| Data are displayed in mm Hg as the mean ± SD of absolute values or as percentages. Values are compared to those obtained from the AC. *Correlation is significant with a P value ≤ 0.01 (two-tailed). SBP: systolic blood pressure; DBP: diastolic blood pressure; MAP: mean arterial pressure; AC: arterial cannula. |
| Patients weighing 40 - 60 kg | | | | | |
| SBP | 10 ± 9 | 34% | 60% | 40% | 0.70* |
| DBP | 9 ± 8 | 39% | 66% | 34% | 0.68* |
| MAP | 9 ± 8 | 35% | 63% | 37% | 0.81* |
| Patients weighing 60 - 80 kg | | | | | |
| SBP | 10 ± 9 | 37% | 62% | 38% | 0.64* |
| DBP | 9 ± 8 | 41% | 69% | 31% | 0.67* |
| MAP | 8 ± 7 | 41% | 70% | 30% | 0.56* |
Table 4. Comparison of SBP and MAP Readings From the AC and NICCI Monitor
| Parameter | SBP ≤ 70 mm Hg | SBP > 70 mm Hg | MAP ≤ 50 mm Hg | MAP > 50 mm Hg |
|---|
| Percent of values | Mean ± SD | Percent of values | Mean ± SD | Percent of values | Mean ± SD | Percent of values | Mean ± SD |
|---|
| Data are displayed in mm Hg as the mean ± SD of absolute values or as percentages. Values are compared to those obtained from the AC. SD: standard deviation; SBP: systolic blood pressure; MAP: mean arterial pressure; AC: arterial cannula. |
| AC | 3% | 62 ± 6 | 97% | 93 ± 12 | 2.3% | 48 ± 3 | 97.7% | 66 ± 8 |
| NICCI | 7% | 62 ± 7 | 93% | 97 ± 13 | 5.5% | 45 ± 5 | 94.5% | 72 ± 11 |
Table 5. Bland-Altman Analysis Comparing Blood Pressure Readings From the AC and NICCI Monitor
| Parameter | Bias | Precision | 95% level of agreement |
|---|
| Data are presented in mm Hg rounded to the nearest whole integer. Values are compared to those obtained from an AC. SBP: systolic blood pressure; DBP: diastolic blood pressure; MAP: mean arterial pressure; AC: arterial cannula. |
| SBP | 2 | 13 | -23 to +31 |
| DBP | 3 | 11 | -19 to +26 |
| MAP | 4 | 12 | -16 to +25 |