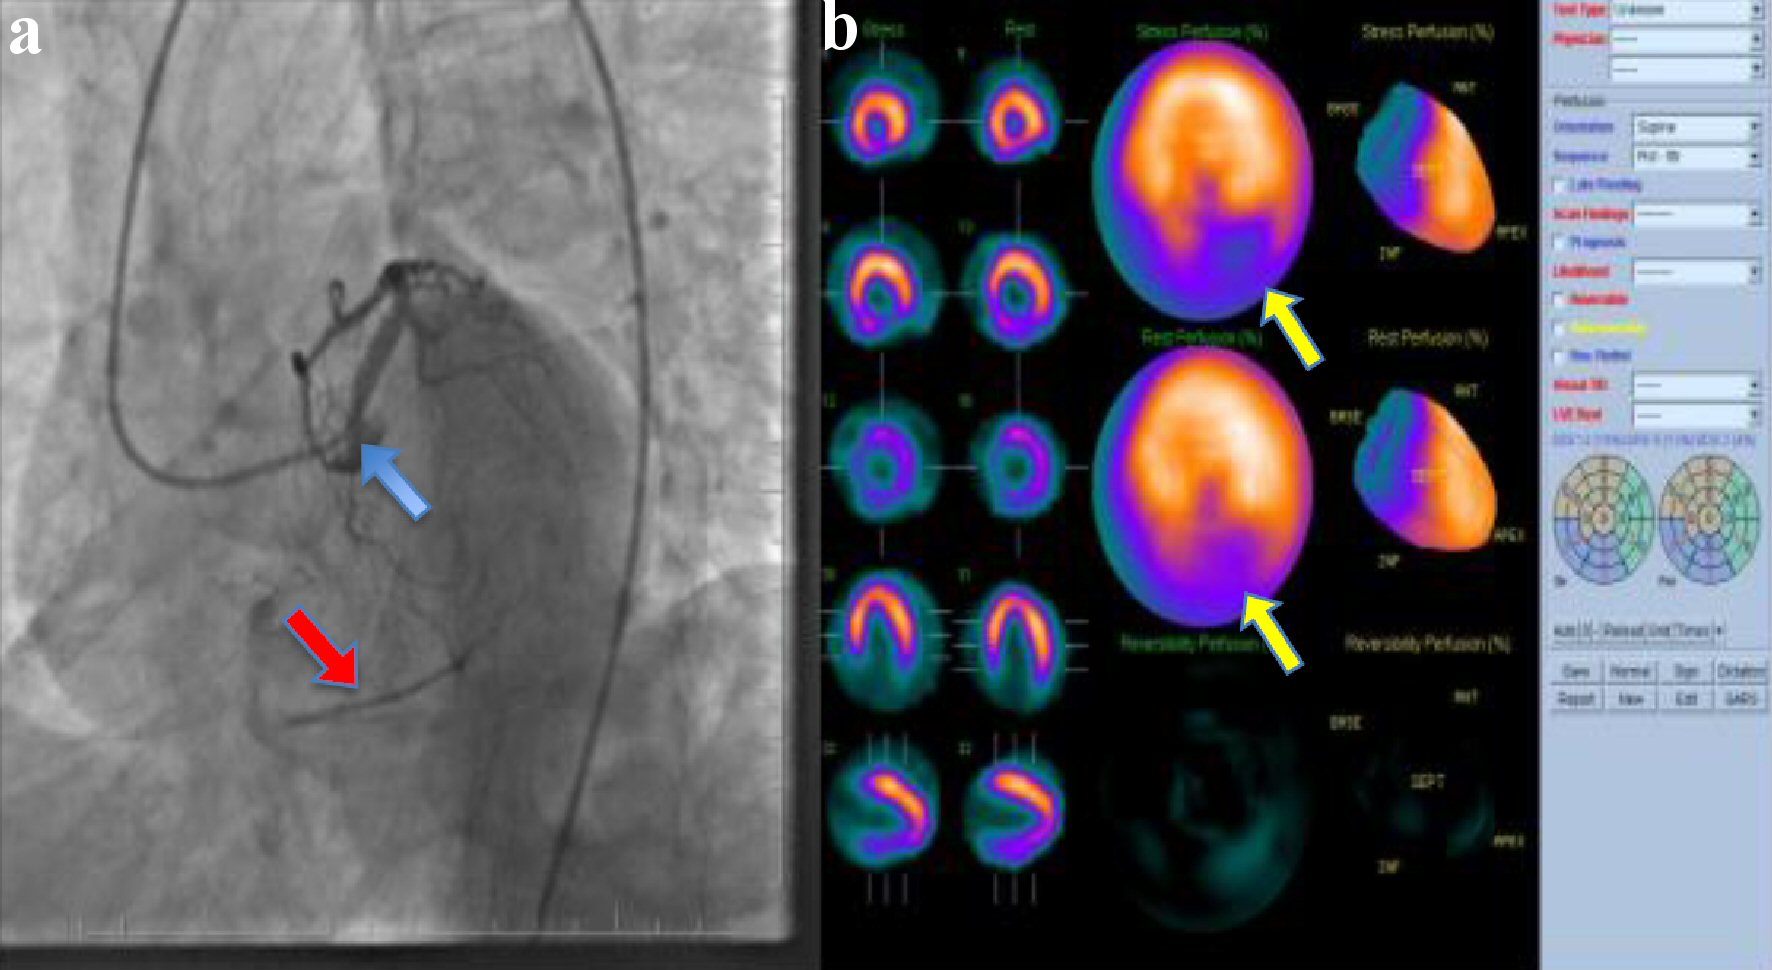
| Cardiology Research, ISSN 1923-2829 print, 1923-2837 online, Open Access |
| Article copyright, the authors; Journal compilation copyright, Cardiol Res and Elmer Press Inc |
| Journal website https://www.cardiologyres.org |
Original Article
Volume 12, Number 3, June 2021, pages 193-200
Contradictory Effect of Coronary Collateral Circulation on Regional Myocardial Perfusion That Assessed by Quantitative Myocardial Perfusion Scintigraphy
Figure

Tables
| Clinical characteristics | Patients cohort (n = 96) | P value | |
|---|---|---|---|
| Not-well-developed collateral group (n = 58) | Well-developed collateral group (n = 38) | ||
| *P < 0.05. CAD: coronary artery disease. | |||
| The mean age (years) | 64.05 ± 10.13 | 61.71 ± 11.69 | 0.300 |
| Gender, n (%) | |||
| Male | 41 (70.7) | 28 (73.7) | 0.750 |
| Female | 17 (29.3) | 10 (26.3) | |
| Body mass index (kg/m2) | 28.14 ± 4.31 | 29.34 ± 4.76 | 0.211 |
| Comorbidities | |||
| Diabetes mellitus, n (%) | 29 (50.0) | 11 (28.9) | 0.041* |
| Hypertension, n (%) | 23 (39.7) | 15 (39.5) | 0.986 |
| Hyperlipidemia, n (%) | 33 (57.9) | 20 (52.6) | 0.613 |
| Smoking, n (%) | 28 (48.3) | 19 (50.0) | 0.869 |
| Family history of CAD, n (%) | 32 (55.2) | 24 (63.2) | 0.438 |
| Cardiac drugs | |||
| Antihypertensive | 23 (39.7) | 15 (39.5) | 0.986 |
| Beta blocker | 50 (86.2) | 31 (81.5) | 0.516 |
| Vasodilators | 18 (31.0) | 11 (28.9) | 0.828 |
| Coronary angiography | |||
| Rentrop 0 (n) | 52 | - | |
| Rentrop 1 (n) | 6 | - | |
| Rentrop 2 (n) | - | 24 | |
| Rentrop 3 (n) | - | 14 | |
| Myocardial perfusion gated SPECT imaging parameters | Patients cohort (n = 96) | P value | |
|---|---|---|---|
| Not-well-developed collateral group (n = 58) | Well-developed collateral group (n = 38) | ||
| *P < 0.05. SPECT: single-photon emission computerized tomography; QPS: Quantitative Perfusion SPECT; QGS: Quantitative Gated SPECT; SSS: summed stress score; SDS: summed difference score; SMS: summed motion score; EF: ejection fraction; TID: transient ischemic dilation; PP: peak phase; PSD: phase standard deviation; PHB: phase histogram bandwidth. | |||
| QPS and QGS | |||
| SSS = perfusion damage score | 14.16 ± 6.41 | 15.03 ± 6.96 | 0.531 |
| SDS = ischemia score | 7.29 ± 3.26 | 7.63 ± 3.59 | 0.634 |
| SMS = motion damage score | 11.78 ± 6.47 | 11.84 ± 7.89 | 0.964 |
| Stress EF (%) | 53.21 ± 5.63 | 54.05 ± 6.31 | 0.495 |
| Left ventricular mass (g) | 128.32 ± 17.65 | 137.18 ± 14.36 | 0.011* |
| Left ventricular mass index (g/m2) | 68.96 ± 10.29 | 73.08 ± 10.40 | 0.059 |
| TID | 1.11 ± 0.17 | 1.06 ± 0.13 | 0.158 |
| Phase analysis (desynchronization scores) | |||
| PP | 147.05 ± 24.19 | 138.55 ± 20.00 | 0.075 |
| PSD | 35.07 ± 16.57 | 28.53 ± 15.08 | 0.053 |
| PHB | 69.82 ± 34.22 | 57.56 ± 29.55 | 0.074 |
| Gated myocardial perfusion scintigraphy parameters | Coronary artery subgroups (patients n = 96, coronary artery n = 116a) | P value | |||||
|---|---|---|---|---|---|---|---|
| Group1 (not-well-developed collateral group) | Group 2 (well-developed collateral group) | ||||||
| Subgroup LAD1 (n = 30) | Subgroup CX1 (n = 20) | Subgroup RCA1 (n = 26) | Subgroup LAD2 (n = 15) | Subgroup CX1 (n = 10) | Subgroup RCA2 (n = 15) | ||
| aSome patients had stenosis in more than one coronary artery. SSS: summed stress score; SDS: summed difference score; SMS: summed motion score; EF: ejection fraction; TID: transient ischemic dilation; PP: peak phase; PSD: phase standard deviation; PHB: phase histogram bandwidth; LAD: left artery descending; CX: circumflex artery; RCA: right coronary artery. | |||||||
| QPS and QGS | |||||||
| SSS = perfusion damage score | 8.33 ± 4.70 | 9.43 ± 3.38 | 9.65 ± 3.95 | 8.00 ± 2.92 | 8.89 ± 2.57 | 9.13 ± 4.47 | Subgroup LAD 0.809 |
| Subgroup CX 0.553 | |||||||
| Subgroup RCA 0.873 | |||||||
| SDS = ischemia score | 3.11 ± 1.51 | 3.54 ± 1.15 | 3.79 ± 1.35 | 2.98 ± 1.02 | 3.02 ± 1.03 | 3.98 ± 1.26 | Subgroup LAD 0.815 |
| Subgroup CX 0.455 | |||||||
| Subgroup RCA 0.756 | |||||||
| SMS = motion damage score | 6.67 ± 4.10 | 7.95 ± 3.58 | 8.58 ± 2.94 | 5.00 ± 2.56 | 6.33 ± 4.09 | 5.93 ± 3.15 | Subgroup LAD 0.083 |
| Subgroup CX 0.097 | |||||||
| Subgroup RCA 0.102 | |||||||
| Stress EF (%) | 52.77 ± 6.36 | 51.40 ± 6.28 | 52.38 ± 5.79 | 54.47 ± 5.52 | 54.10 ± 7.15 | 54.67 ± 5.80 | Subgroup LAD 0.537 |
| Subgroup CX 0.231 | |||||||
| Subgroup RCA 0.314 | |||||||
| Left ventricular mass (g) | 133.40 ± 21.95 | 133.60 ± 14.68 | 129.11 ± 16.29 | 137.20 ± 11,57 | 136.30 ± 15.64 | 134.73 ± 14.87 | Subgroup LAD 0.462 |
| Subgroup CX 0.475 | |||||||
| Subgroup RCA 0.253 | |||||||
| Left ventricular mass index (g/m2) | 70.76 ± 10.62 | 69.46 ± 10.41 | 70.08 ± 12.26 | 72.46 ± 11.03 | 73.45 ± 9.34 | 69.83 ± 8.45 | Subgroup LAD 0.485 |
| Subgroup CX 0.328 | |||||||
| Subgroup RCA 0.640 | |||||||
| TID | 1.12 ± 0.15 | 1.11 ± 0.18 | 1.13 ± 0.18 | 1.05 ± 0.10 | 1.04 ± 0.09 | 1.05 ± 0.13 | Subgroup LAD 0.126 |
| Subgroup CX 0.230 | |||||||
| Subgroup RCA 0.184 | |||||||
| Phase analysis (desynchronization) | |||||||
| PP | 151.03 ± 28.10 | 144.15 ± 24.58 | 146.69 ± 21.37 | 140.60 ± 17.12 | 135.70 ± 24.16 | 137.73 ± 14.73 | Subgroup LAD 0.219 |
| Subgroup CX 0.328 | |||||||
| Subgroup RCA 0.121 | |||||||
| PSD | 34.21 ± 18.94 | 36.60 ± 21.34 | 36.27 ± 16.46 | 26.80 ± 12.45 | 28.58 ± 15.98 | 30.34 ± 11.30 | Subgroup LAD 0.295 |
| Subgroup CX 0.301 | |||||||
| Subgroup RCA 0.221 | |||||||
| PHD | 70.03 ± 35.09 | 84.05 ± 44.65 | 65.53 ± 25.08 | 52.33 ± 16.14 | 66.60 ± 43.08 | 55.03 ± 20.87 | Subgroup LAD 0.135 |
| Subgroup CX 0.091 | |||||||
| Subgroup RCA 0.165 | |||||||