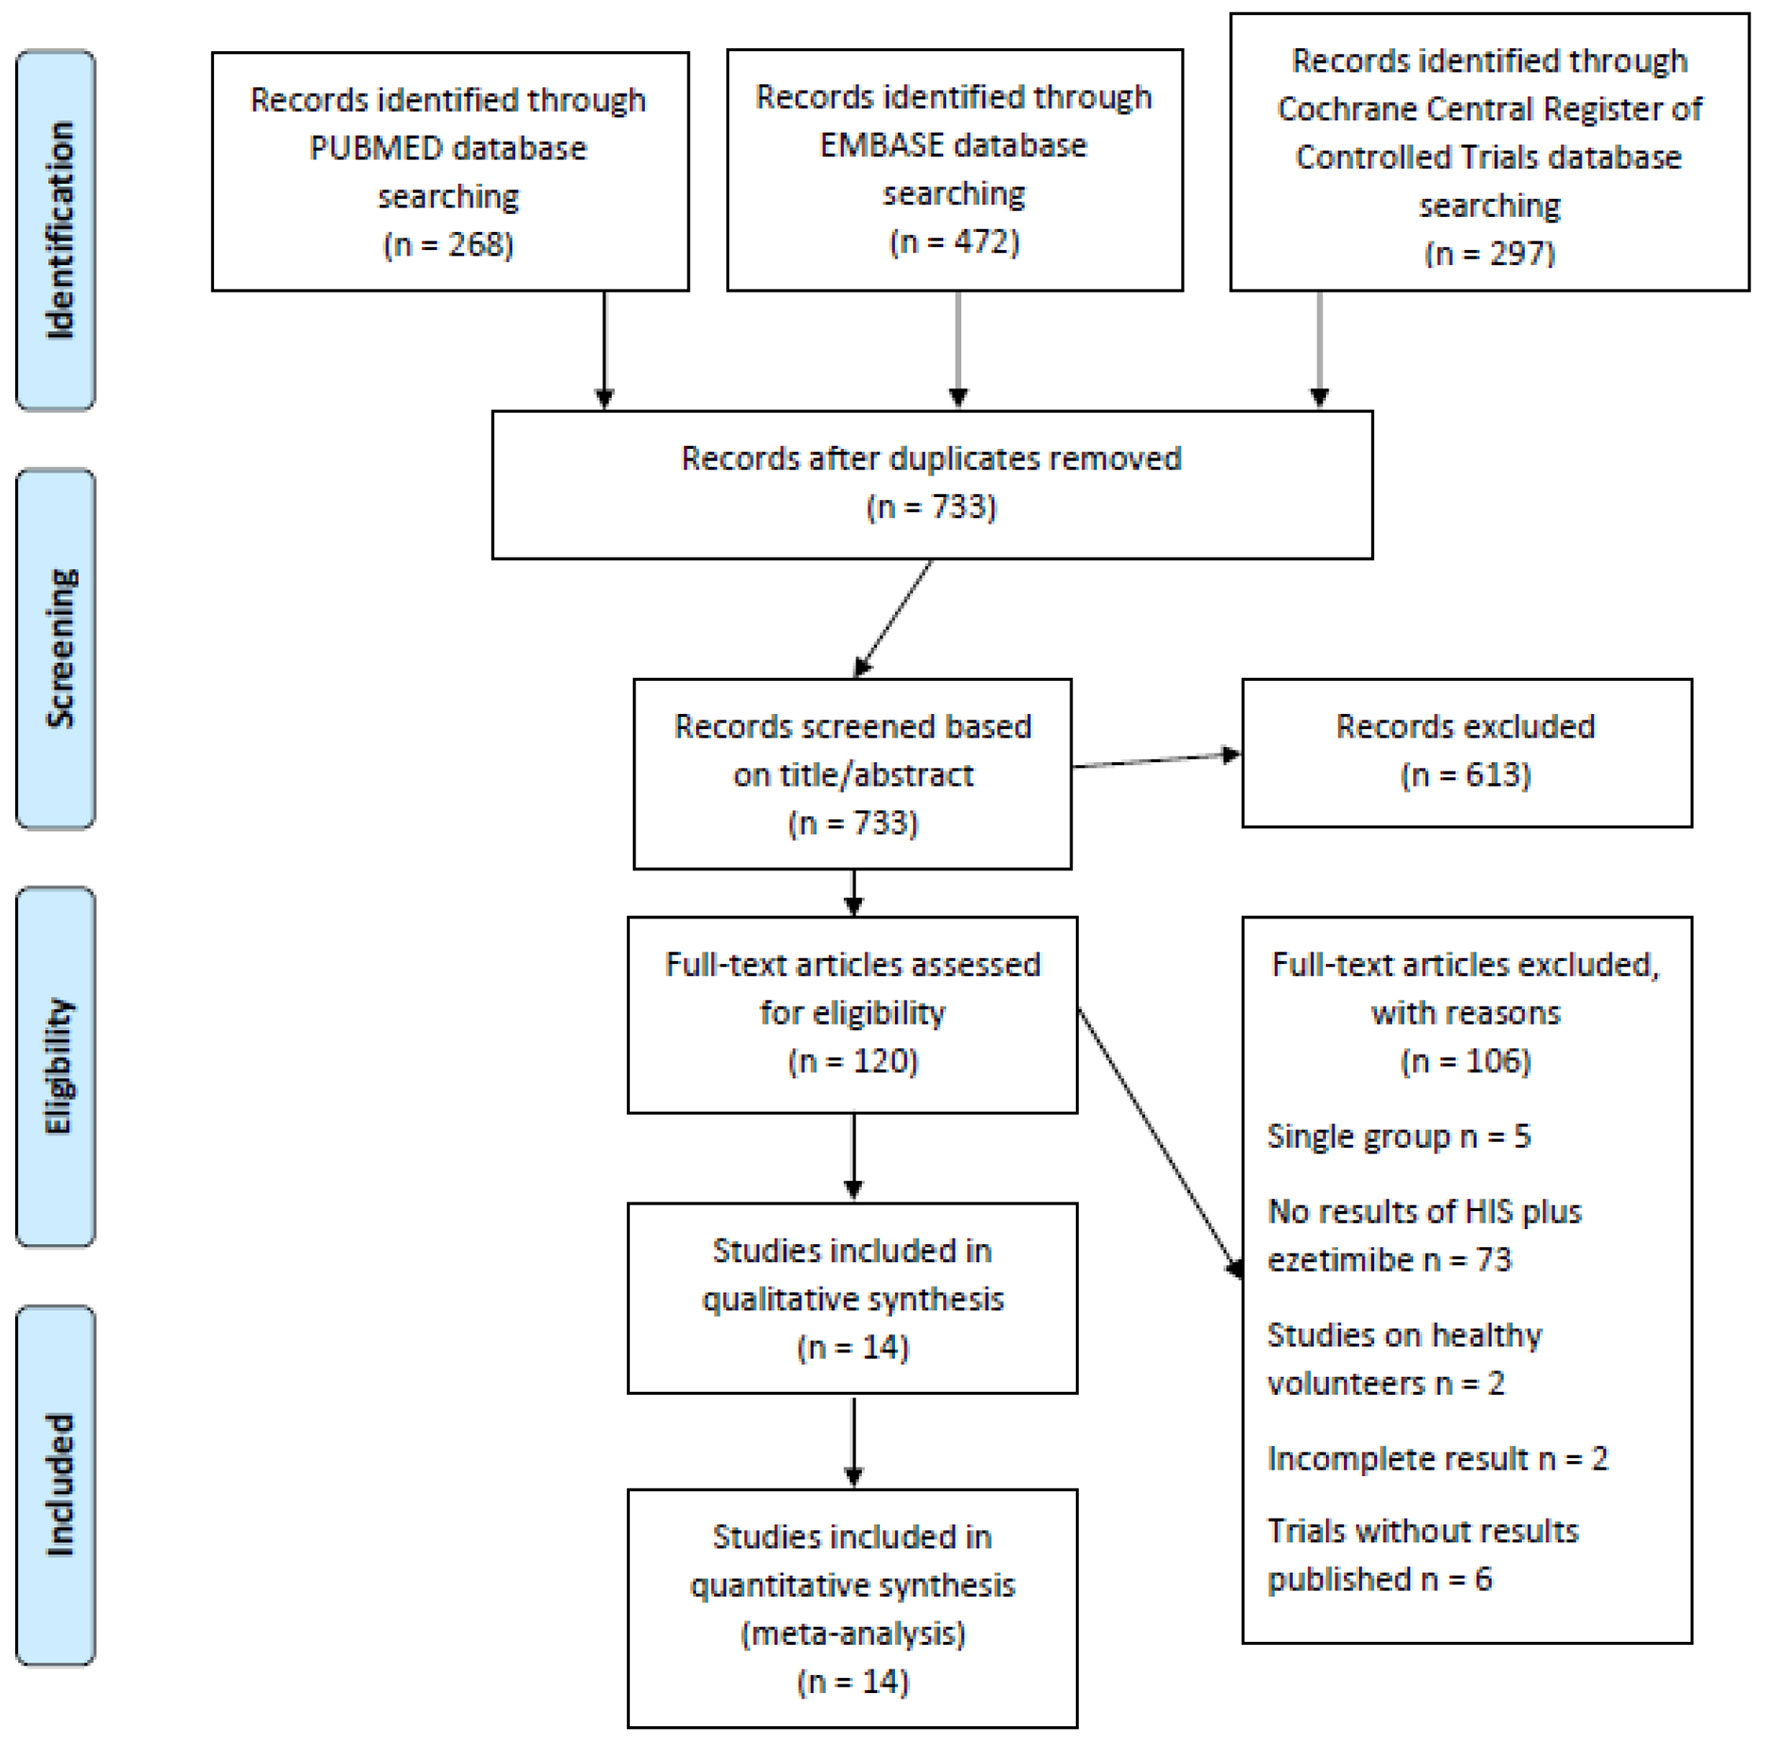
Figure 1. Flowchart for study selection.
| Cardiology Research, ISSN 1923-2829 print, 1923-2837 online, Open Access |
| Article copyright, the authors; Journal compilation copyright, Cardiol Res and Elmer Press Inc |
| Journal website https://www.cardiologyres.org |
Original Article
Volume 12, Number 2, April 2021, pages 98-108
Effect of Ezetimibe Added to High-Intensity Statin Therapy on Low-Density Lipoprotein Cholesterol Levels: A Meta-Analysis
Figures
Tables
| Studies | Design | Region | Patients eligibility | Treatment, patients number (n) | Baseline LDL-C (mmol/L (mg/dL)) | LDL-C at the end of studies (mmol/L (mg/dL)) |
|---|---|---|---|---|---|---|
| ± indicates standard deviation. CHD: coronary heart disease; DB: double-blinded; HDL-C: high-density lipoprotein cholesterol; LDL-C: low-density lipoprotein cholesterol; MC: multicenter; NCEP ATP III: the third report of the expert panel on detection, evaluation, and treatment of high blood cholesterol in adults; OL: open-label; PC: placebo-controlled; R: randomized; SC: single center; TG: triglyceride. | ||||||
| Azar et al, 2011 [15] | R, DB, PC, 8 weeks | Western countries | Adults with stable coronary artery disease or coronary artery disease equivalent | Atorvastatin 40 mg/day, n = 50 | 2.56 ± 0.54 (99 ± 21) | 2.22 ± 0.36 (86 ± 14) |
| Atorvastatin 40 mg/d + ezetimibe 10 mg/d, n = 50 | 2.64 ± 0.75 (102 ± 29) | 1.99 ± 0.26 (77 ± 10) | ||||
| Ballantyne et al, 2003_40 [16] | R, DB, PC, 12 weeks | Western countries | Adults with primary hypercholesterolemia, defined as calculated LDL-C of 145 - 250 mg/dL, inclusive, and TG levels ≤ 350 mg/dL. | Atorvastatin 40 mg/day, n = 57 | N/A | N/A |
| Atorvastatin 40 mg/day + ezetimibe 10 mg/day, n = 57 | ||||||
| Ballantyne et al, 2003_80 [16] | Atorvastatin 80 mg/day, n = 57 | |||||
| Atorvastatin 80 mg/day + ezetimibe 10 mg/day, n = 50 | ||||||
| Ballantyne et al, 2007 [17] | R, OL, MC, 6 weeks | Western countries | Adults with hypercholesterolemia and a history of CHD or clinical evidence of atherosclerosis or a CHD risk equivalent (10-year CHD risk score > 20%); two most recent fasting LDL-C levels was ≥ 160 mg/dL and < 250 mg/dL and the two measurements were within 15% of each other; a fasting TG concentration of < 400 mg/dL | Rosuvastatin 40 mg/day, n = 230 | 4.94 (191) | 2.12 (82) |
| Rosuvastatin 40 mg/day + ezetimibe 10 mg/day, n = 235 | 4.88 (189) | 1.47 (57) | ||||
| Barbosa et al, 2013 [18] | R, OL, 4 weeks | Western countries | Adults with at high risk for CHD, characterized by at least one of the following conditions: established CHD or equivalent; diagnosis of type 2 diabetes; or those whose Framingham risk score was > 20%. | Atorvastatin 40 mg/day, n = 45 | 2.3 (89) | 1.91 (74) |
| Atorvastatin 40 mg/day + ezetimibe 10 mg/day, n = 37 | 2.30 (94) | 1.60 (62) | ||||
| Blom et al, 2014 [10] | R, DB, 52 weeks; atorvastatin and ezetimibe were not masked | Western countries | Adults with an LDL-C ≥ 75 mg/dL and a fasting TG level ≤ 400 mg/dL | Atorvastatin 80 mg/day, n = 73 | 2.49 ± 0.34 (96.2 ± 13.3) | 2.70 ± 0.82 (104.6 ± 31.61) |
| Atorvastatin 80 mg/day + ezetimibe 10 mg/day, n = 63 | 3.10 ± 0.84 (119.8 ± 32.4) | 2.97 ± 1.15 (115.0 ± 44.44) | ||||
| Hong et al, 2018 [19] | R, DB, MC, 8 weeks | South Korean | Adults with hypercholesterolemia requiring medical treatment according to NCEP ATP III. | Rosuvastatin 20 mg/day, n = 64 | 3.95 ± 0.81 (152.8 ± 31.4) | 1.95 ± 0.88 (75.4 ± 34.0) |
| Rosuvastatin 20 mg/day + ezetimibe 10 mg/day, n = 64 | 3.97 ± 0.81 (153.5 ± 31.2) | 1.37 ± 0.57 (53.1 ± 22.0) | ||||
| Hougaard et al, 2017 [20] | R, DB, SC, 52 weeks | Western countries | Adults with ST-elevation myocardial infarction | Atorvastatin 80 mg/day, n = 41 | 4.10 ± 0.90 (158.55 ± 34.80) | 2.00 ± 0.50 (77.34 ± 19.34) |
| Atorvastatin 80 mg/day + ezetimibe 10 mg/day, n = 39 | 3.70 ± 0.71 (143.08 ± 27.67) | 1.40 ± 0.80 (54.14 ± 30.94) | ||||
| Kim et al, 2016 [21] | R, DB, MC, 8 weeks | South Korean | Adults with initial levels of LDL-C ≤ 250 mg/dL and TG < 400 mg/dL were selected for a lead-in period, then the patients who required lipid-lowering treatment according to the NCEP ATP III guidelines were finally enrolled in the study. | Rosuvastatin 20 mg/day, n = 68 | N/A | N/A |
| Rosuvastatin 20 mg/day + ezetimibe 10 mg/day, n = 68 | ||||||
| Kim et al, 2018 [22] | R, DB, MC, 8 weeks | South Korean | Adults with primary hypercholesterolemia who had an LDL-C level < 250 mg/dL and TG level < 350 mg/dL requiring treatment according to NCEP ATPIII guidelines. | Rosuvastatin 20 mg/day, n = 63 | 4.16 ± 0.79 (160.90 ± 30.57) | N/A |
| Rosuvastatin 20 mg/day + ezetimibe 10 mg/day, n = 64 | 4.12 ± 0.77 (159.56 ± 29.91) | N/A | ||||
| Lins et al, 2014 [23] | R, OL, 4 weeks | Western countries | Adults at high-risk for CHD, characterized by at least one of the following conditions: stable CHD or CHD equivalent; diagnosis of type 2 diabetes; or those whose Framingham risk score was > 20%. | Atorvastatin 40 mg/day, n = 22 | 2.30 (89) | 1.94 (75) |
| Atorvastatin 40 mg/day + ezetimibe 10 mg/day, n = 21 | 2.45 (95) | 1.60 (62) | ||||
| Malina et al, 2015 [24] | R, OL, 4 weeks | Western countries | Adults in primary or secondary prevention of CHD, who had an indication for lipid-lowering therapy in accordance with NCEP ATP III | Atorvastatin 40 mg/day, n = 35 | 2.58 ± 0.83 (100 ± 32) | 2.01 ± 0.67 (78 ± 26) |
| Atorvastatin 40 mg/day + ezetimibe 10 mg/day, n = 22 | 2.30 ± 0.72 (89 ± 28) | 1.42 ± 0.49 (5 5± 19) | ||||
| Nicholls et al, 2017 [12] | R, DB, PC, 90 days | Western countries | Adults with either atherosclerotic cardiovascular disease or type 1 or 2 diabetes mellitus, treated with atorvastatin 40 mg daily for at least 30 days prior to screening and compliant with study drug for the 28-day lead-in phase, had an LDL-C > 70 mg/dL or non-HDL-C > 100 mg/dL at screening and prior to randomization and a TG ≤ 400 mg/dL. | Atorvastatin 40 mg/day, n = 40 | N/A | N/A |
| Atorvastatin 40 mg/day + ezetimibe 10 mg/day, n = 91 | ||||||
| Robinson et al, 2014 [13] | R, DB, 12 weeks; atorvastatin was not masked | Western countries | Adults with a screening LDL-C level ≥ 150 mg/dL with no statin, or ≥ 100 mg/dL with non-intensive statin, or ≥ 80 mg/dL with intensive statin, and fasting TG ≤ 400 mg/dL. | Atorvastatin 80 mg/day, n = 110 | 2.52 ± 0.88 (97.5 ± 34.08) | 2.71 ± 1.08 (104.8 ± 41.66) |
| Atorvastatin 80 mg/day + ezetimibe 10 mg/day, n = 110 | 2.47 ± 0.72 (95.5 ± 27.70) | 2.04 ± 1.31 (78.85 ± 50.89) | ||||
| Yang et al, 2017 [25] | R, DB, 12 weeks | South Korean | Adults with high or moderately high cardiovascular disease as classified by NCEP ATP III | Rosuvastatin 20 mg/day, n = 39 | 3.88 ± 0.98 (150 ± 38) | 1.68 ± 0.72 (65 ± 28) |
| Rosuvastatin 20 mg/day + ezetimibe 10 mg/day, n = 42 | 3.82 ± 0.78 (148 ± 30) | 1.34 ± 0.62 (52 ± 24) | ||||
| Study name | Mean difference | Standard error | Lower limit | Upper limit | z-value | P-value |
|---|---|---|---|---|---|---|
| Azar et al, 2011 [15] | -14.088 | 2.005 | -18.018 | -10.158 | -7.026 | < 0.001 |
| Ballantyne et al, 2003_40 [16] | -14.250 | 2.071 | -18.309 | -10.191 | -6.881 | < 0.001 |
| Ballantyne et al, 2003_80 [16] | -14.457 | 2.067 | -18.508 | -10.406 | -6.995 | < 0.001 |
| Ballantyne et al, 2007 [17] | -14.099 | 2.090 | -18.196 | -10.002 | -6.745 | < 0.001 |
| Barbosa et al, 2013 [18] | -13.895 | 1.998 | -17.811 | -9.979 | -6.955 | < 0.001 |
| Blom et al, 2014 [10] | -14.323 | 2.015 | -18.271 | -10.374 | -7.109 | < 0.001 |
| Hong et al, 2018 [19] | -13.924 | 2.098 | -18.035 | -9.812 | -6.637 | < 0.001 |
| Hougaard et al, 2017 [20] | -14.400 | 2.076 | -18.469 | -10.330 | -6.935 | < 0.001 |
| Kim et al, 2016 [21] | -14.562 | 2.060 | -18.600 | -10.524 | -7.068 | < 0.001 |
| Kim et al, 2018 [22] | -14.047 | 2.144 | -18.249 | -9.844 | -6.552 | < 0.001 |
| Lins et al, 2014 [23] | -13.784 | 1.999 | -17.702 | -9.866 | -6.895 | < 0.001 |
| Malina et al, 2015 [24] | -14.101 | 2.014 | -18.048 | -10.154 | -7.002 | < 0.001 |
| Nicholls et al, 2017 [12] | -13.091 | 1.850 | -16.716 | -9.465 | -7.076 | < 0.001 |
| Robinson et al, 2014 [13] | -12.094 | 1.299 | -14.641 | -9.547 | -9.307 | < 0.001 |
| Yang et al, 2017 [25] | -14.559 | 2.010 | -18.499 | -10.620 | -7.244 | < 0.001 |