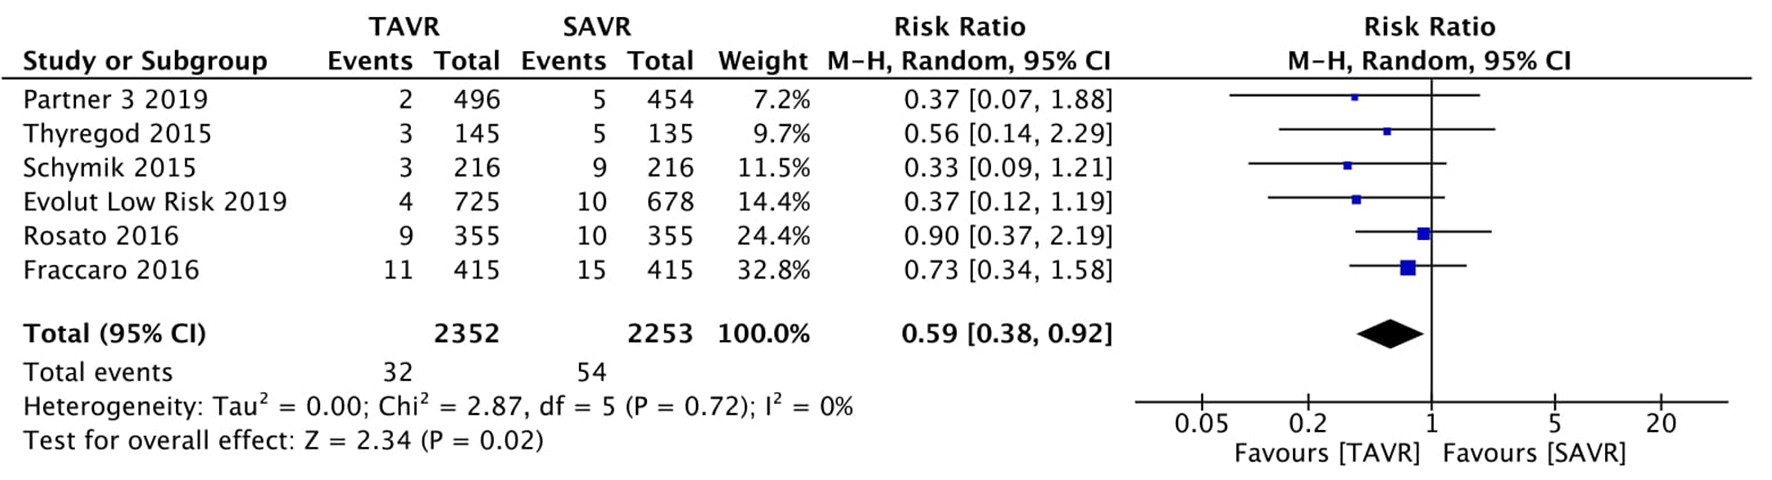
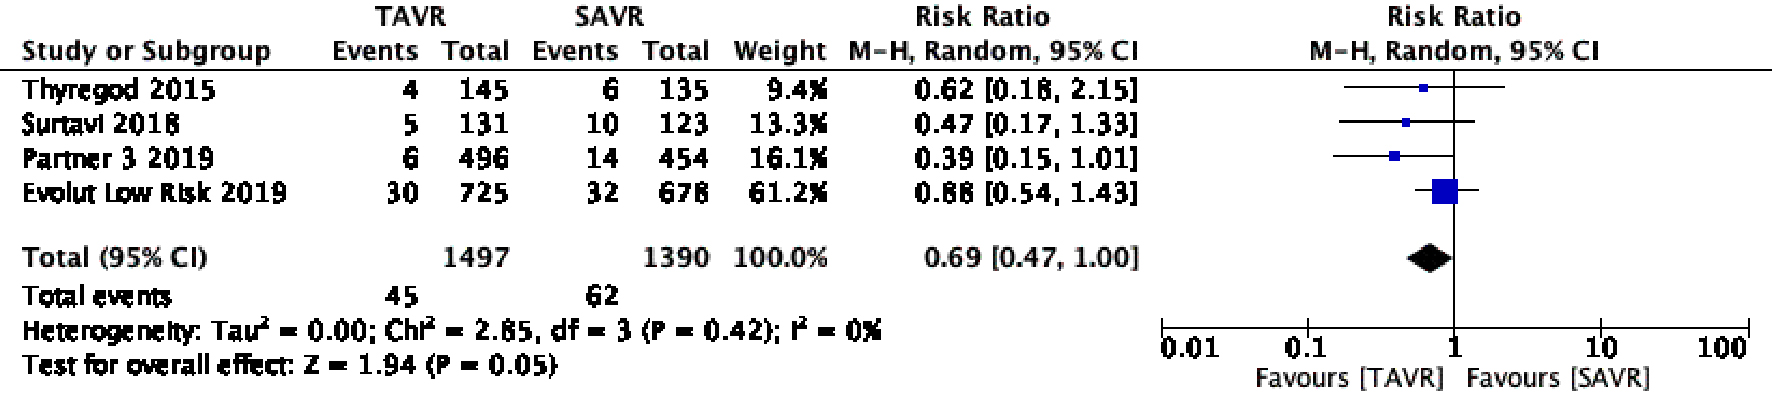
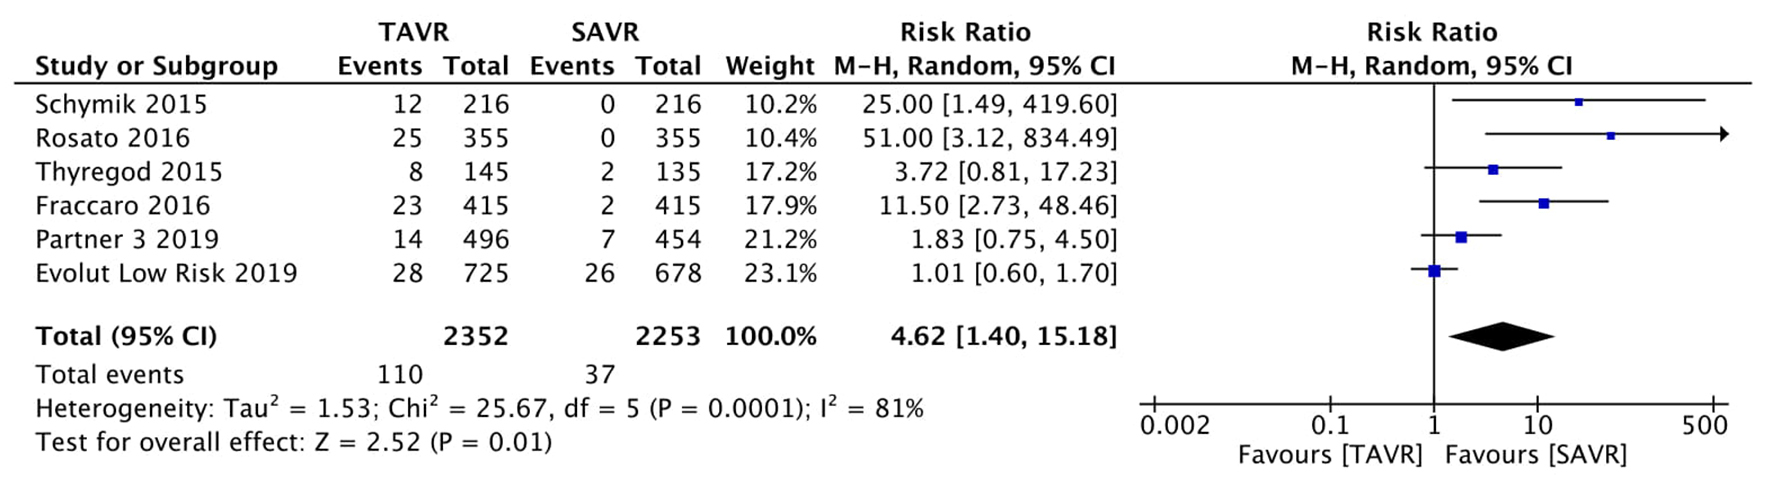
Figure 1. Random effect meta-analysis and forest plot of 30-day risk of mortality among patients undergoing TAVR, as compared to SAVR. TAVR: transcutaneous aortic valve replacement; SAVR: surgical aortic valve replacement.
| Cardiology Research, ISSN 1923-2829 print, 1923-2837 online, Open Access |
| Article copyright, the authors; Journal compilation copyright, Cardiol Res and Elmer Press Inc |
| Journal website http://www.cardiologyres.org |
Original Article
Volume 11, Number 3, June 2020, pages 168-178
Comparing Transcatheter Aortic Valve Replacement (AVR) With Surgical AVR in Lower Risk Patients: A Comprehensive Meta-Analysis and Systematic Review
Figures

Tables
| Study with year | Design | Country | Study size | Male (%) | Age, mean (years) | Type of valve | Route | STS or Euro score, mean | Quality score*** |
|---|---|---|---|---|---|---|---|---|---|
| *Age separately reported in both groups. **Included in current meta-analysis. ***Criteria used for scoring: proper randomization (score: 1 point), similarity of treatment groups in relevant variables at baseline (1 point), blinding of subjects and investigators (1 point for each), specified eligibility criteria (1 point), valid point estimates and measures of variability (1 point) and data on degree of compliance (1 point). TF: transfemoral; TA: transapical; STS: Society of Thoracic Surgeons score; RCT: randomized controlled trial. | |||||||||
| Fraccaro et al (2015) [2] | Cohort | Italy | 830 | 324 (39.0) | 83.7 (2.8) | Sapien XT core valve | TF | 9.9 (6.7) (Euro) | 7 |
| Mack et al (2019) (Partner 3) [3] | RCT | USA | 950 | 658 (69.2) | 73* | Sapien 3 valve | TF | < 4% (STS) | 7 |
| Popma et al (Evolut low risk) (2019) [4] | RCT | USA | 1,403 | 956 (65.10) | 74* | Bio prosthesis self-expanding valve | TF | 1.9 (0.7) (STS) | 7 |
| Thyregod et al (2015) [12] | RCT | Denmark, Sweden | 280 | 149 (53.2) | 79.1 (4.8) | Core valve | TF, TA | 8.6 (4.8) (Euro) | 5 |
| Schymik et al (2015) [13] | Cohort | Germany | 432 | 211 (48.8) | 78.3 (49.9) | Edwards, Sapien XT, core valve, Symetic ACURATE | TF | 8.8 (2.7) (Euro) | 7 |
| Rosato et al (2016) [14] | Cohort | Finland, Italy | 710 | 415 (58.5) | 80.1 (5.8) | Sapien XT, core valve | TF, TA | 6.3 (2.9) (Euro) | 7 |
| SURTAVI trial [15] (2018) | Cohort | Multiple | 254** | - | - | Core valve (84%) or Evolut R (16%) (Medtronic, Dublin, Ireland) | - | < 3% (STS) | 7 |
| Fraccaro et al (2016) [2] | Rosato et al (2016) [14] | Schymik et al (2015) [13] | Thyregod et al (2015) [12] | Popma et al (2019) [4] | Mack et al (2019) [3] | |
|---|---|---|---|---|---|---|
| DM: diabetes mellitus; CAD: coronary artery disease; MI: myocardial infarction; NYHA: New York Heart Association. | ||||||
| DM (%) | 157 (18.9) | 110 (15.5) | 54 (19.3) | 155 (31.25) | 228 (31) | |
| CAD (%) | 101 (14.2) | 208 (48.1) | - | 137 (27.62) | - | |
| Previous MI (%) | 66 (8.0) ) | 55 (7.7 | 12 (2.8) | 14 (5.0) | 28 (5.6) | 49 (6.6) |
| Chronic lung disease (%) | 136 (16.4) | 39 (9.0) | 33 (11.8) | 25 (5) | 106 (15.07) | |
| Peripheral arteriopathy (%) | 144 (17.3) | 67 (9.4) | 160 (37.0) | 15 (5.4) | - | 55 (7.5) |
| NYHA class III/IV (%) | 488 (58.8) | 362 (51.0) | 131 (46.8) | 263 (53.02) | - | |