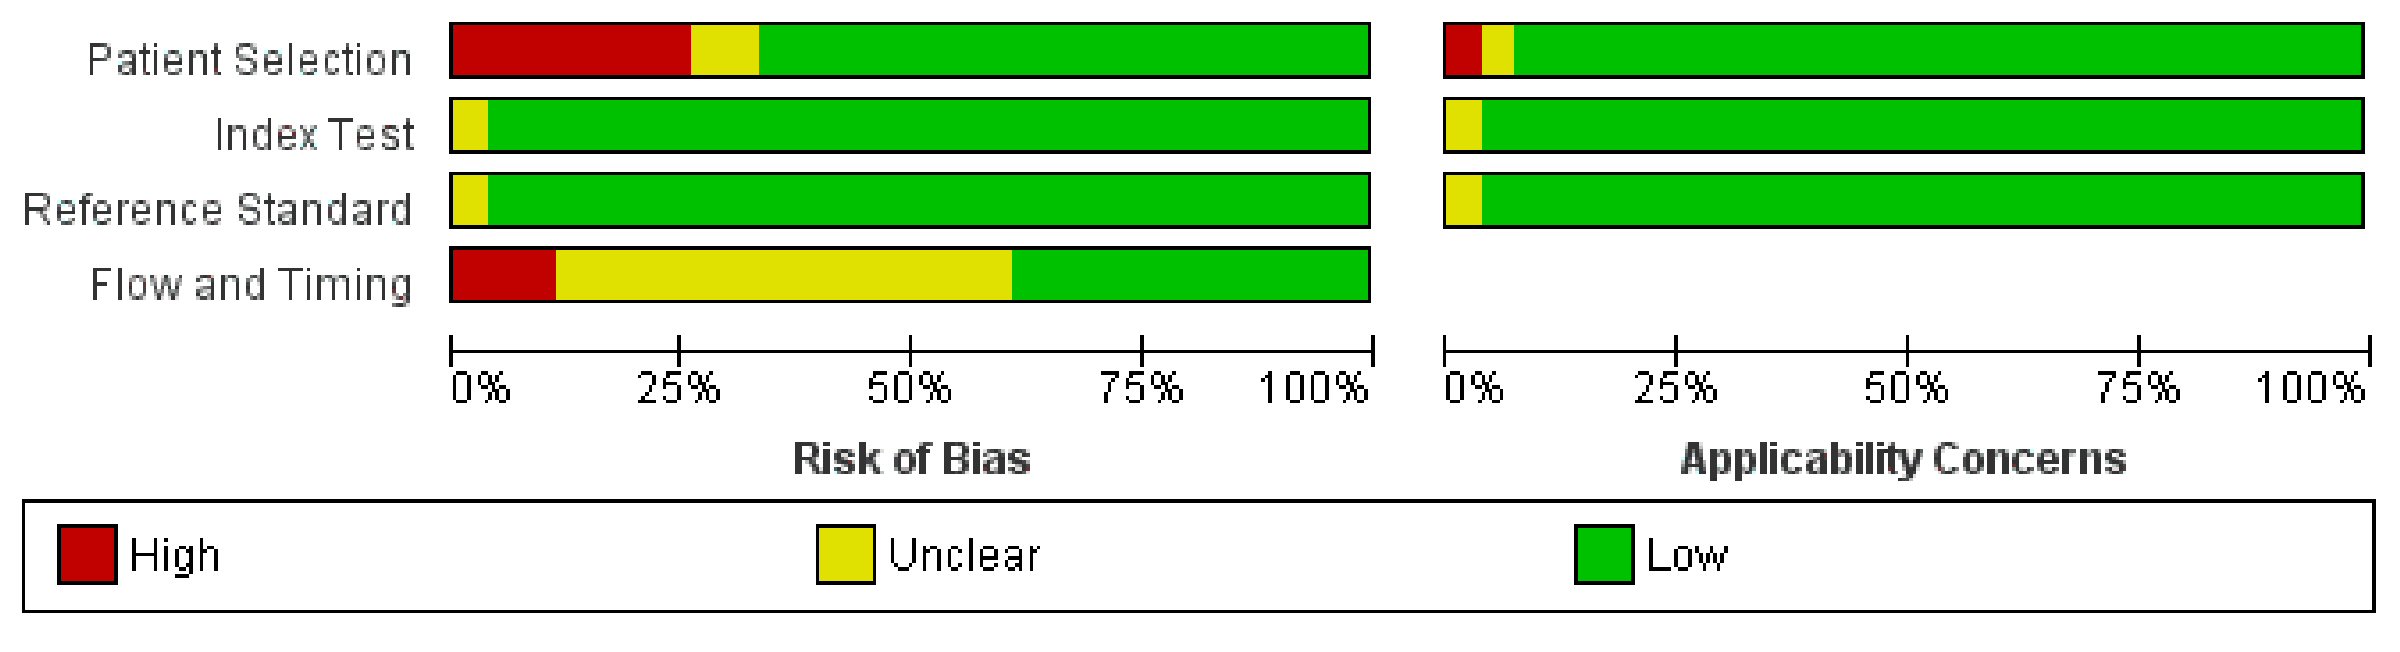
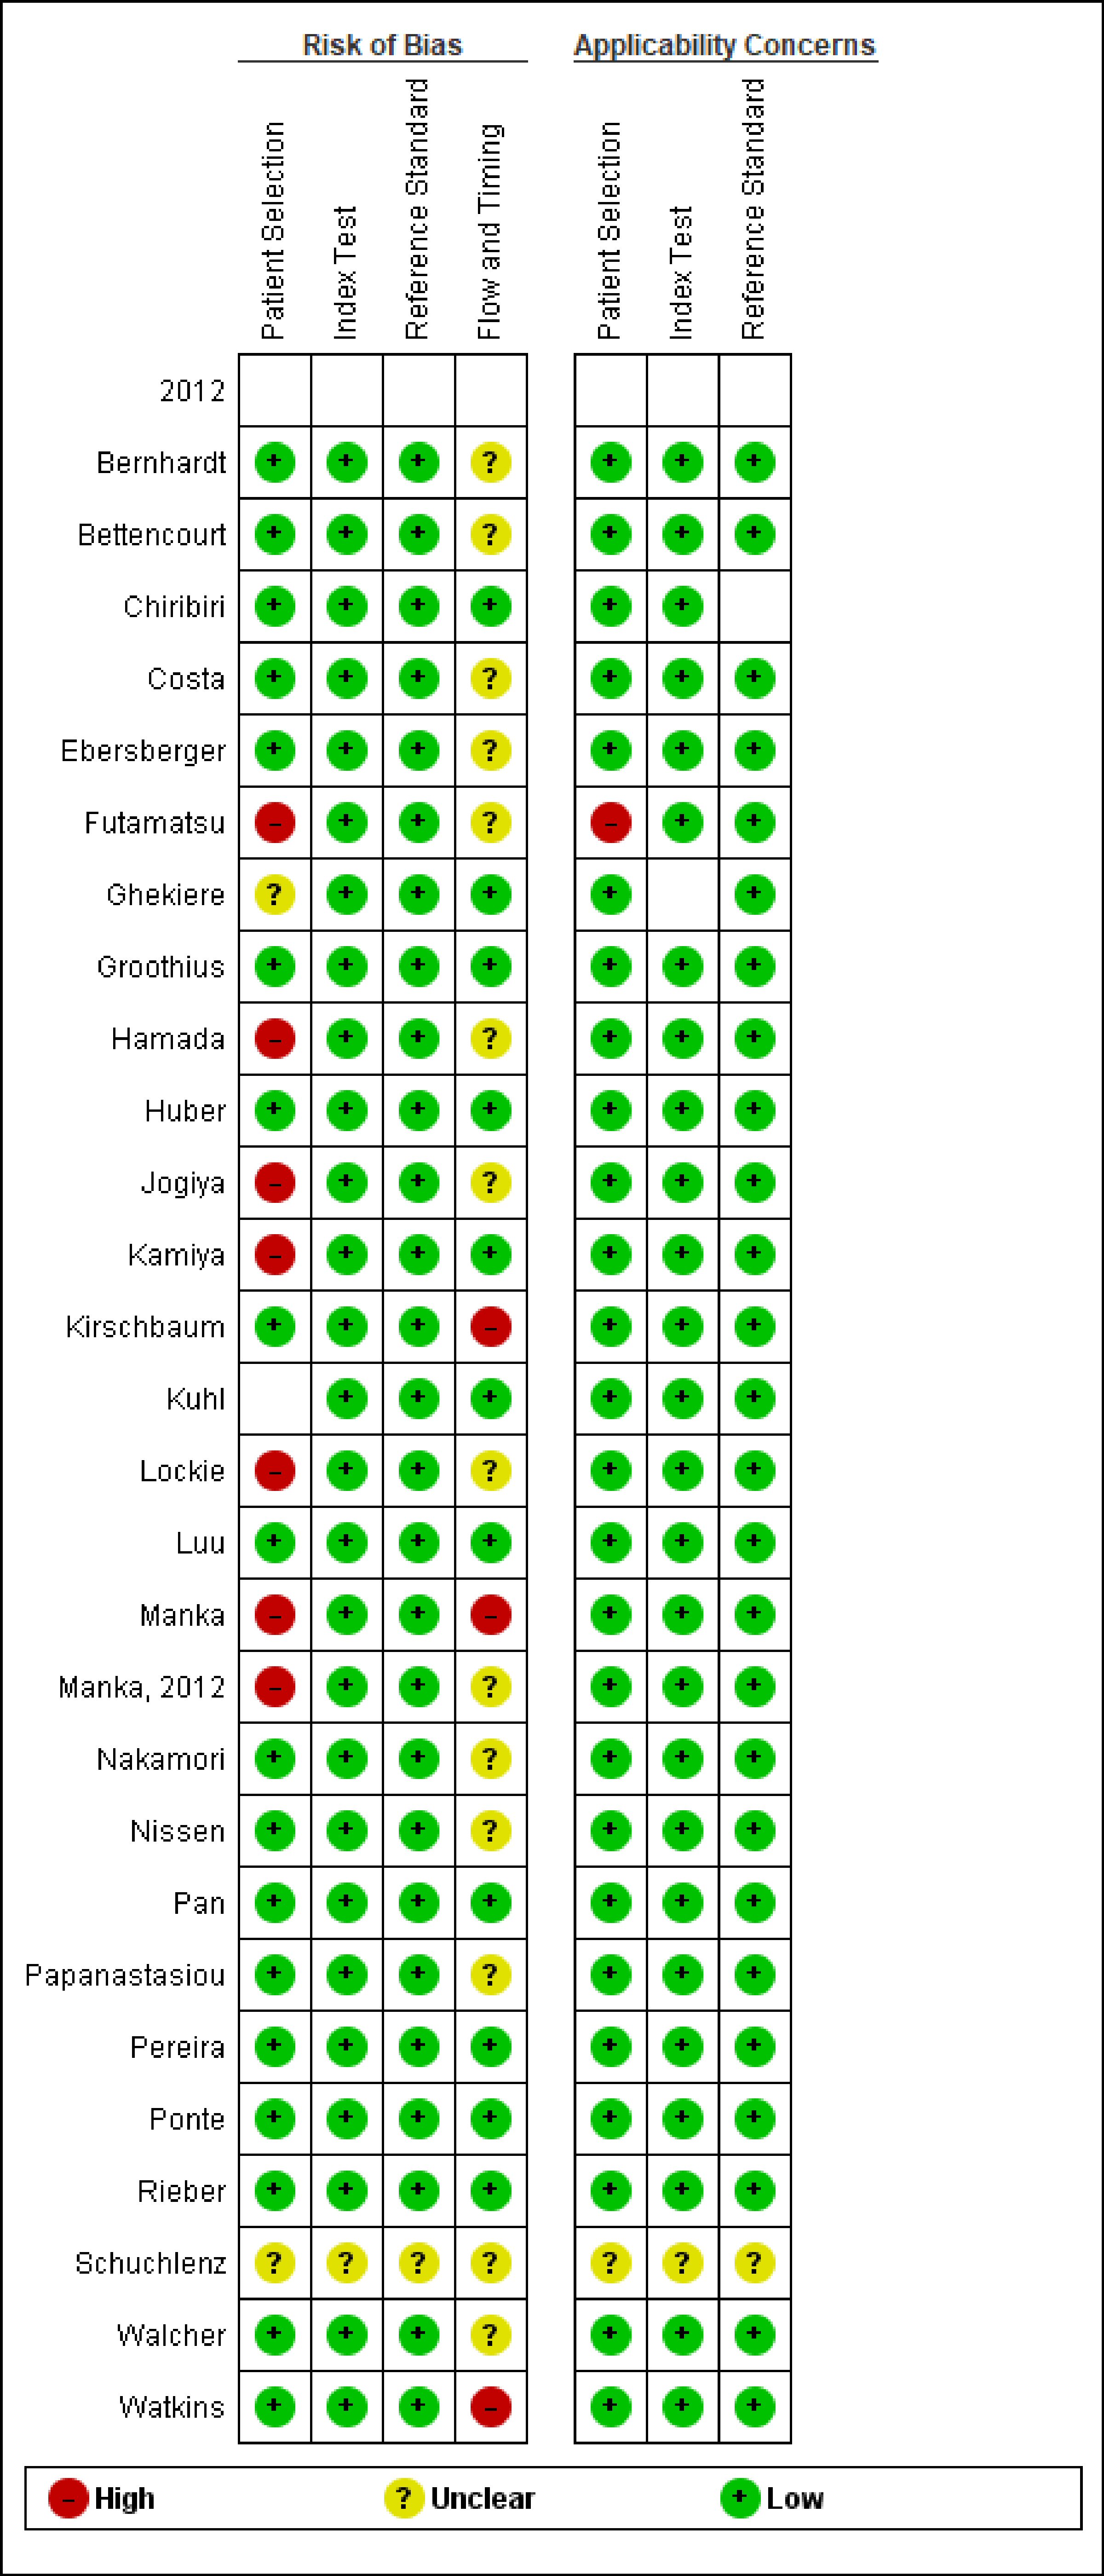
Figure 1. Overall risk of bias on the QUADAS-2 tool of the included studies in our study. QUADAS-2: the Quality Assessment of Diagnostic Accuracy Studies.
| Cardiology Research, ISSN 1923-2829 print, 1923-2837 online, Open Access |
| Article copyright, the authors; Journal compilation copyright, Cardiol Res and Elmer Press Inc |
| Journal website http://www.cardiologyres.org |
Original Article
Volume 11, Number 3, June 2020, pages 145-154
Diagnostic Accuracy of Cardiac Magnetic Resonance Versus Fractional Flow Reserve: A Systematic Review and Meta-Analysis
Figures
Tables
| Variable | Sensitivity (95% CI) | Specificity (95% CI) | DOR |
|---|---|---|---|
| CAD: coronary artery disease; MI: myocardial infarction; 95% CI: 95% confidence interval; DOR: diagnostic odds ratio. | |||
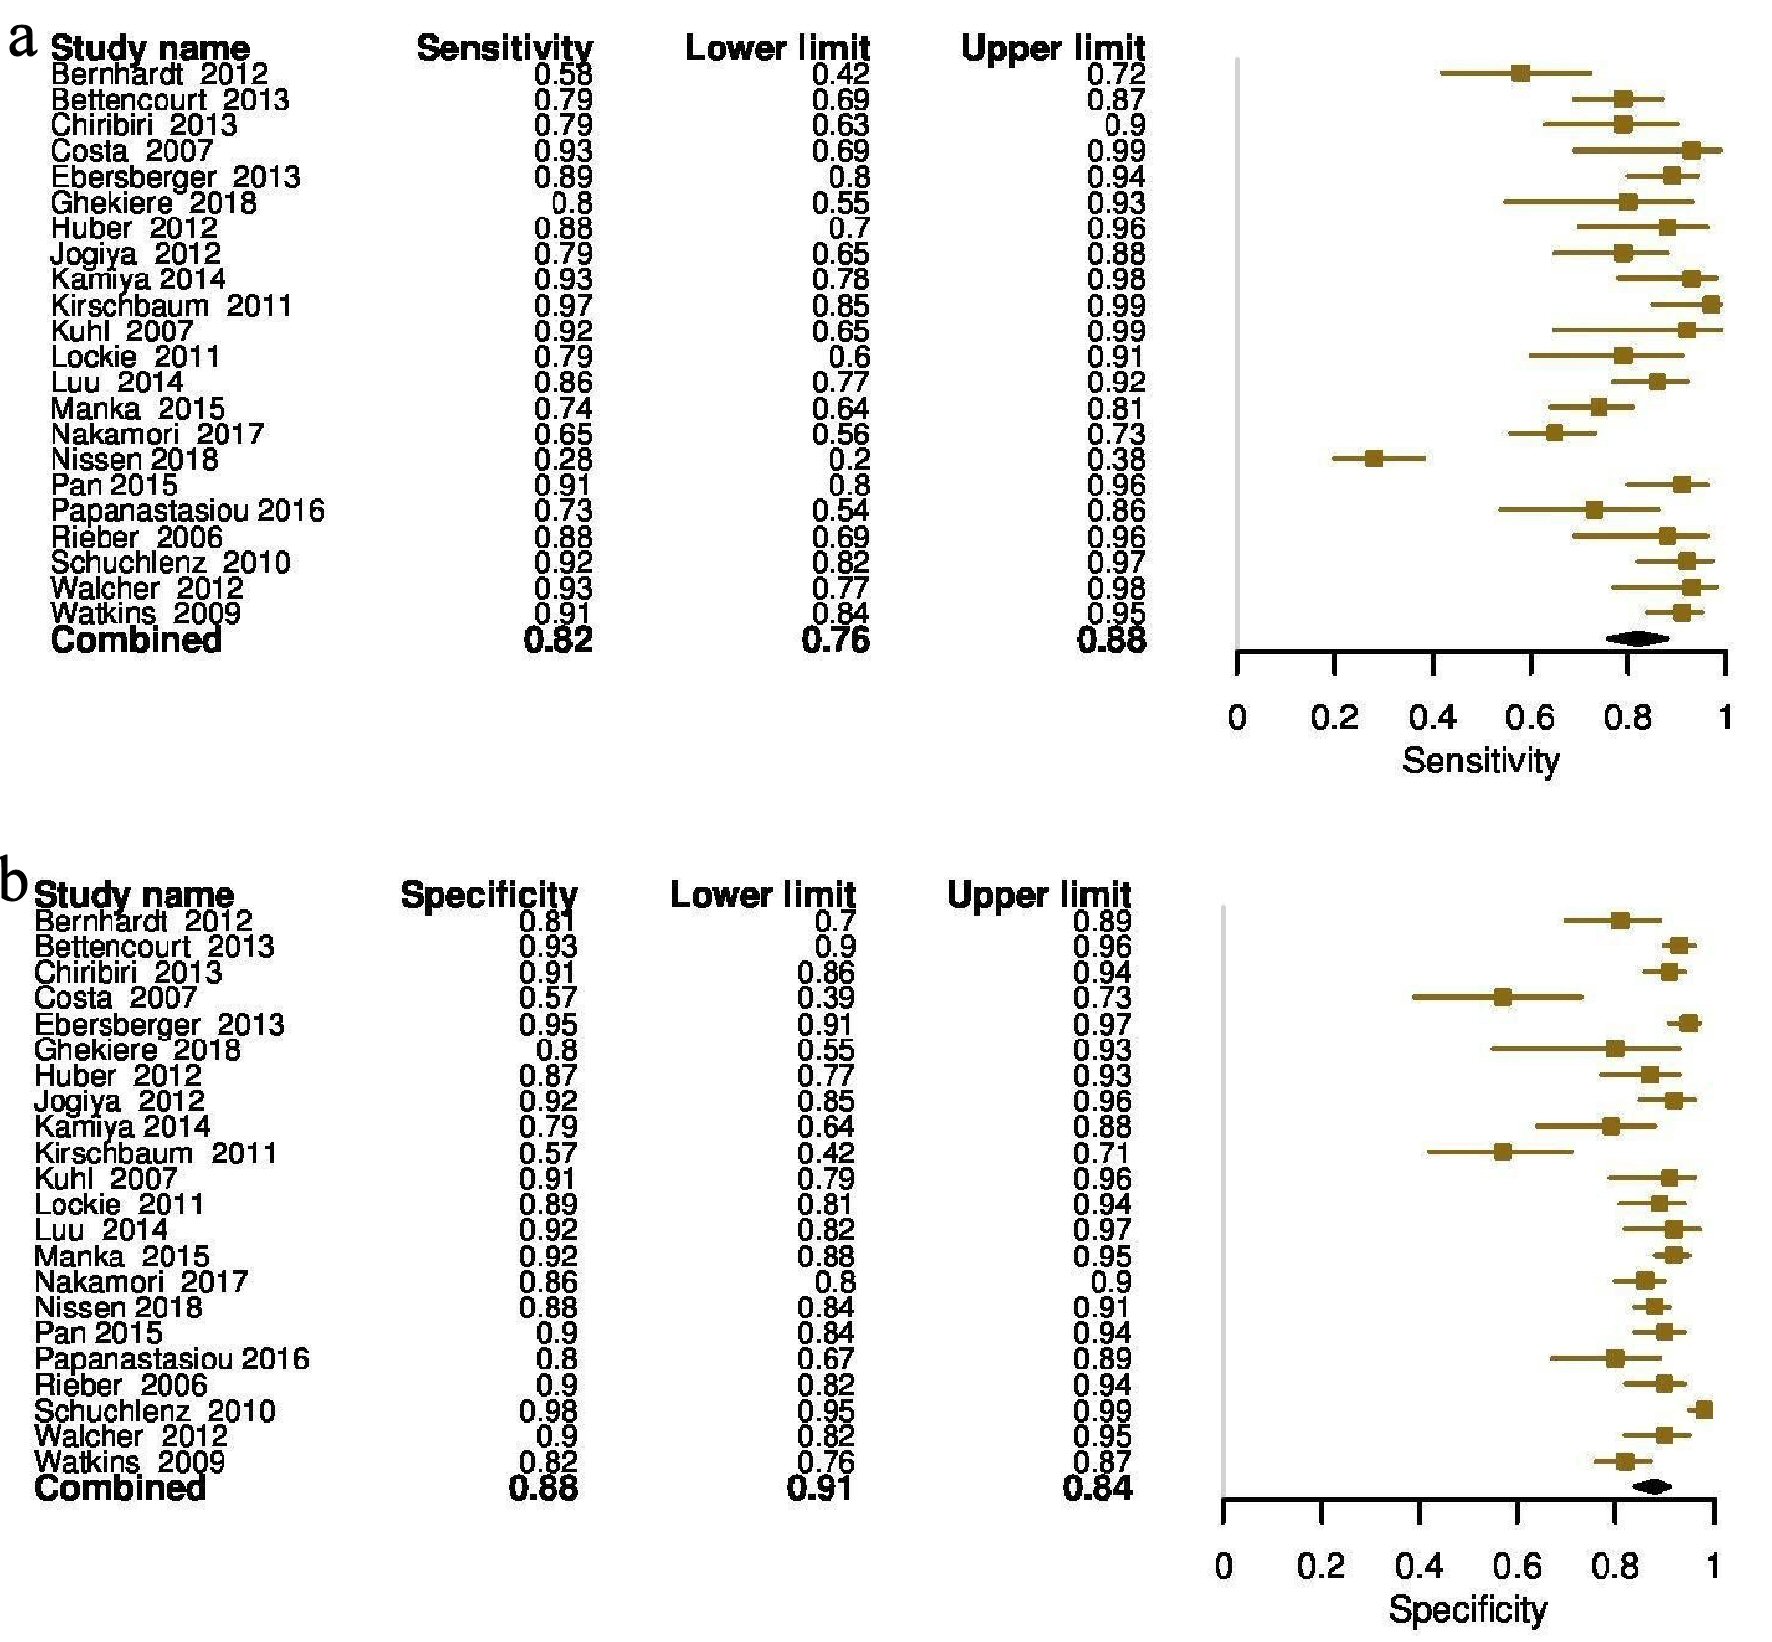
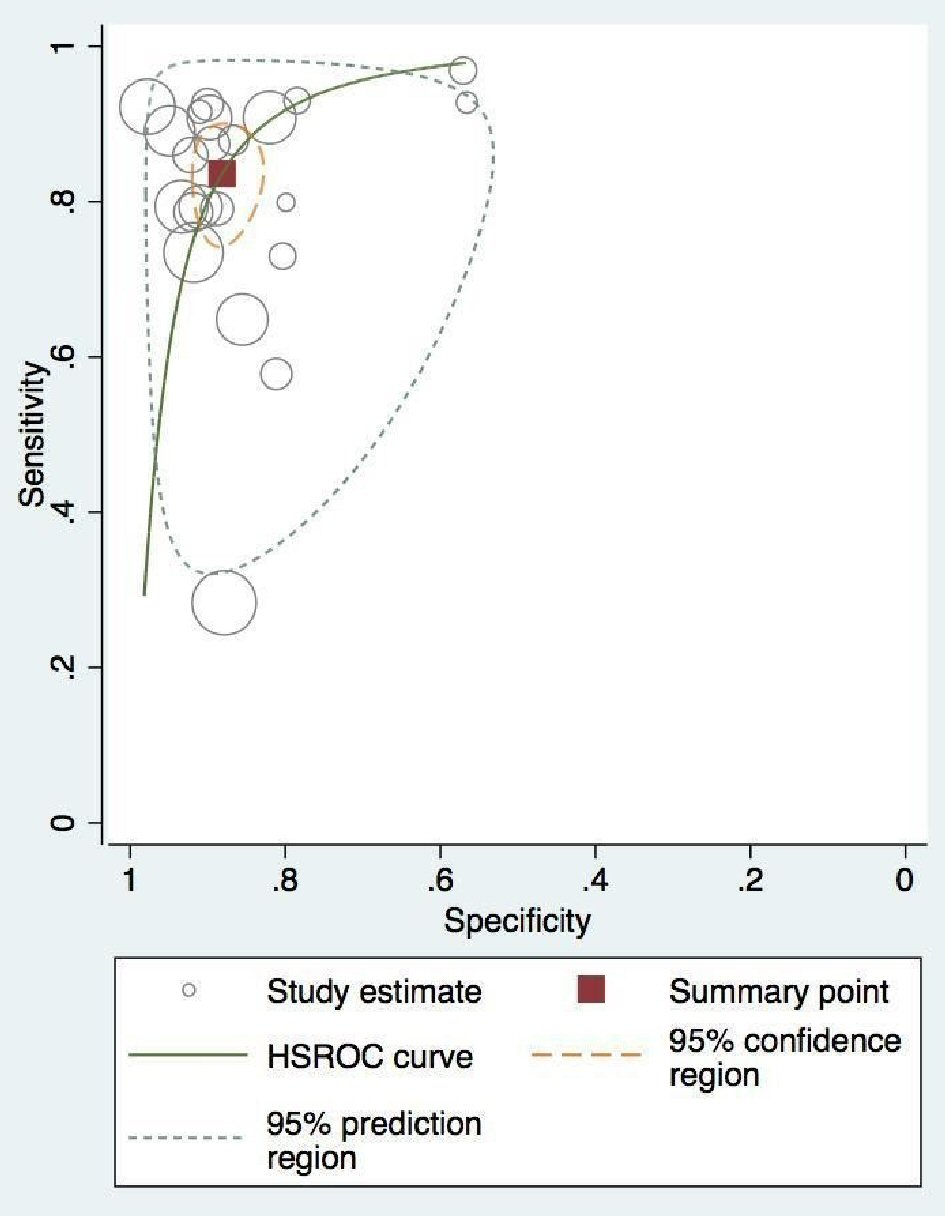
| Vessel level, MI > 60% | 0.84 (0.77 - 0.88) | 0.86 (0.81 - 0.89) | 32 (19 - 53) |
| Patient, MI > 60% | 0.92 (0.88 - 0.94) | 0.94 (0.92 - 0.96) | 12 (10 - 33) |
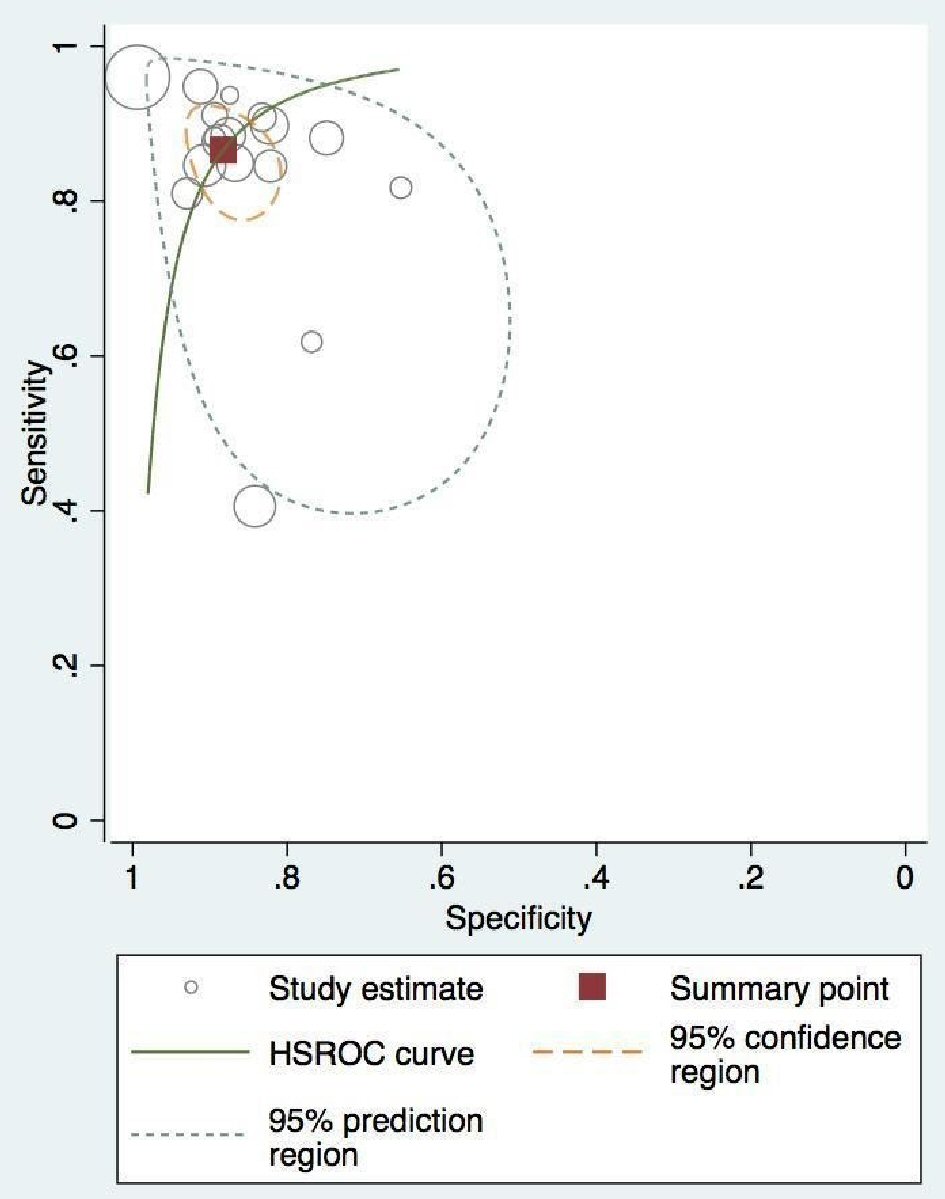
| Vessel level, MI < 60% | 0.81 (0.66 - 0.91) | 0.88 (0.82 - 0.92) | 34 (14 - 80) |
| Patient, MI < 60% | 0.82 (0.74 - 0.89) | 0.84 (0.81 - 0.87) | 27 (15 - 50) |
| Vessel level, Age < 65 | 0.82 (0.74 - 0.88) | 0.89 (0.85 - 0.92) | 34 (14 - 80) |
| Patient, Age < 65 | 0.86 (0.79 - 0.91) | 0.89 (0.85 - 0.93) | 58 (26 - 126) |
| Vessel level, Age > 65 | 0.86 (0.71 - 0.94) | 0.81 (0.72 - 0.88) | 28 (12 - 67) |
| Author | Studies included | Sensitivity, specificity | Limitation | |
|---|---|---|---|---|
| Patient level | Vessel level | |||
| CAD: coronary artery disease. | ||||
| Desai et al, 2013 [33] | 12 | 89.1%, 84.9% | 87.7%, 88.6% | Used 0.75 only |
| Li et al, 2014 [34] | 14 | 90%, 87% | 89%, 86% | No stratification based on thresholds |
| Jiang et al, 2016 [35] | 20 | 88%, 88% | 86%, 88% | No stratification based on thresholds |
| Danad et al, 2017 [36] | 4 | 90%, 94% | 91%, 85% | No stratification based on thresholds |
| Dai et al, 2016 [37] | 21 | 88%, 84% | 87%, 89% | No stratification based on MRI thresholds |
| Yang et al, 2019 [2] | 19 | 87%, 87% | 85%, 89% | CAD 50-75% |