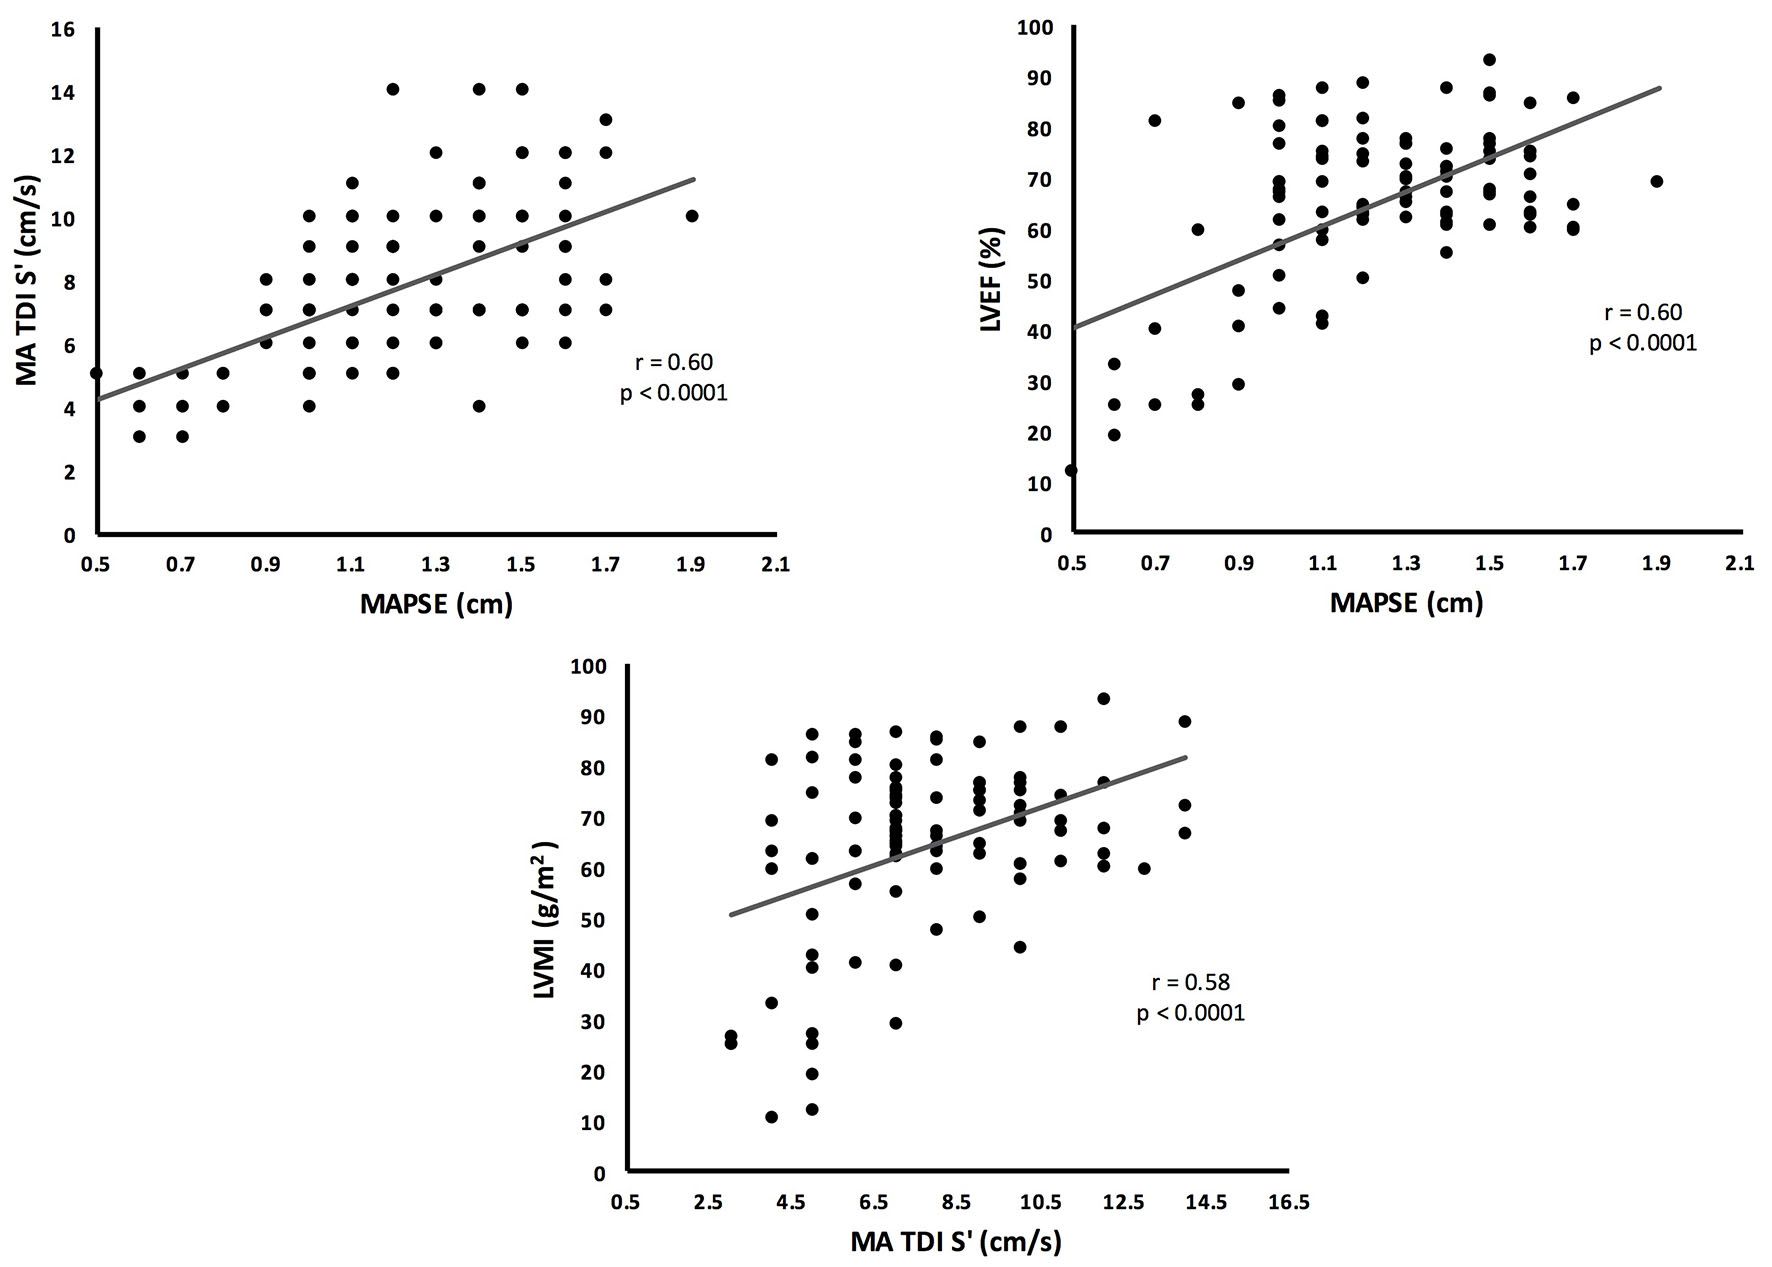
Figure 1. Pearson correlation analysis showing the echocardiographic variables better associated with MAPSE and MA TDI S’.
| Cardiology Research, ISSN 1923-2829 print, 1923-2837 online, Open Access |
| Article copyright, the authors; Journal compilation copyright, Cardiol Res and Elmer Press Inc |
| Journal website https://www.cardiologyres.org |
Short Communication
Volume 8, Number 5, October 2017, pages 228-231
Mitral Annular Dynamics and Left Ventricular Diastole
Figure
Tables
| Variables | Mean | Range |
|---|---|---|
| Age (years) | 53 ± 14 | 24 - 89 |
| BSA (m2) | 2.0 ± 0.3 | 1.4 - 3.2 |
| LVMI (g/m2) | 108 ± 41 | 45 - 234 |
| LAVI (mL/m2) | 27 ± 11 | 10 - 76 |
| MAPSE (cm) | 1.2 ± 0.3 | 0.3 - 1.9 |
| LVESV (cm3) | 51 ± 46 | 5 - 246 |
| LVEDV (cm3) | 125 ± 51 | 38 - 329 |
| LVEF (%) | 64 ± 18 | 11 - 93 |
| MV E (cm/s) | 82 ± 25 | 34 - 183 |
| MV A (cm/s) | 74 ± 32 | 10 - 168 |
| MV E/A ratio | 1.4 ± 1.2 | 0.4 - 10.6 |
| MA TDI S’ (cm/s) | 7.8 ± 2.6 | 3 - 14 |
| MA TDI E’ (cm/s) | 8.6 ± 3.8 | 2 - 21 |
| MA TDI A’ (cm/s) | 8.3 ± 3.2 | 2 - 21 |
| MV E/MA TDI E’ ratio | 11.8 ± 7.8 | 3.6 - 53.0 |
| Variables | MAPSE | MA TDI S’ | ||
|---|---|---|---|---|
| Coefficient | P-value | Coefficient | P-value | |
| Age (years) | -0.006 | 0.003 | -0.005 | 0.770 |
| BSA | -0.005 | 0.953 | -0.465 | 0.457 |
| LVMI | -0.002 | 0.017 | -0.005 | 0.340 |
| LAVI | 0.004 | 0.097 | -0.020 | 0.269 |
| MAPSE | - | - | 1.837 | 0.028 |
| LVESV | -0.008 | < 0.001 | 0.030 | 0.070 |
| LVEDV | 0.005 | < 0.001 | -0.022 | 0.019 |
| LVEF (%) | -0.003 | 0.419 | 0.025 | 0.298 |
| MV E | -0.001 | 0.562 | -0.018 | 0.068 |
| MV A | 0.001 | 0.582 | -0.004 | 0.667 |
| MV E/A ratio | -0.009 | 0.793 | -0.185 | 0.480 |
| MA TDI S’ | 0.031 | 0.028 | - | - |
| MA TDI E’ | 0.004 | 0.762 | 0.425 | < 0.001 |
| MA TDI A’ | 0.011 | 0.198 | 0.243 | < 0.001 |
| MV E/MA TDI E’ ratio | 0.002 | 0.783 | 0.008 | 0.181 |