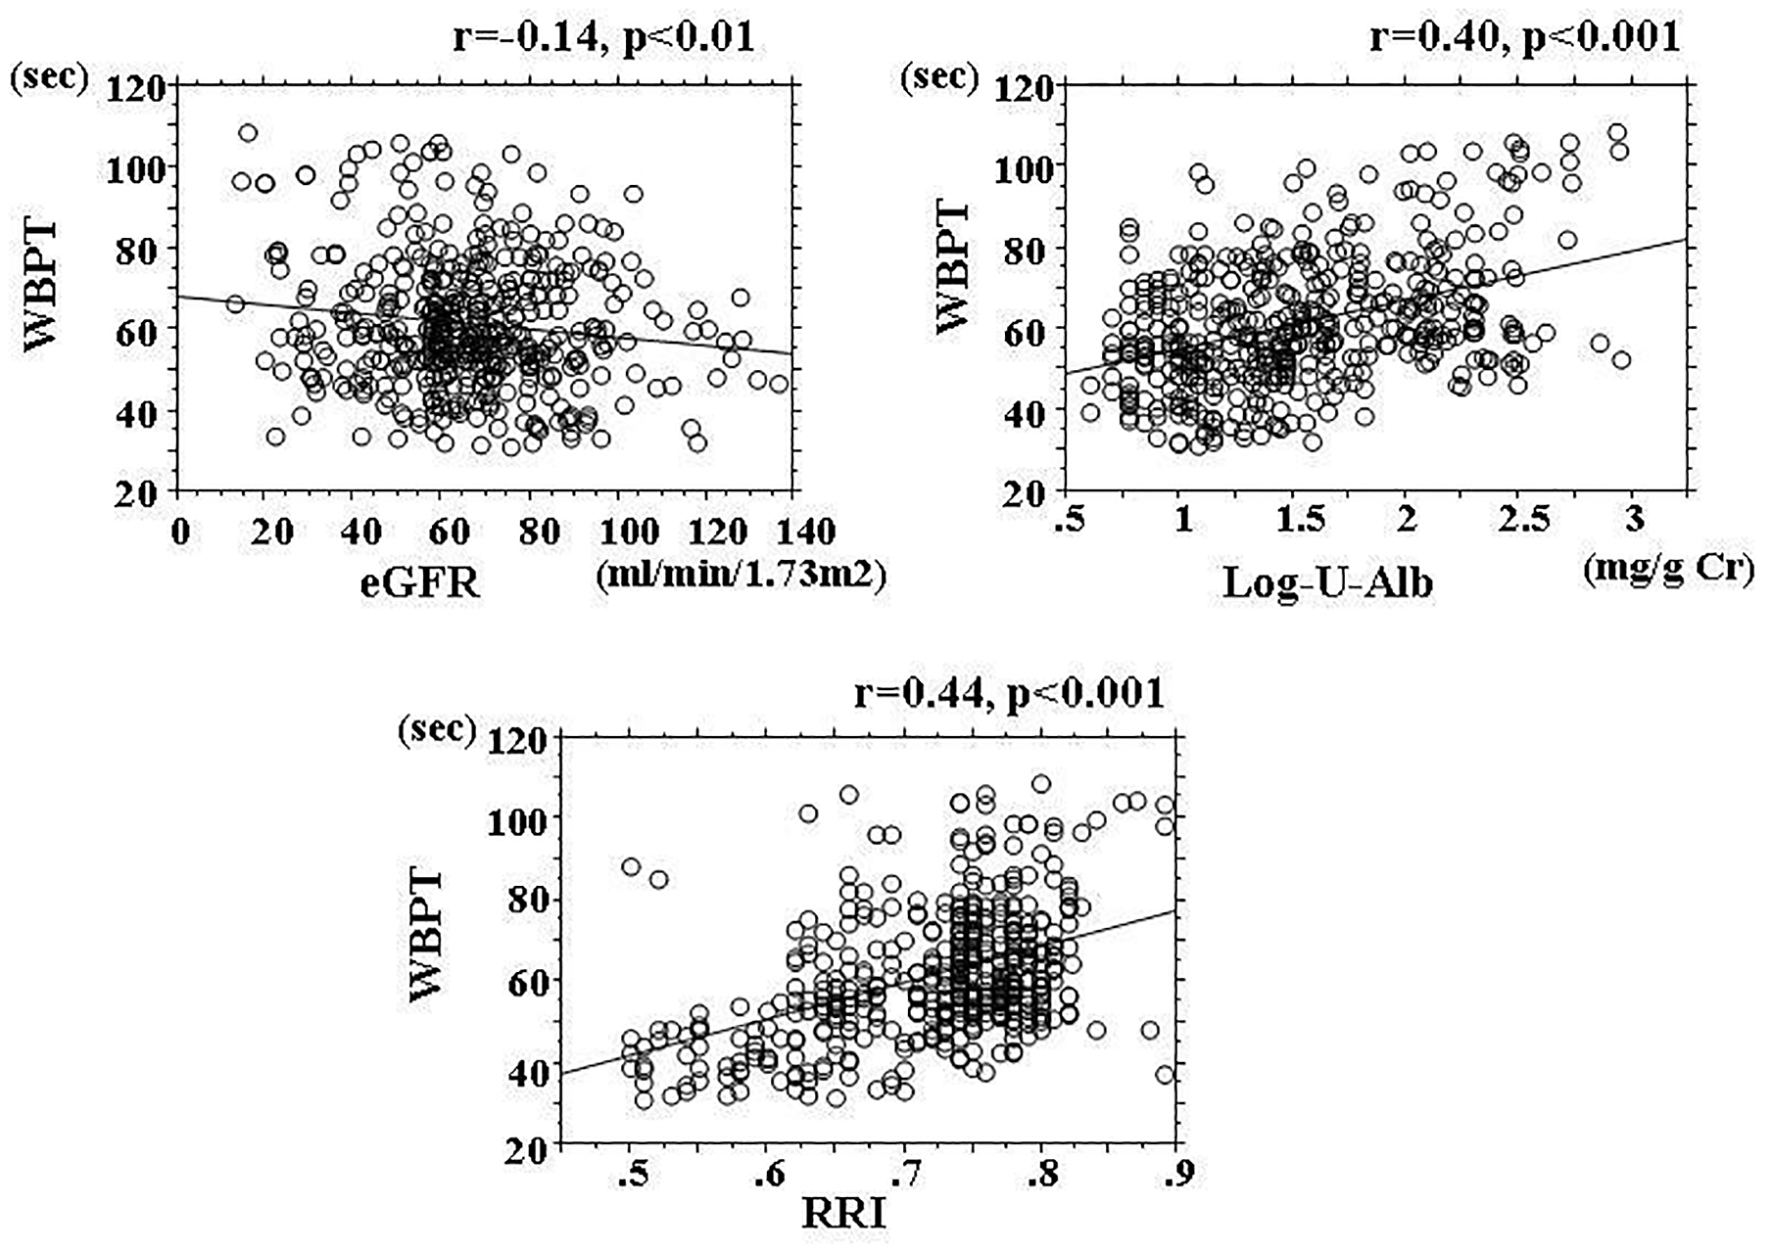
Figure 1. Correlation between WBPT and markers of kidney function. WBPT: whole blood passage time; eGFR: estimated glomerular filtration rate; RRI: renal resistive index.
| Cardiology Research, ISSN 1923-2829 print, 1923-2837 online, Open Access |
| Article copyright, the authors; Journal compilation copyright, Cardiol Res and Elmer Press Inc |
| Journal website https://www.cardiologyres.org |
Original Article
Volume 8, Number 4, August 2017, pages 147-153
Relationship Between Hemorheology Assessed Using Microchannel Array Flow Analyzer and Kidney Function in Hypertensive Patients
Figures
Tables
| Continuous values are mean ± SD. HOMA-IR: homeostasis assessment insulin resistance; LDL: low-density lipoprotein; HDL: high-density lipoprotein; d-ROMs: derivatives of reactive oxygen metabolites; eGFR: estimated glomerular filtration rate; RR: renal resistive index; WBPT: whole blood passage time; RAS: renin-angiotensin system. | |
| n (male/female) | 453 (176/277) |
| Age (years) | 65 ± 13 |
| Body mass index | 23.0 ± 3.7 |
| Current smoker, n (%) | 105 (23) |
| Systolic blood pressure (mm Hg) | 156.4 ± 8.1 |
| Diastolic blood pressure (mm Hg) | 90.4 ± 9.2 |
| Pulse rate (/min) | 66 ± 10 |
| White blood cell (/µL) | 6,580 ± 1,250 |
| Red blood cell (104/µL) | 424 ± 39 |
| Hematocrit (%) | 38.1 ± 3.9 |
| Platelet (104/µL) | 21.6 ± 6.2 |
| Fasting blood glucose (mg/dL) | 113 ± 24 |
| Immunoreactive insulin (µg/mL) | 7.3 ± 4.4 |
| HOMA-IR | 2.1 ± 1.4 |
| Skin autofluorescence (AU) | 2.5±0.6 |
| Total cholesterol (mg/dL) | 212±41 |
| LDL-cholesterol (mg/dL) | 135 ± 36 |
| Triglyceride (mg/dL) | 128 ± 64 |
| HDL-cholesterol (mg/dL) | 52 ± 14 |
| d-ROMs test (U Carr) | 331 ± 96 |
| eGFR (mL/min/1.73 m2) | 66.0 ± 21.2 |
| Log-urinary albumin (mg/g Cr) | 1.69 ± 0.63 |
| RRI | 0.7 ± 0.1 |
| WBPT (s) | 61.2 ± 16.0 |
| Medication | |
| RAS inhibitor, n (%) | 245 (54) |
| Calcium channel blocker, n (%) | 308 (68) |
| β-blocker, n (%) | 36 (8) |
| Statin, n (%) | 236 (52) |
| Eicosapentaenoic acid, n (%) | 18 (4) |
| r | P value | |
|---|---|---|
| r expressed correlation coefficient. HOMA-IR: homeostasis assessment insulin resistance; LDL: low-density lipoprotein; HDL: high-density lipoprotein; d-ROMs: derivatives of reactive oxygen metabolites; eGFR: estimated glomerular filtration rate; RRI: renal resistive index; WBPT: whole blood passage time; RAS: renin-angiotensin system. | ||
| Sex (female = 0, male = 1) | 0.07 | 0.138 |
| Age | 0.06 | 0.189 |
| Body mass index | 0.14 | < 0.01 |
| Current smoker (no = 0, yes = 1) | 0.13 | < 0.01 |
| Systolic blood pressure | 0.03 | 0.469 |
| Diastolic blood pressure | 0.05 | 0.245 |
| Pulse rate | 0.06 | 0.229 |
| White blood cell | 0.06 | 0.238 |
| Red blood cell | 0.10 | < 0.05 |
| Hematocrit | 0.13 | < 0.01 |
| Platelet | 0.08 | 0.065 |
| Fasting blood glucose | 0.11 | < 0.05 |
| Immunoreactive insulin | 0.05 | 0.263 |
| HOMA-IR | 0.06 | 0.187 |
| Skin autofluorescence | 0.41 | < 0.001 |
| Total cholesterol | 0.02 | 0.627 |
| LDL-cholesterol | 0.02 | 0.604 |
| Triglyceride | 0.10 | < 0.05 |
| HDL-cholesterol | 0.08 | 0.601 |
| d-ROMs test | 0.40 | < 0.001 |
| RAS inhibitor (no = 0, yes = 1) | -0.08 | 0.072 |
| CCB (no = 0, yes = 1) | 0.05 | 0.251 |
| Β-blocker (no = 0, yes = 1) | 0.07 | 0.153 |
| Statin (no = 0, yes = 1) | -0.09 | 0.051 |
| Eicosapentaenoic acid (no = 0, yes = 1) | -0.08 | 0.062 |
| Explanatory factor | β | t value | P value |
|---|---|---|---|
| R2 = 0.38, F value = 24.7, P < 0.001, n = 453. WBPT: whole blood passage time; RRI: renal resistive index; d-ROMs: derivatives of reactive oxygen metabolites; eGFR: estimated glomerular filtration rate. | |||
| Log-urinary albumin | 0.33 | 8.3 | < 0.001 |
| RRI | 0.27 | 6.5 | < 0.001 |
| Skin autofluorescence | 0.24 | 5.7 | < 0.001 |
| d-ROMs test | 0.22 | 5.3 | < 0.001 |
| Hematocrit | 0.10 | 2.2 | < 0.05 |
| eGFR | 0.09 | 1.9 | 0.061 |
| Red blood cell | 0.08 | 1.8 | 0.078 |
| Body mass index | 0.06 | 1.6 | 0.104 |
| Current smoker | 0.06 | 1.5 | 0.121 |
| Fasting blood glucose | 0.03 | 0.8 | 0.393 |
| Triglyceride | -0.01 | -0.1 | 0.704 |