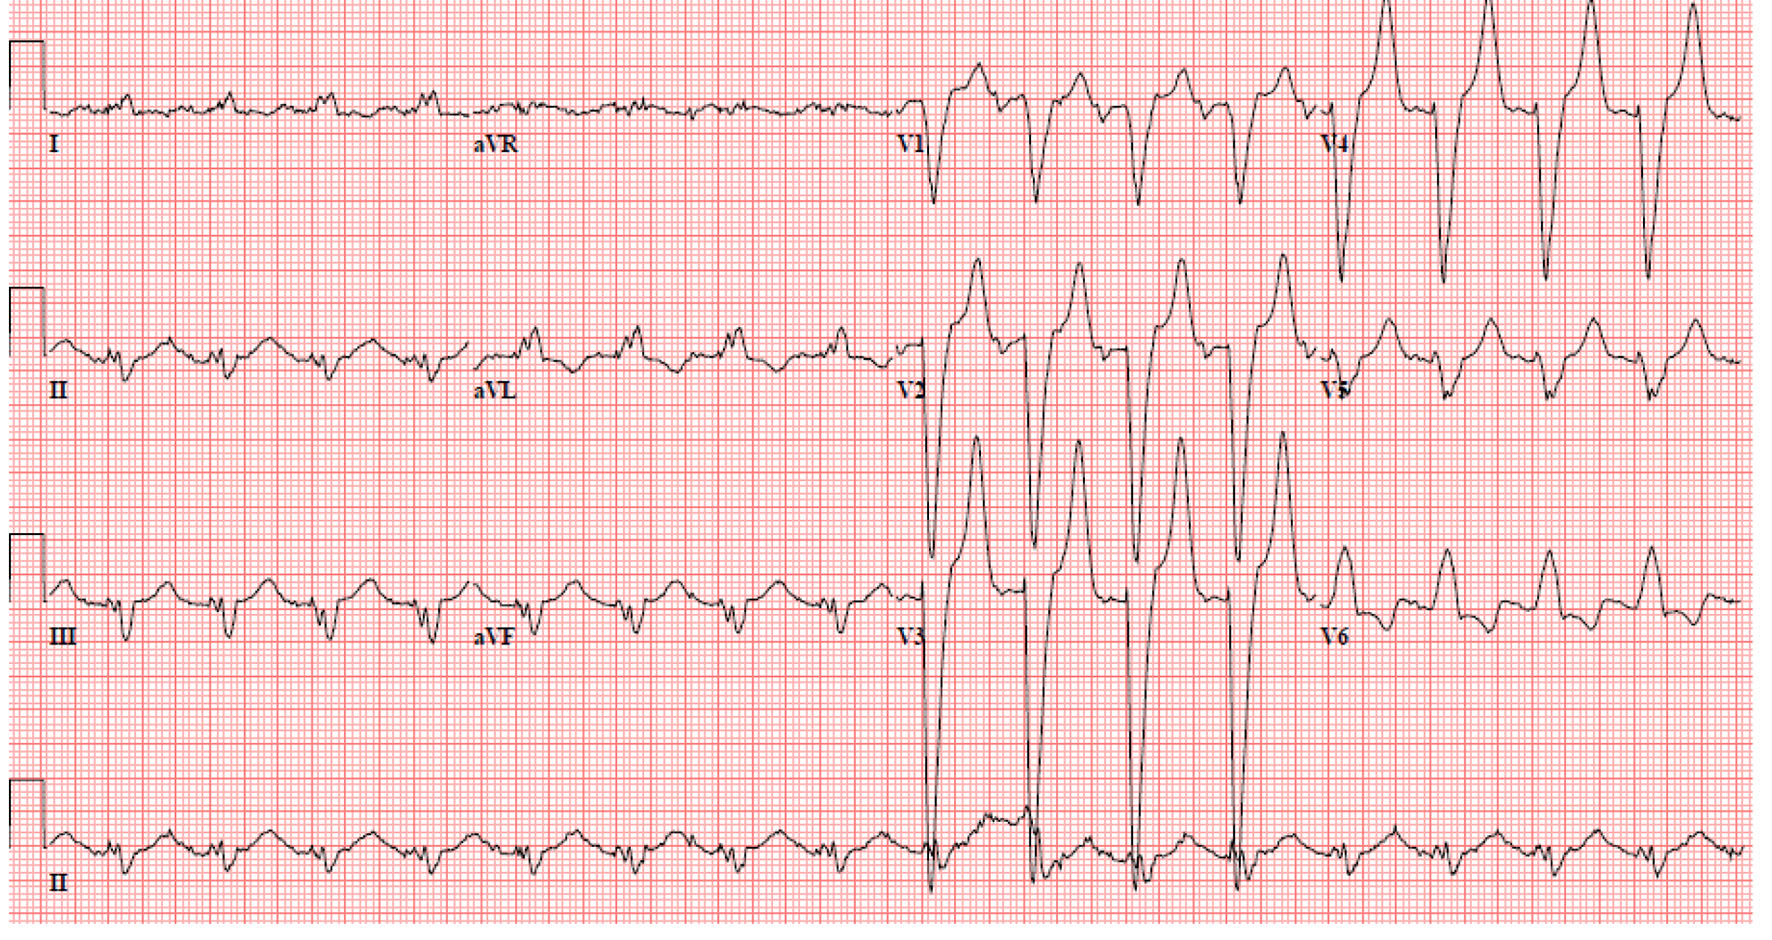
Figure 1. Electrocardiogram showed left bundle branch pattern, along with tall T waves and wide QRS complex.
| Cardiology Research, ISSN 1923-2829 print, 1923-2837 online, Open Access |
| Article copyright, the authors; Journal compilation copyright, Cardiol Res and Elmer Press Inc |
| Journal website https://www.cardiologyres.org |
Case Report
Volume 8, Number 2, April 2017, pages 77-80
Transient Left Bundle Branch Block due to Severe Hyperkalemia
Figures
Table
| Mild hyperkalemia (5.5 - 6.5 mEq/L) | Tall, tent-shaped (“peaked”) T waves with narrow base, best seen in precordial leads |
| Moderate hyperkalemia (6.5 - 8.0 mEq/L) | Peaked T waves, prolonged PR interval, decreased amplitude of P waves, widening of QRS complex |
| Severe hyperkalemia (> 8.0 mEq/L) | Absence of P wave, intraventricular blocks, fascicular blocks, bundle branch blocks, QRS axis shift, progressive widening of the QRS complex resulting in bizarre QRS morphology, Eventual “sine-wave” pattern (sinoventricular rhythm), VF, asystole |