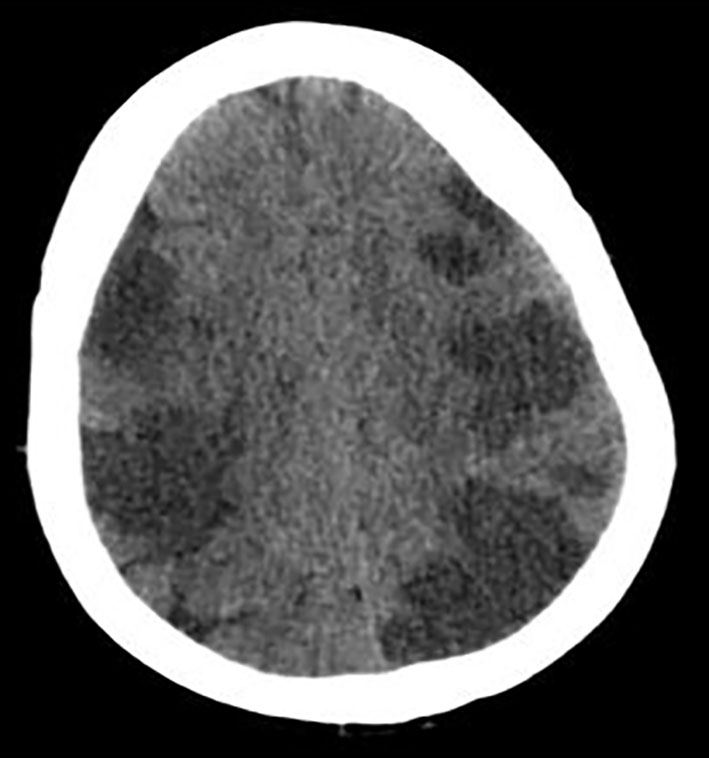
Figure 1. CT of head without contrast showing extensive multifocal areas of hypoattentuation throughout the bilateral frontal, parietal, occipital, and right > left temporal lobes. No mass effect or midline shift or hemorrhage was seen.
| Cardiology Research, ISSN 1923-2829 print, 1923-2837 online, Open Access |
| Article copyright, the authors; Journal compilation copyright, Cardiol Res and Elmer Press Inc |
| Journal website https://www.cardiologyres.org |
Case Report
Volume 8, Number 2, April 2017, pages 57-62
Lupus-Negative Libman-Sacks Endocarditis Complicated by Catastrophic Antiphospholipid Syndrome
Figures
Table
| Lab | Value |
|---|---|
| Sodium, mEq/L | 141 |
| Potassium, mEq/L | 5.2 |
| Chloride, mEq/L | 107 |
| Bicarbonate, mg/dL | 14 |
| BUN, mg/dL | 28 |
| Creatinine, mg/dL | 2.86 |
| Glucose, mg/dL | 186 |
| Creatine kinase (CK), U/L | 8,764 |
| Aspartate aminotransferase (AST), units/L | 3,603 |
| Alanine aminotransferase (ALT), units/L | 220 |
| Alkaline phosphatase, units/L | 83 |
| Bilirubin, mg/dL | 2.4 |
| White blood cell, cells/μL | 26.9 |
| Hemoglobin, g/dL | 13.7 |
| Platelets, 103/μL | 90,000 |
| Peripheral smear | No schistocytes |
| PT, s | 40 |
| INR | 2.5 |
| Fibrinogen, mg/dL | 173 |
| B-type natriuretic peptide (BNP), pg/mL | 2,089 |
| Troponin, ng/mL | 213 |
| Lactate, mg/dL | 10.3 |
| Urine drug screen | Negative |
| Alcohol level, mg/dL | Negative |
| Acetaminophen level, μg/mL | Negative |
| C-reactive protein (CRP), mg/dL | 10.6 |
| Erythrocyte sedimentation rate (ESR), mm/h | 25 |
| Complement component 3 (C3), mg/dL | 42 |
| Complement component 4 (C4), mg/dL | 7.5 |
| Lupus anticoagulant | Positive |
| Anti-cardiolipin IgA, IgG, IgM | Negative |
| Anti-B-2 glycoprotein IgA, IgG, IgM | Negative |
| Prothrombin genotype | No mutation |
| Myeloperoxidase Ab, U | < 0.2 |
| Serine proteinase 3 Ab, U | < 0.2 |
| Rheumatoid factor (RF), IU/mL | < 10 |
| Antinuclear antibodies (ANA) screen, U | Negative |
| Anti-centromere Ab, U | < 0.2 |
| Anti-dsDNA, IU/mL | 1 |
| Chromatin Ab IgG, AI | < 0.2 |
| Jo 1 Ab IgG, U | < 0.2 |
| Ribonucleoprotein (RNP) Ab, U | < 0.2 |
| Ribosomal P protein, U | < 0.2 |
| Scl-70 Ab, U | < 0.2 |
| Smith Ab, U | < 0.2 |
| Sjogren’s syndrome A, U | < 0.2 |
| Sjogren’s syndrome B, U | < 0.2 |