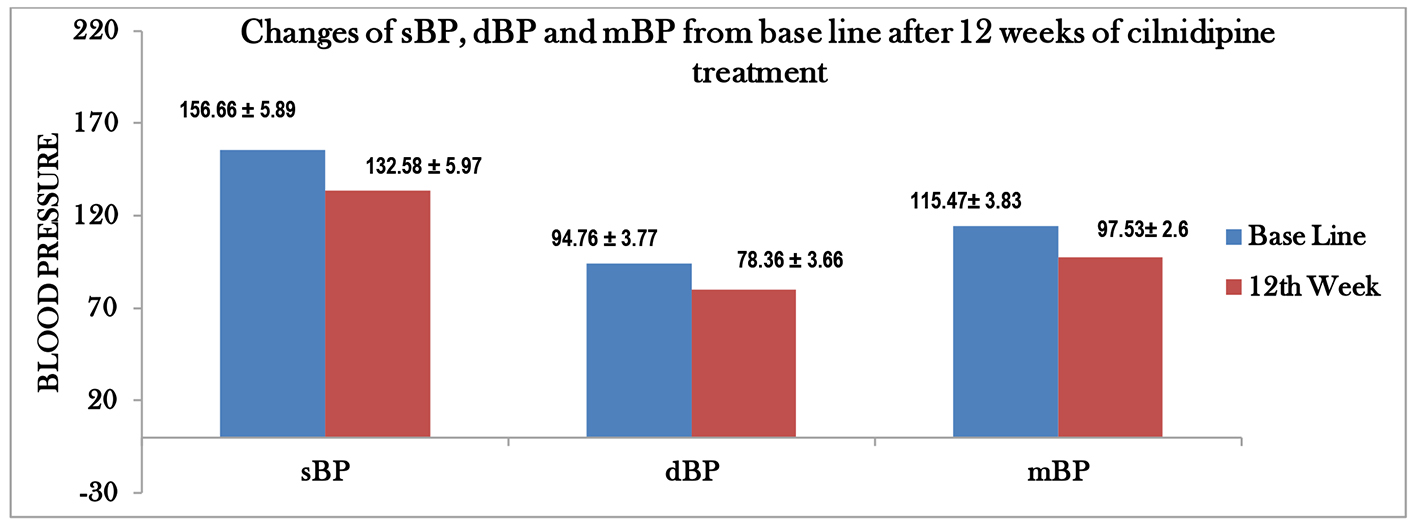
Figure 1. Graphical representation of changes of SBP, DBP and mean BP from baseline after 12 weeks of cilnidipine treatment.
| Cardiology Research, ISSN 1923-2829 print, 1923-2837 online, Open Access |
| Article copyright, the authors; Journal compilation copyright, Cardiol Res and Elmer Press Inc |
| Journal website https://www.cardiologyres.org |
Original Article
Volume 7, Number 5, October 2016, pages 173-177
Serum Triglyceride Lowering Effect of Cilnidipine in Patients With Essential Hypertension
Figures
Tables
| N | 37 |
| Male | 22 |
| Female | 15 |
| Age (years) | 54.17 ± 3.35 |
| Body weight (kg) | 69.54 ± 7.65 |
| Height (cm) | 160.55 ± 5.19 |
| BMI | 27.31 ± 3.7 |
| Baseline | 12th week | P | |
|---|---|---|---|
| *Significant. | |||
| SBP | 156.66 ± 5.89 | 132.58 ± 5.97 | 0.00* |
| DBP | 94.76 ± 3.77 | 78.36 ± 3.66 | 0.00* |
| Mean BP | 115.47 ± 3.83 | 97.53 ± 2.6 | 0.00* |
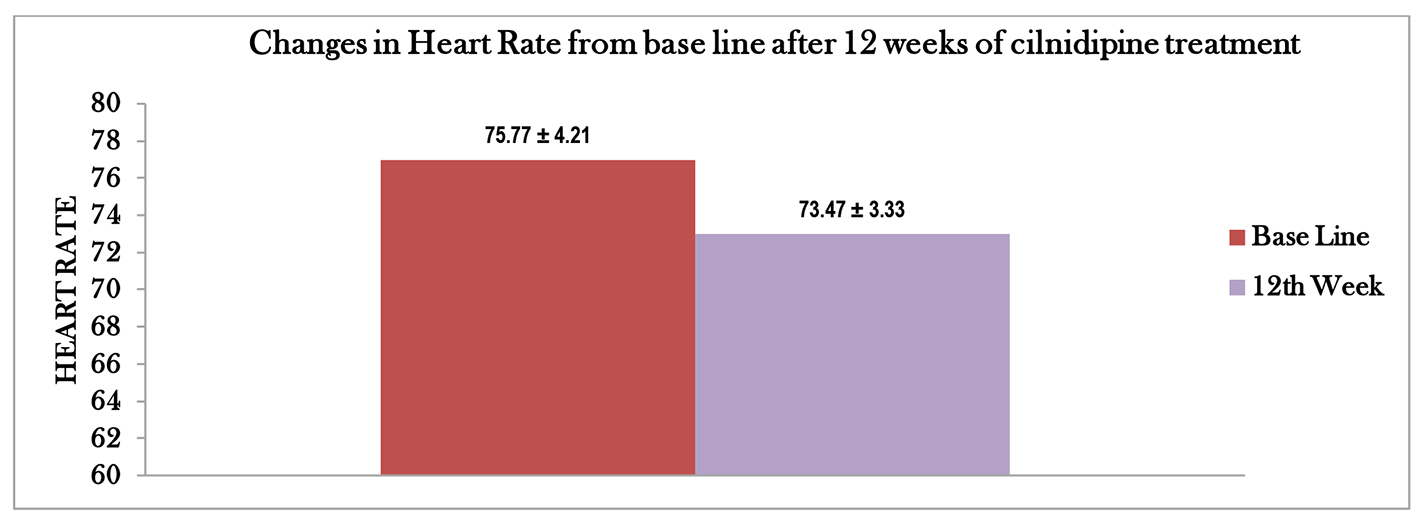
| Heart fate | 75.77 ± 4.21 | 73.47 ± 3.33 | 0.00* |
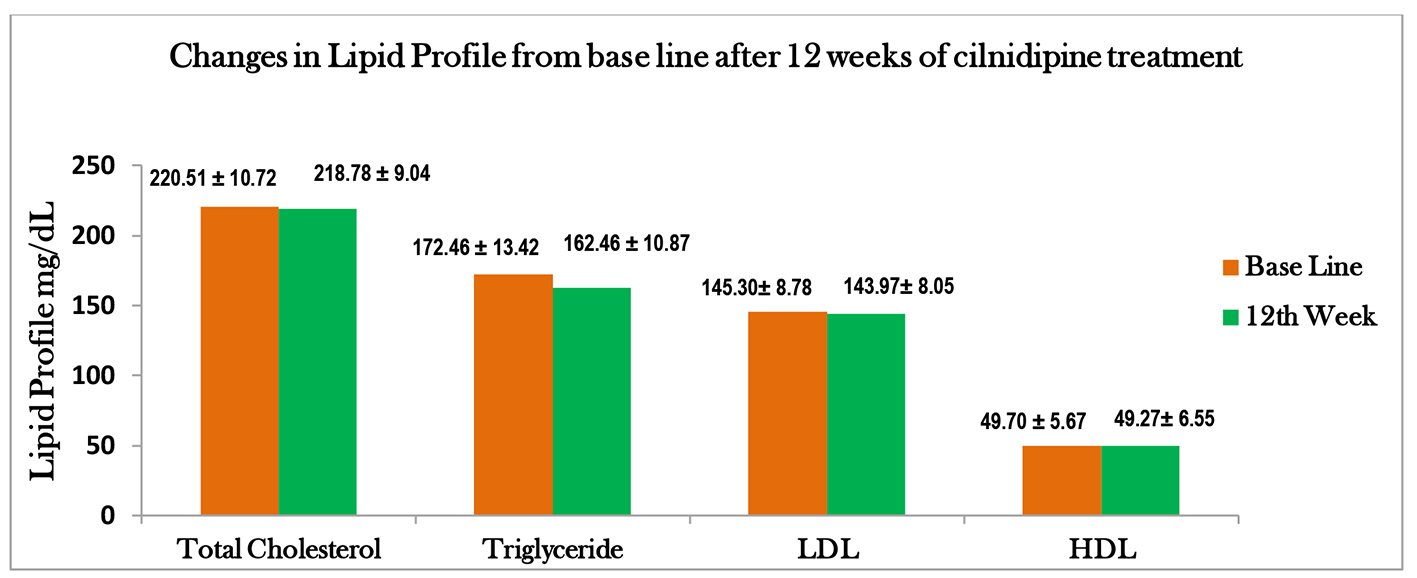
| Total cholesterol | 220.51 ± 10.72 | 218.78 ± 9.04 | 0.45 |
| Triglyceride | 172.46 ± 13.42 | 162.46 ± 10.87 | 0.00* |
| LDL | 145.30 ± 8.78 | 143.97 ± 8.05 | 0.49 |
| HDL | 49.70 ± 5.67 | 49.27 ± 6.55 | 0.76 |