Figures
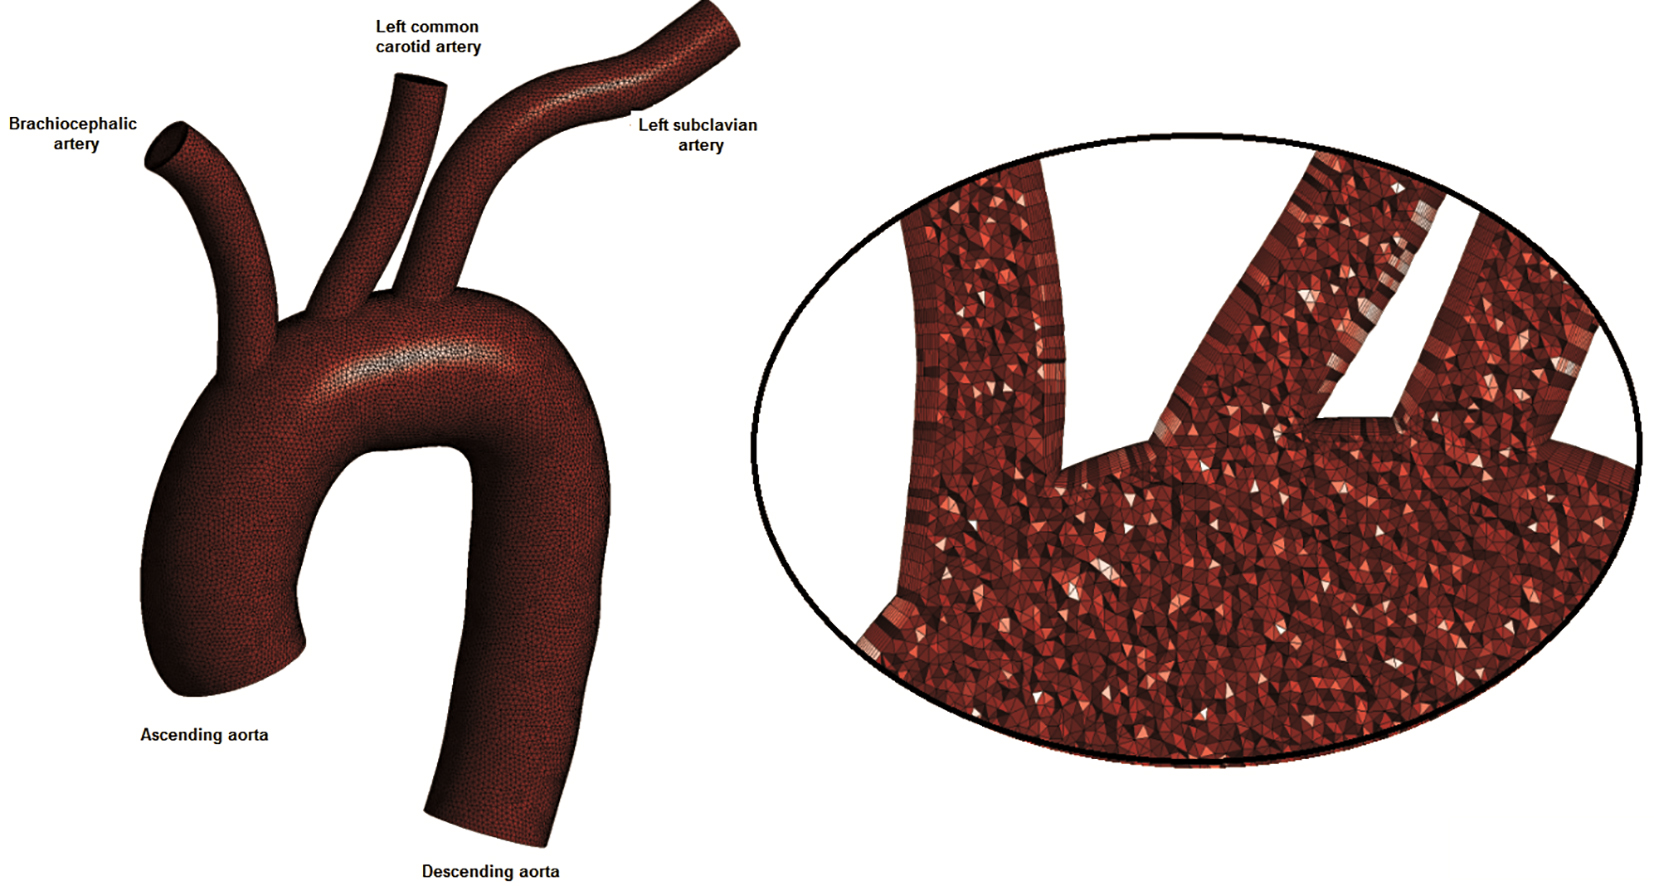
Figure 1. The computational model: ascending aorta, descending aorta, brachiocephalic artery, left common carotid artery and left subclavian artery. Sparse grid is shown.
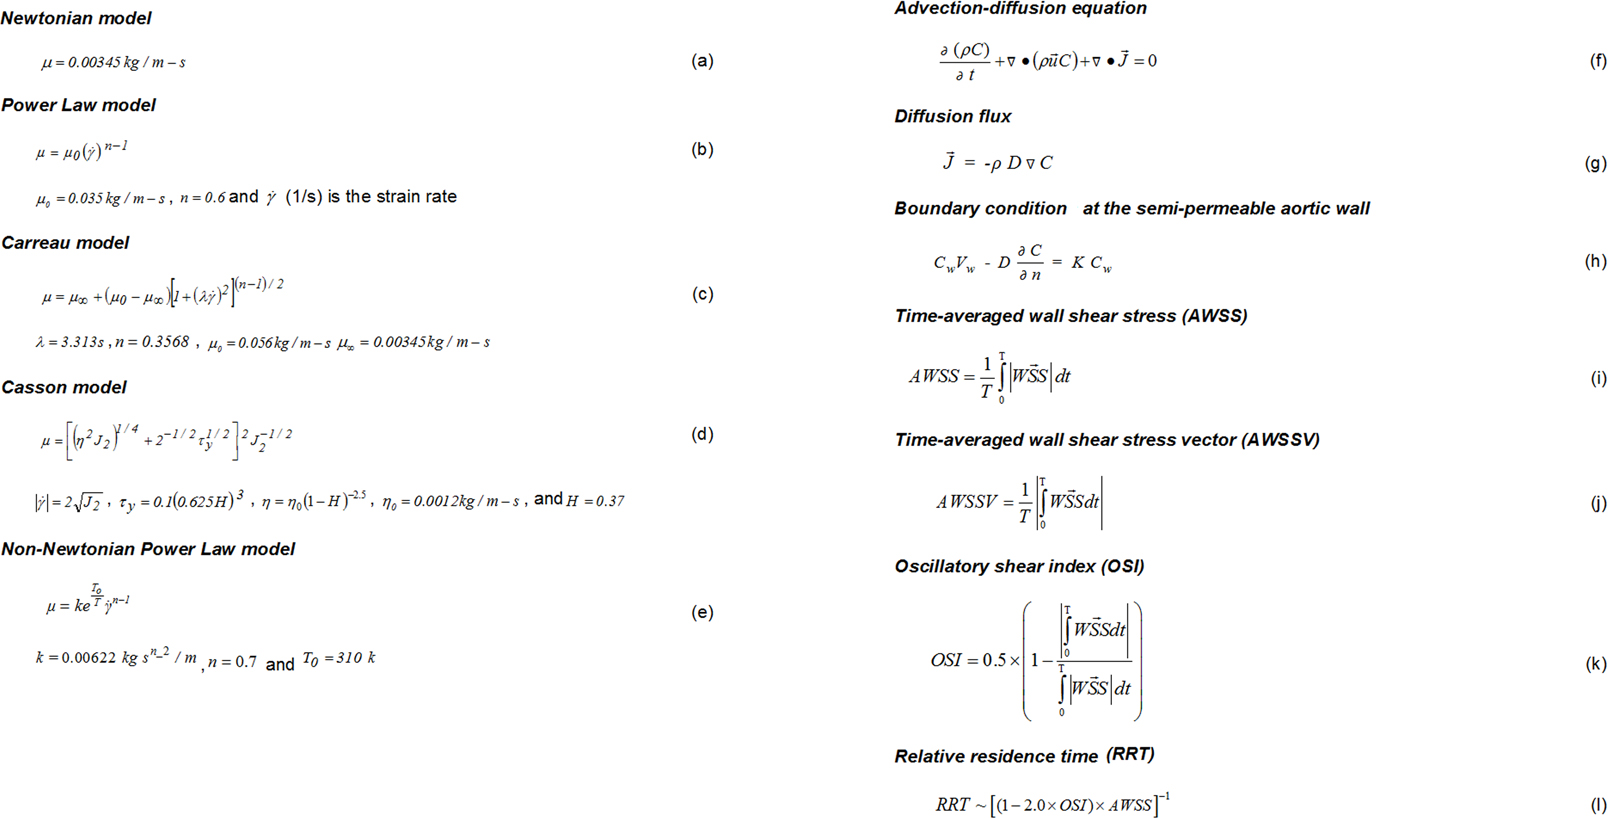
Figure 2. Summary of equations used in the present study.
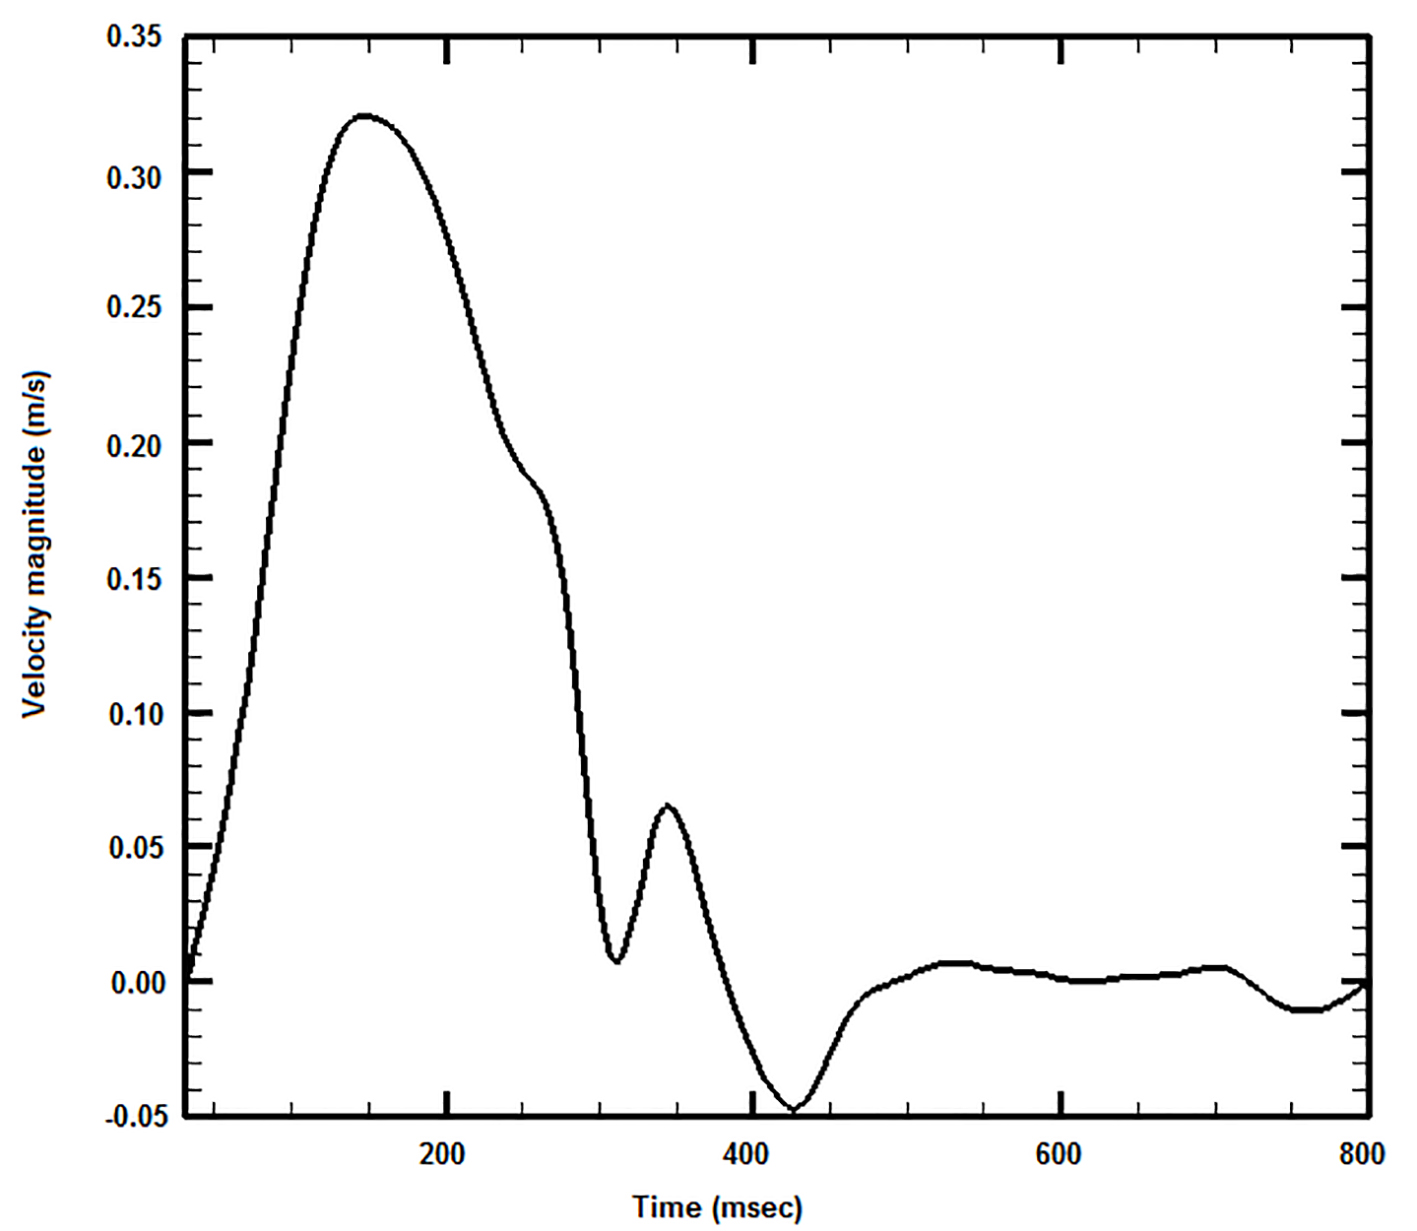
Figure 3. Applied blood waveform at the aortic arch inlet.
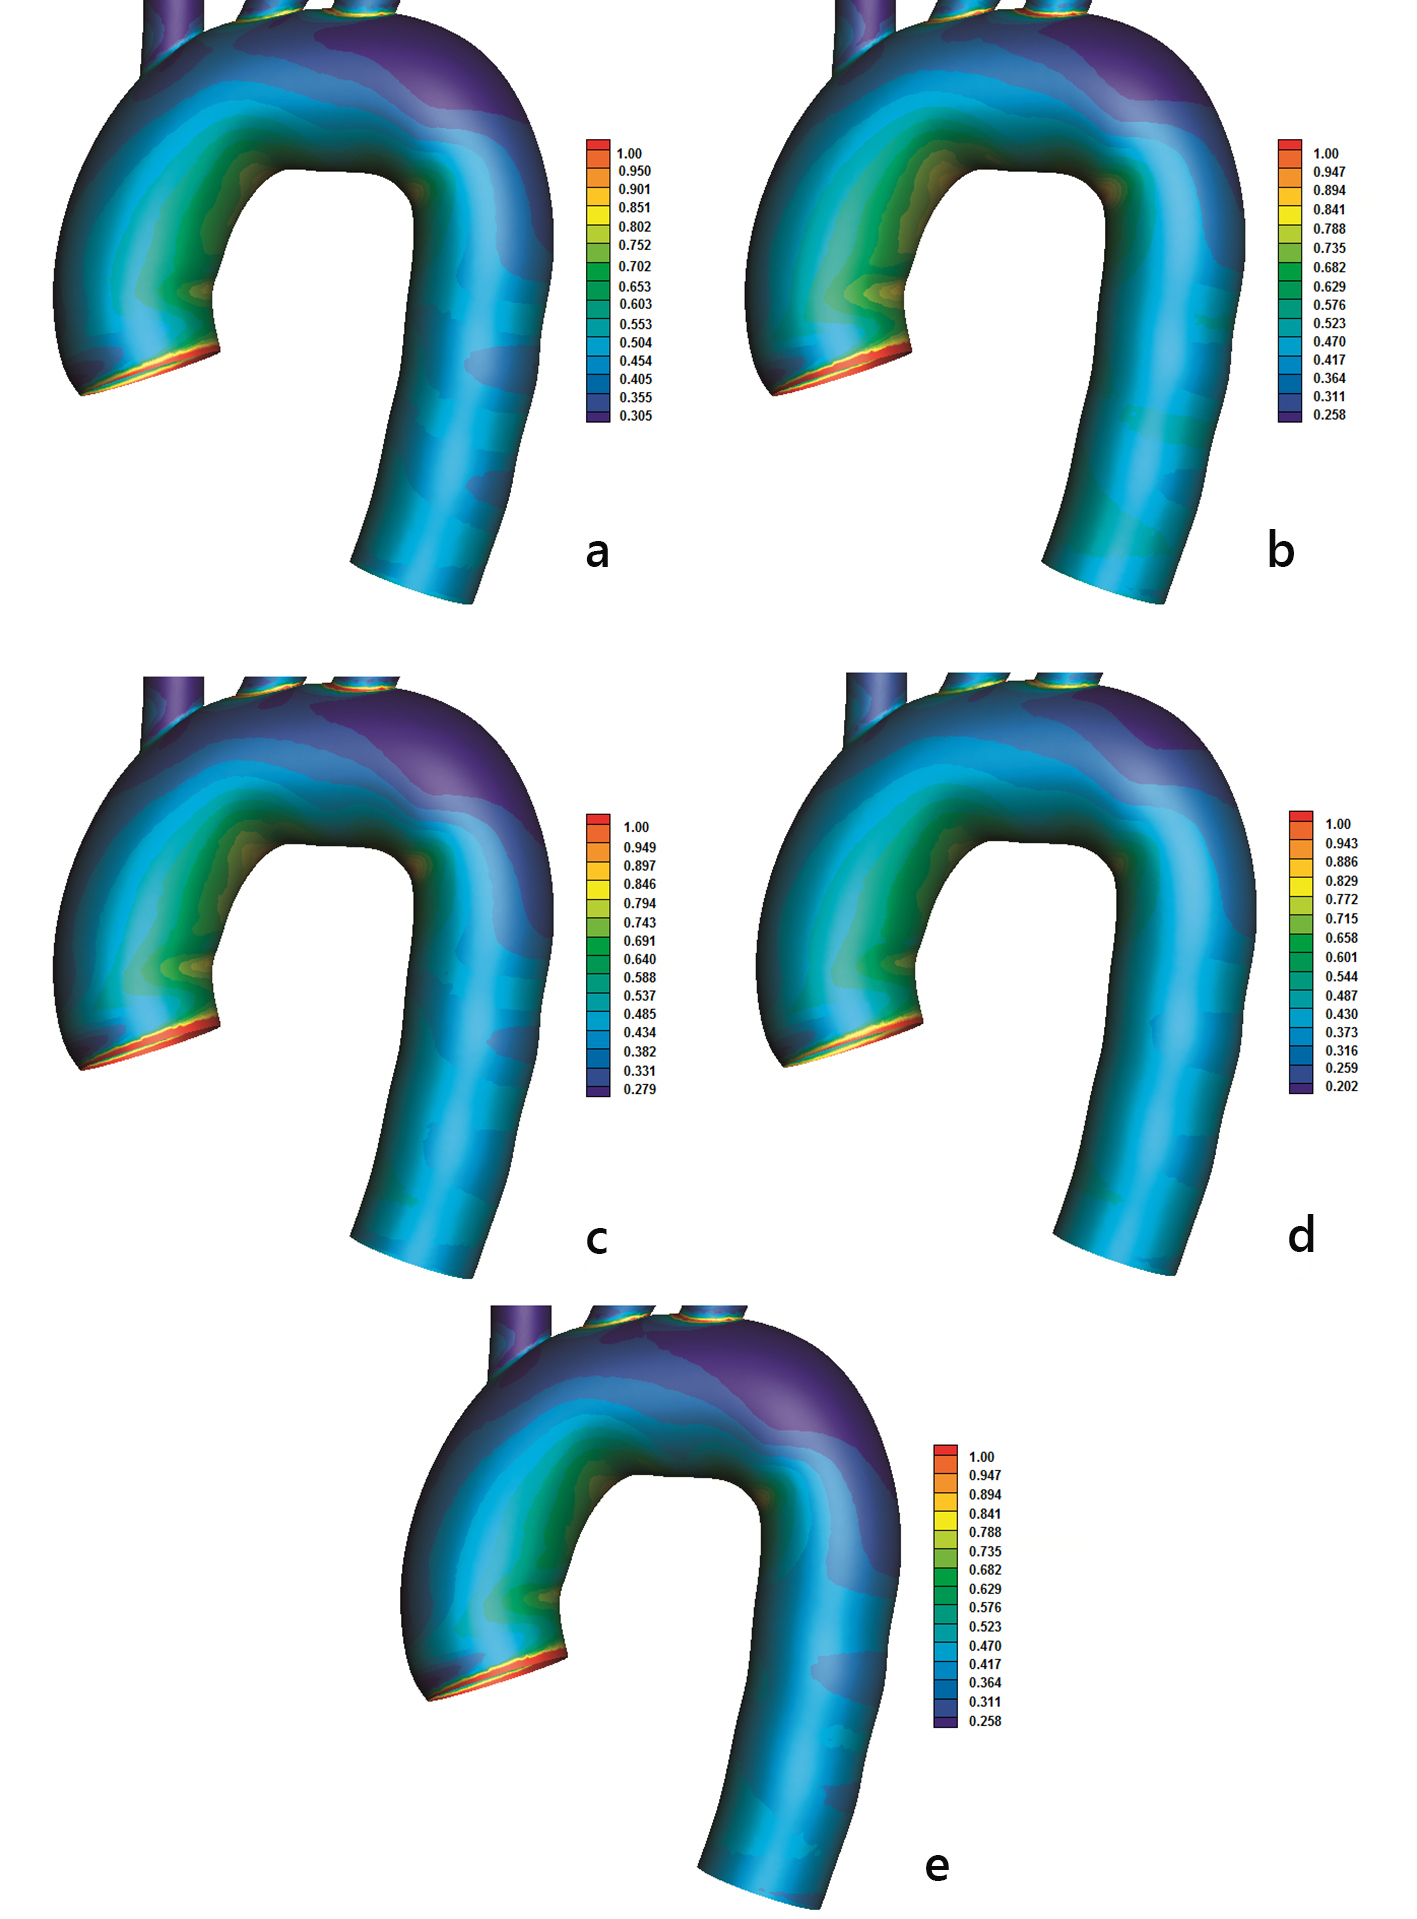
Figure 4. Time-averaged wall shear stress (AWSS) (N/m2) magnitude with (a) power, (b) Carreau, (c) Casson, (d) non-Newtonian power and (e) Newtonian law models.
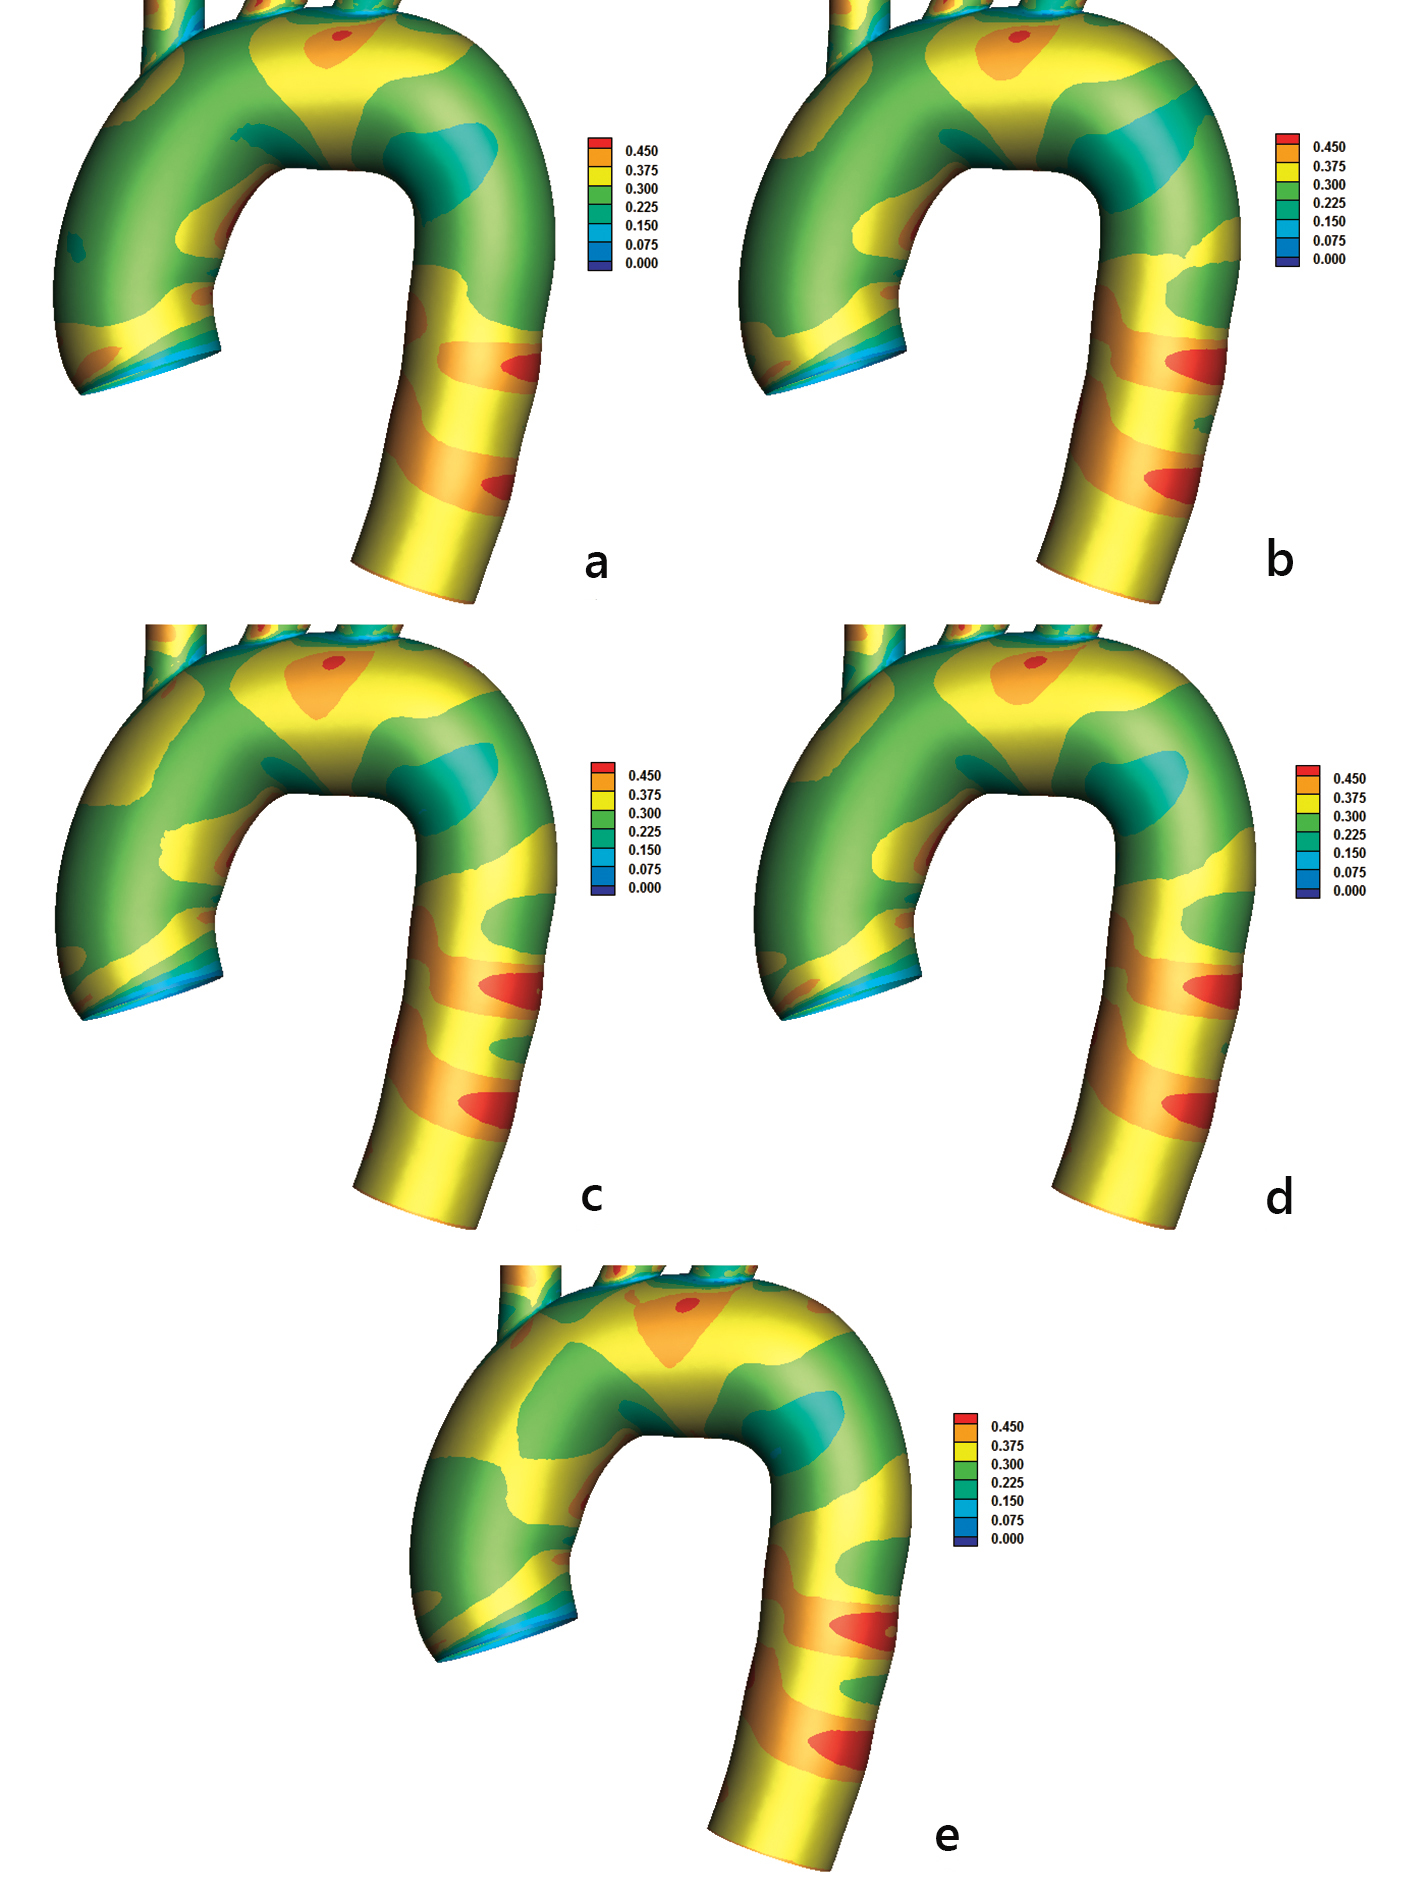
Figure 5. Oscillatory shear index (OSI) with (a) power, (b) Carreau, (c) Casson, (d) non-Newtonian power, and (e) Newtonian law models.
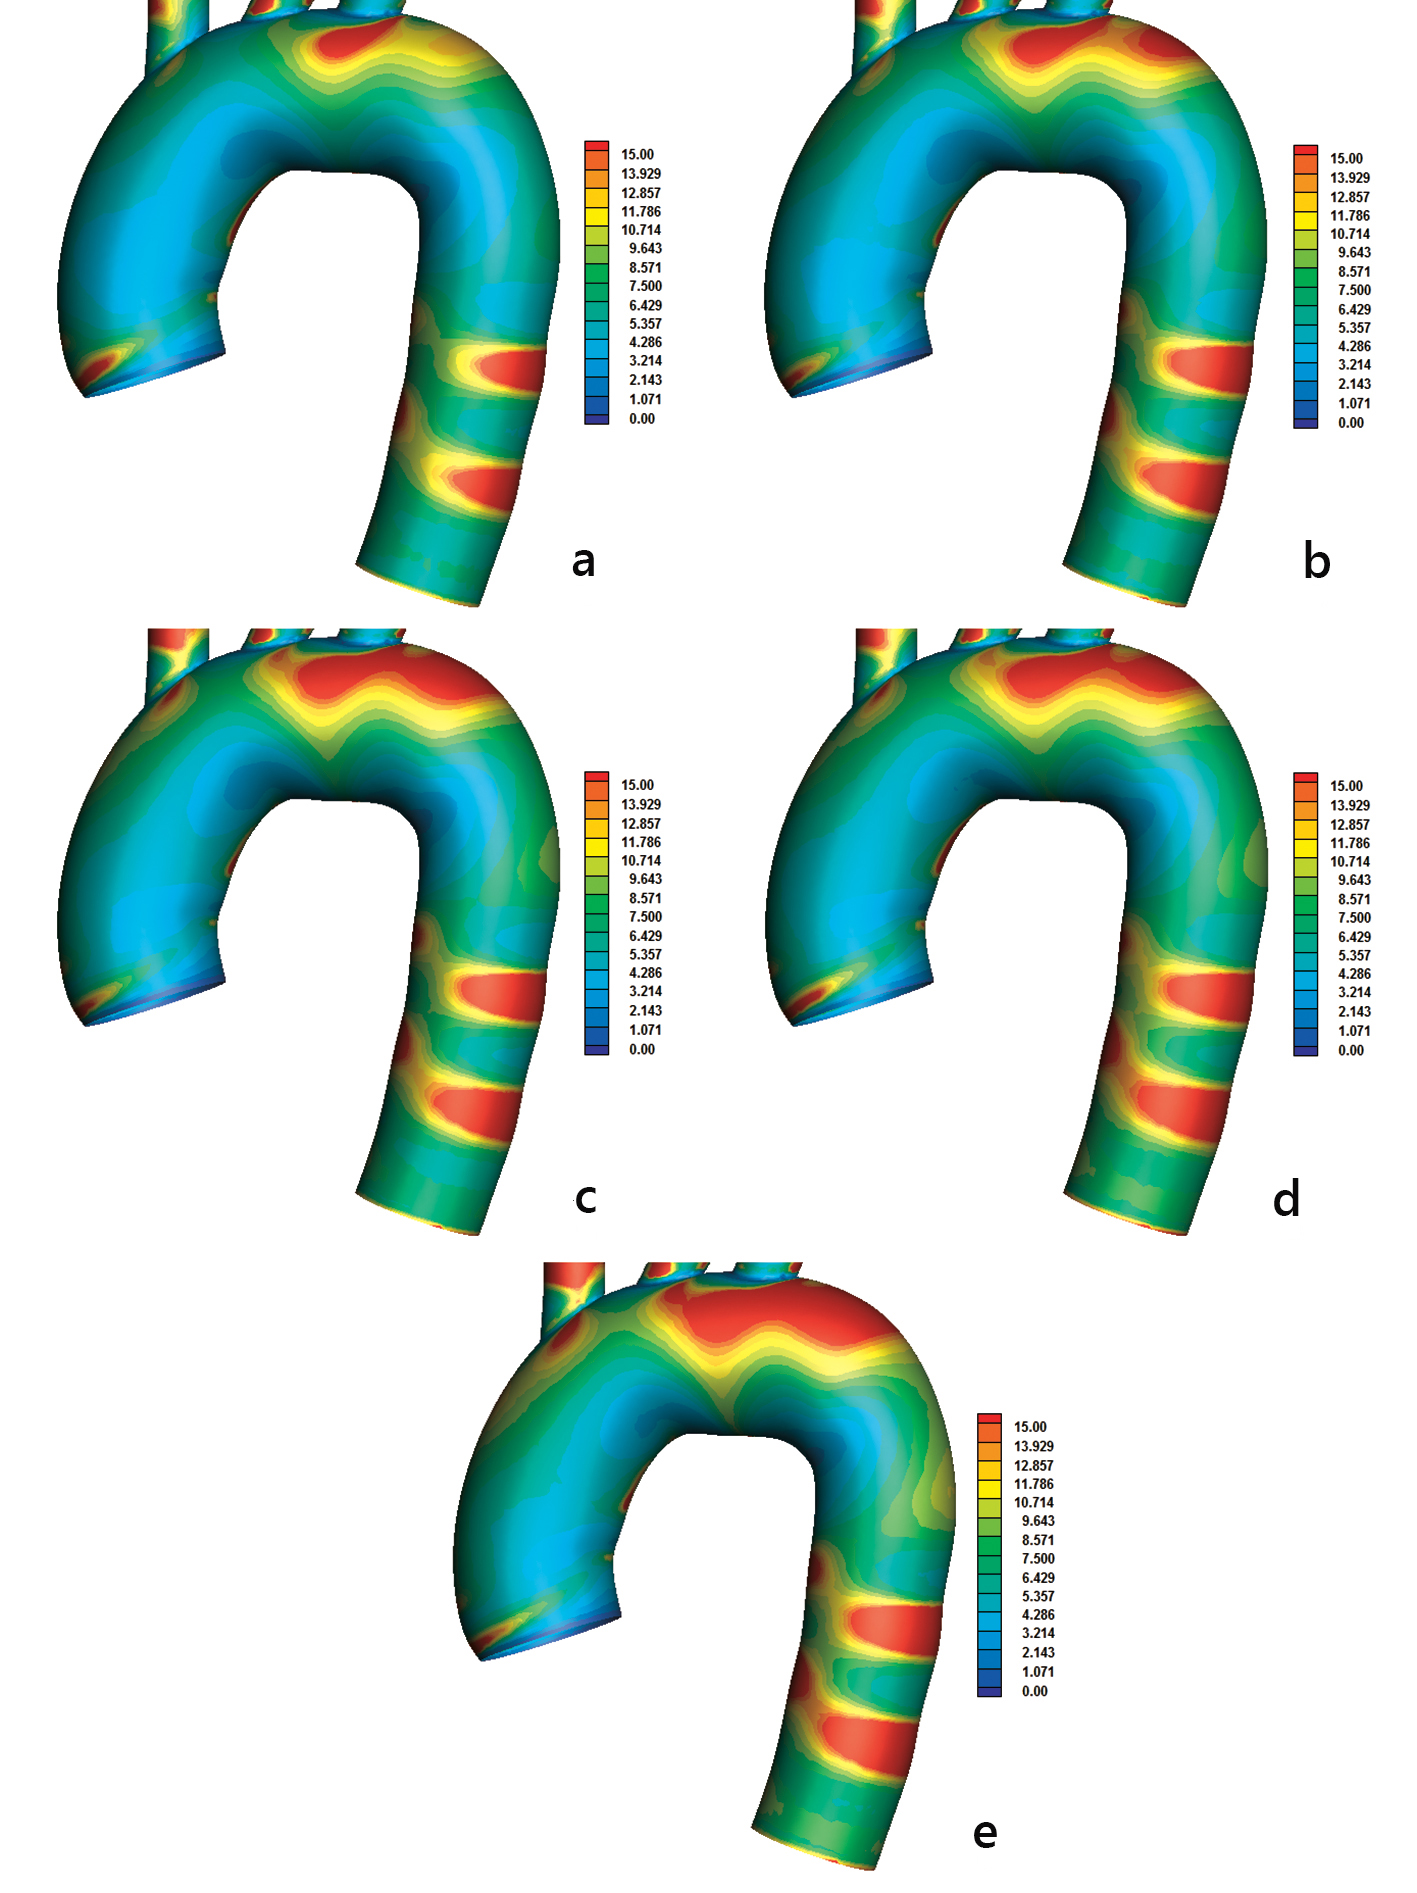
Figure 6. Relative residence time (RRT) with (a) power, (b) Carreau, (c) Casson, (d) non-Newtonian power, and (e) Newtonian law models. The AWSSV is inversely proportional to the RRT.
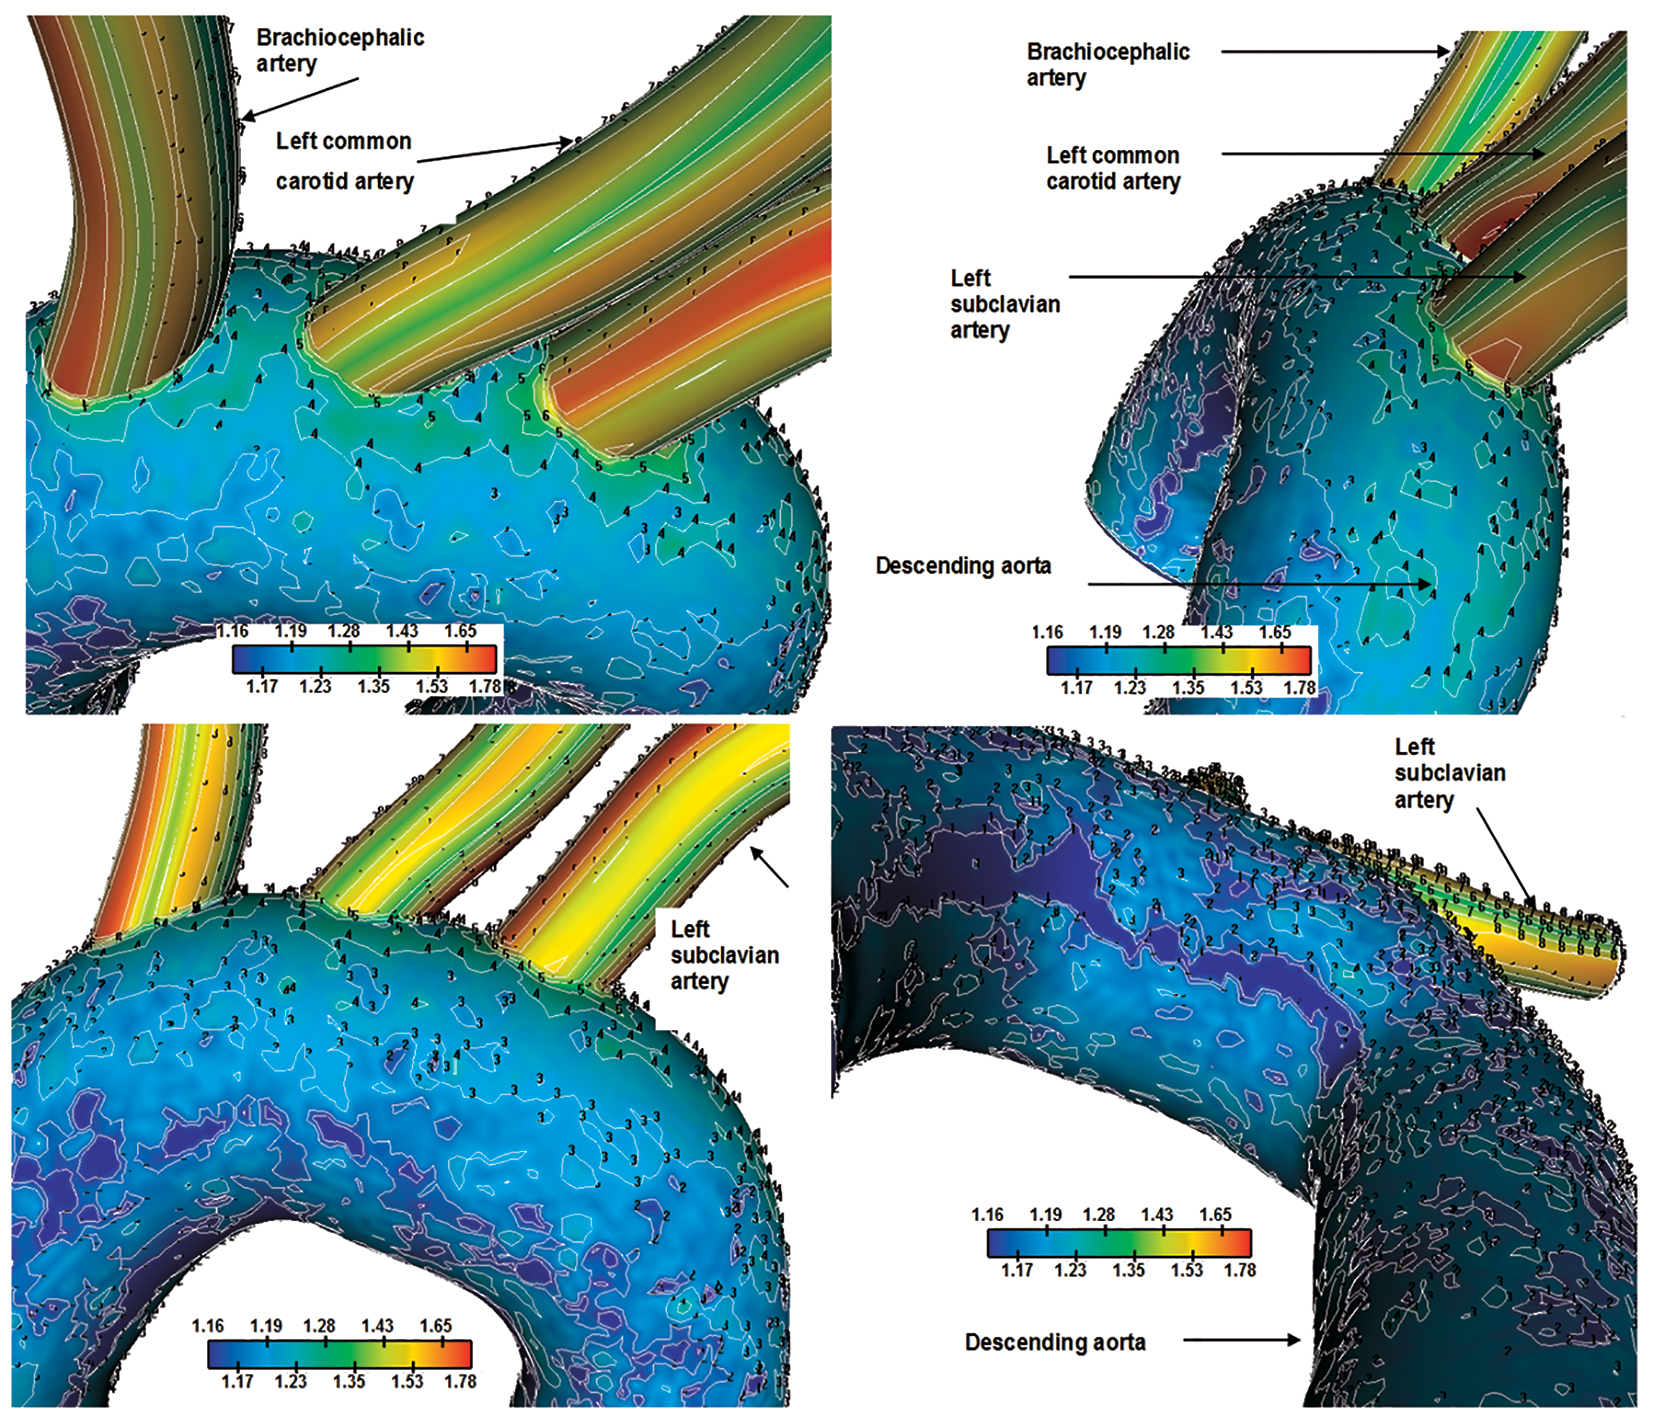
Figure 7. Normalized luminal surface LDL concentration Cw/Co for the aortic arch. Flow velocity 0.05 m/s and constant concentration LDL of 1.3 mg/mL are applied at the orifice of the ascending aorta. Four views.
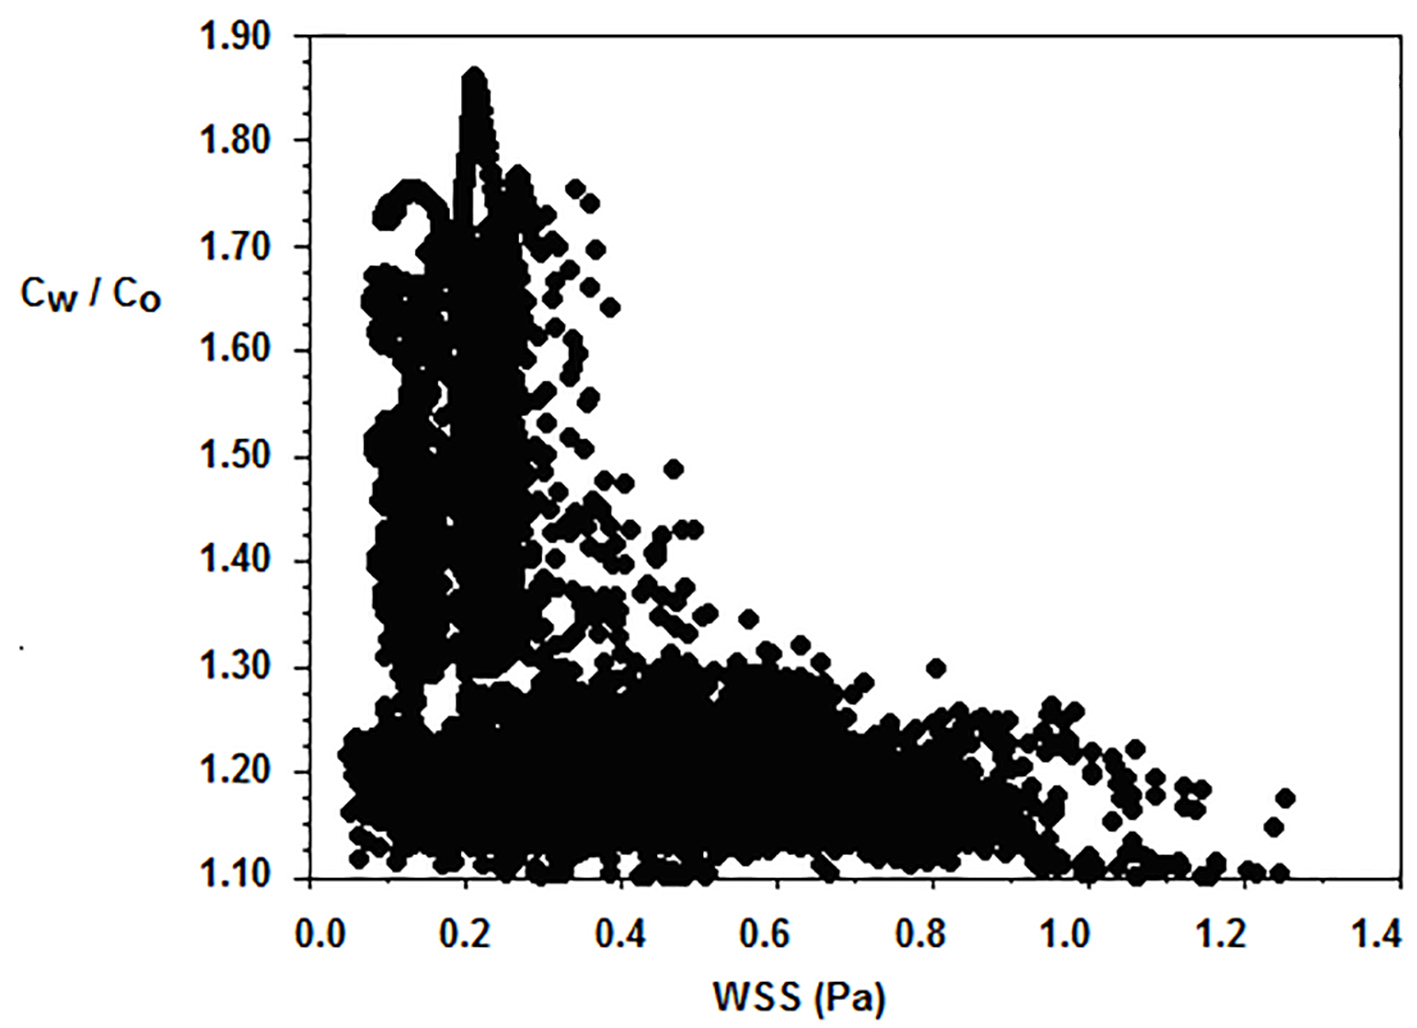
Figure 8. Typical luminal surface concentration Cw/Co of normalized LDL versus WSS (N/m2). Flow velocity 0.05 m/s and constant concentration LDL of 1.3 mg/mL are applied at the orifice of the ascending aorta.
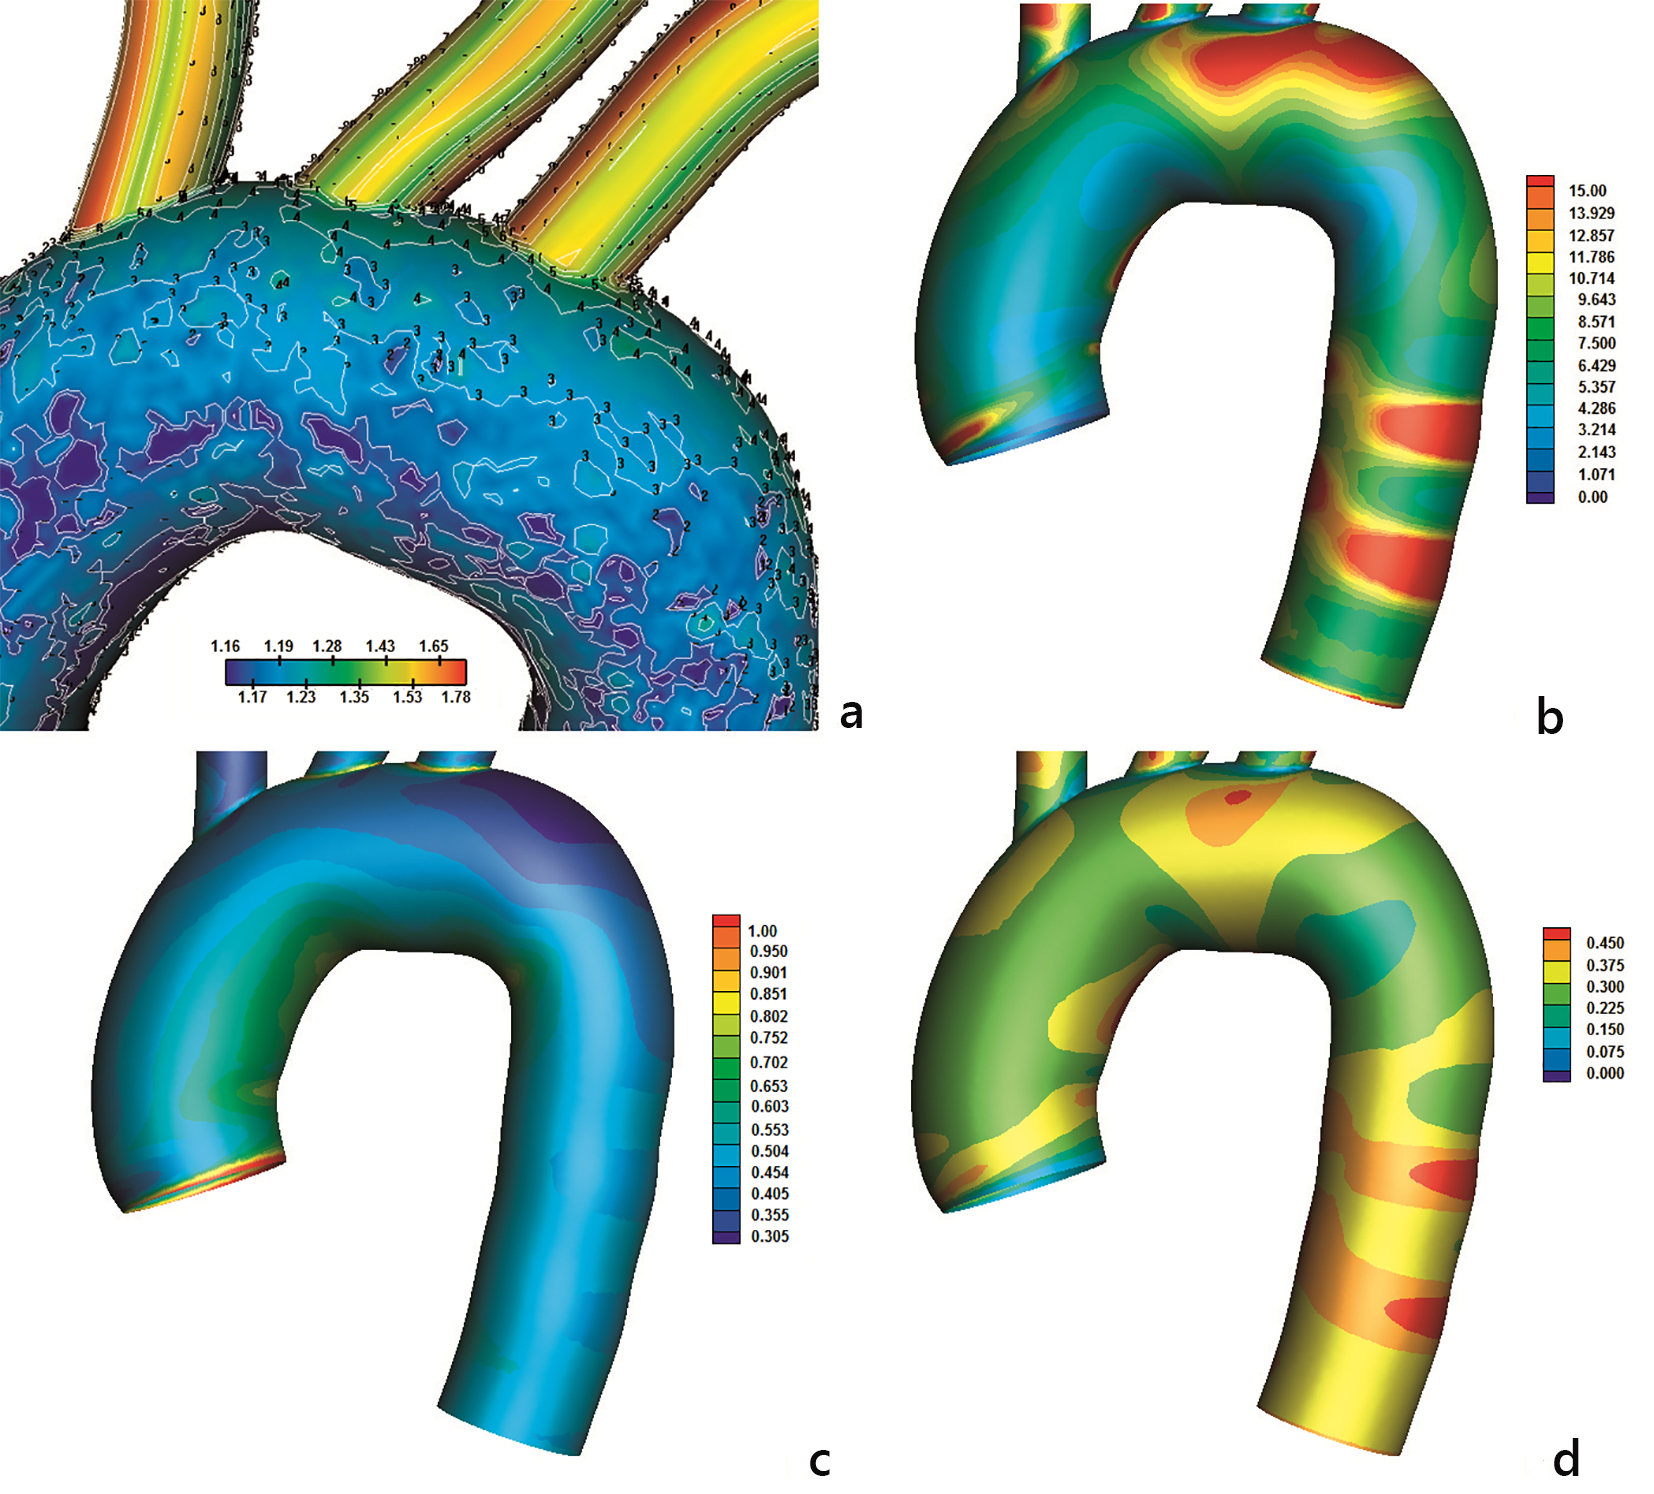
Figure 9. Contours using non-Newtonian power law of (a) normalized luminal surface LDL concentration Cw/Co at 0.05 m/s and constant concentration of LDL of 1.3 mg/mL applied at the orifice of the ascending aorta), (b) RRT, (c) AWSS (N/m2) and (d) OSI.
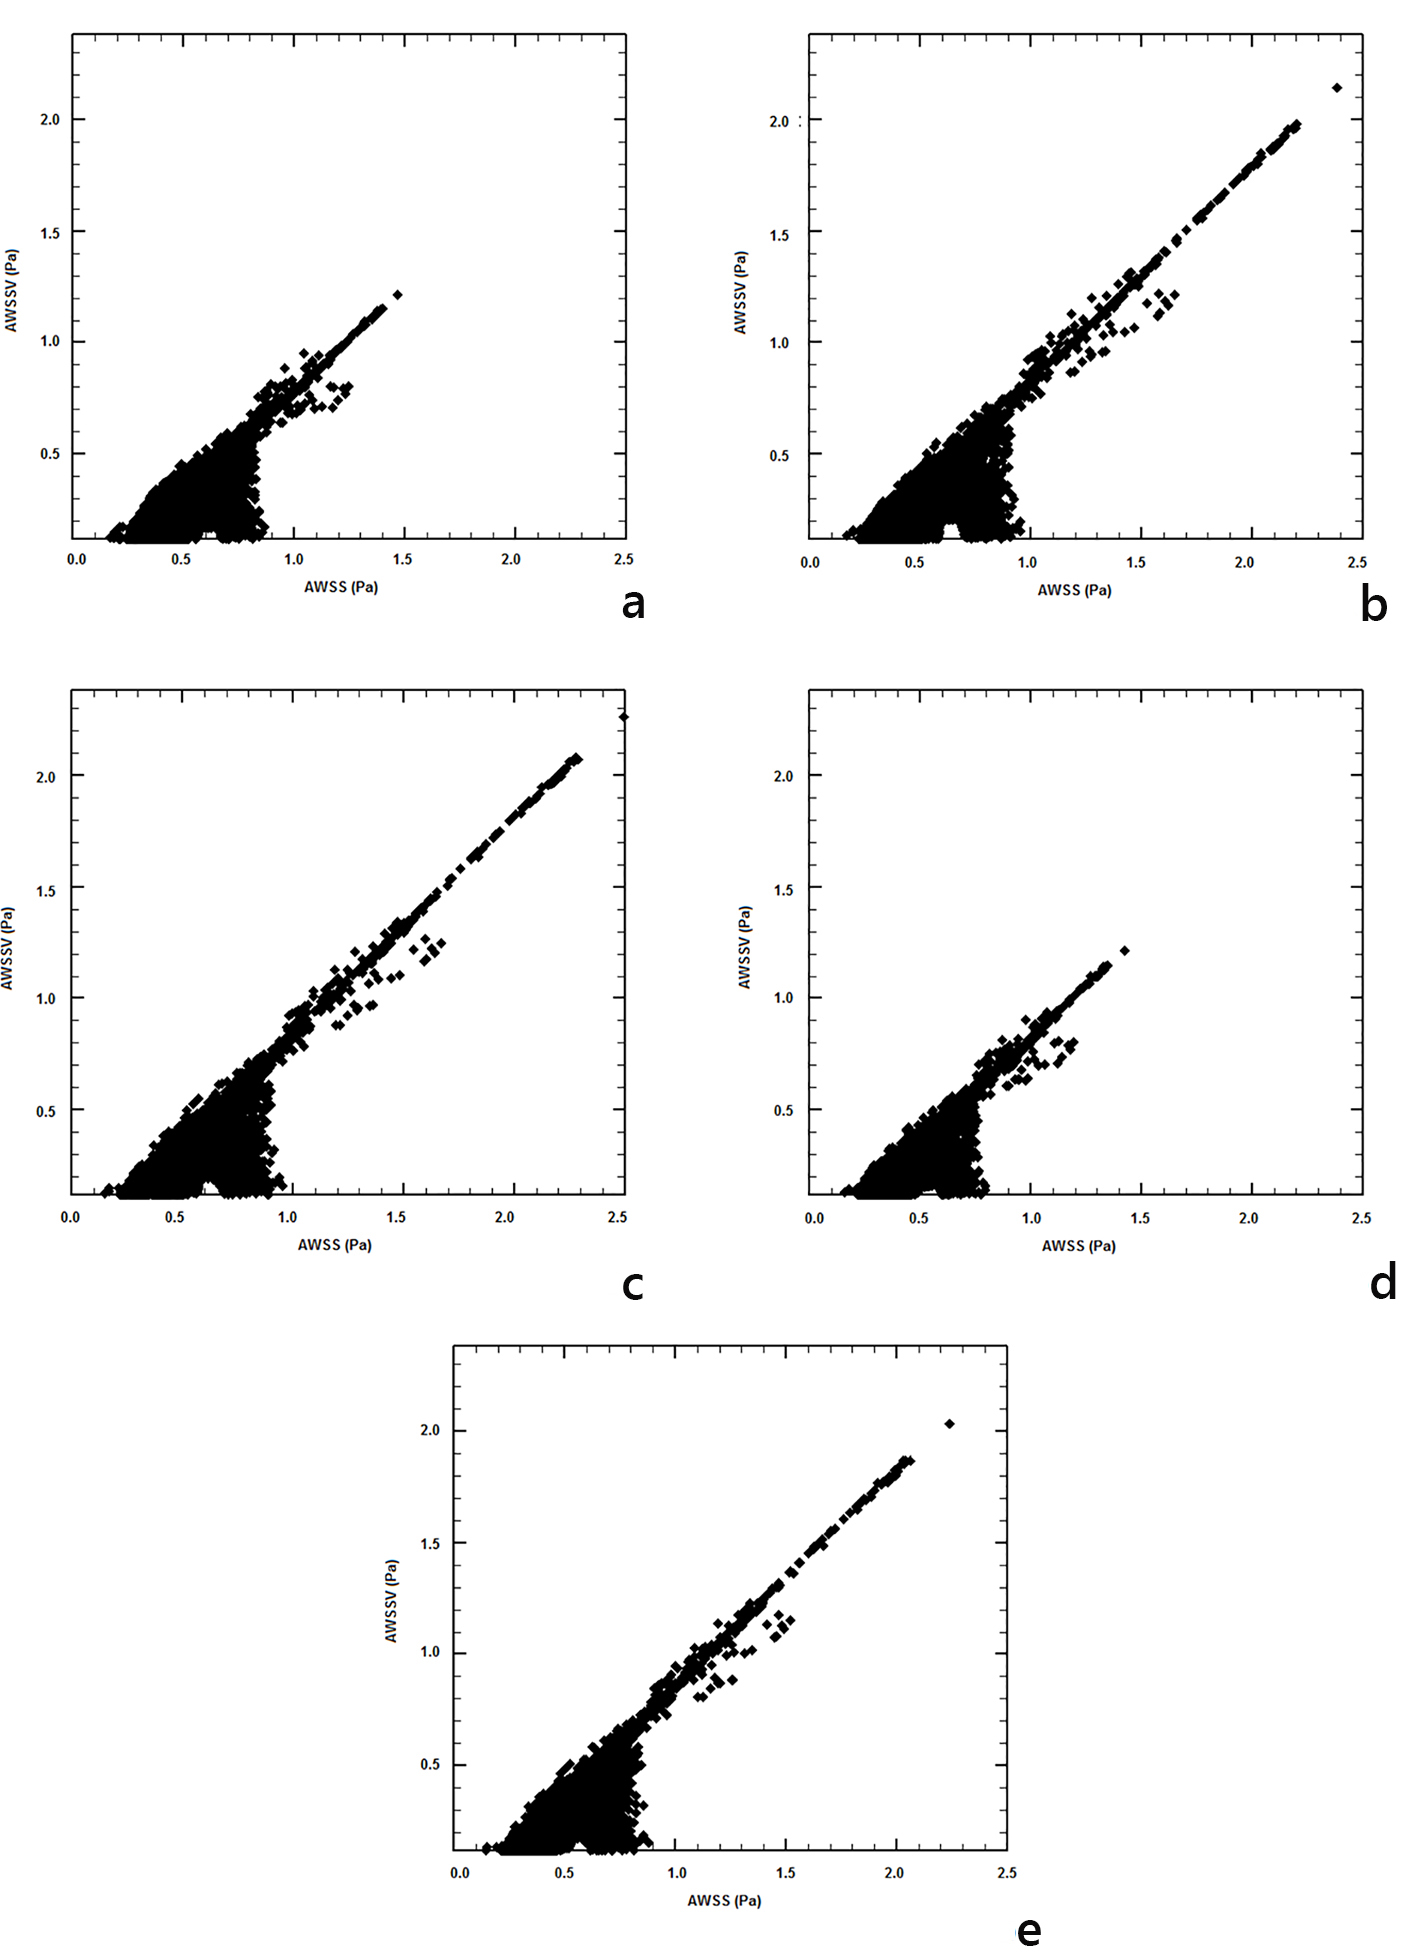
Figure 10. Time-averaged wall shear stress vector (AWSSV) (N/m2) versus averaged wall shear stress (AWSS) (N/m2): (a) power, (b) Carreau, (c) Casson, (d) non-Newtonian power, and (e) Newtonian law models.
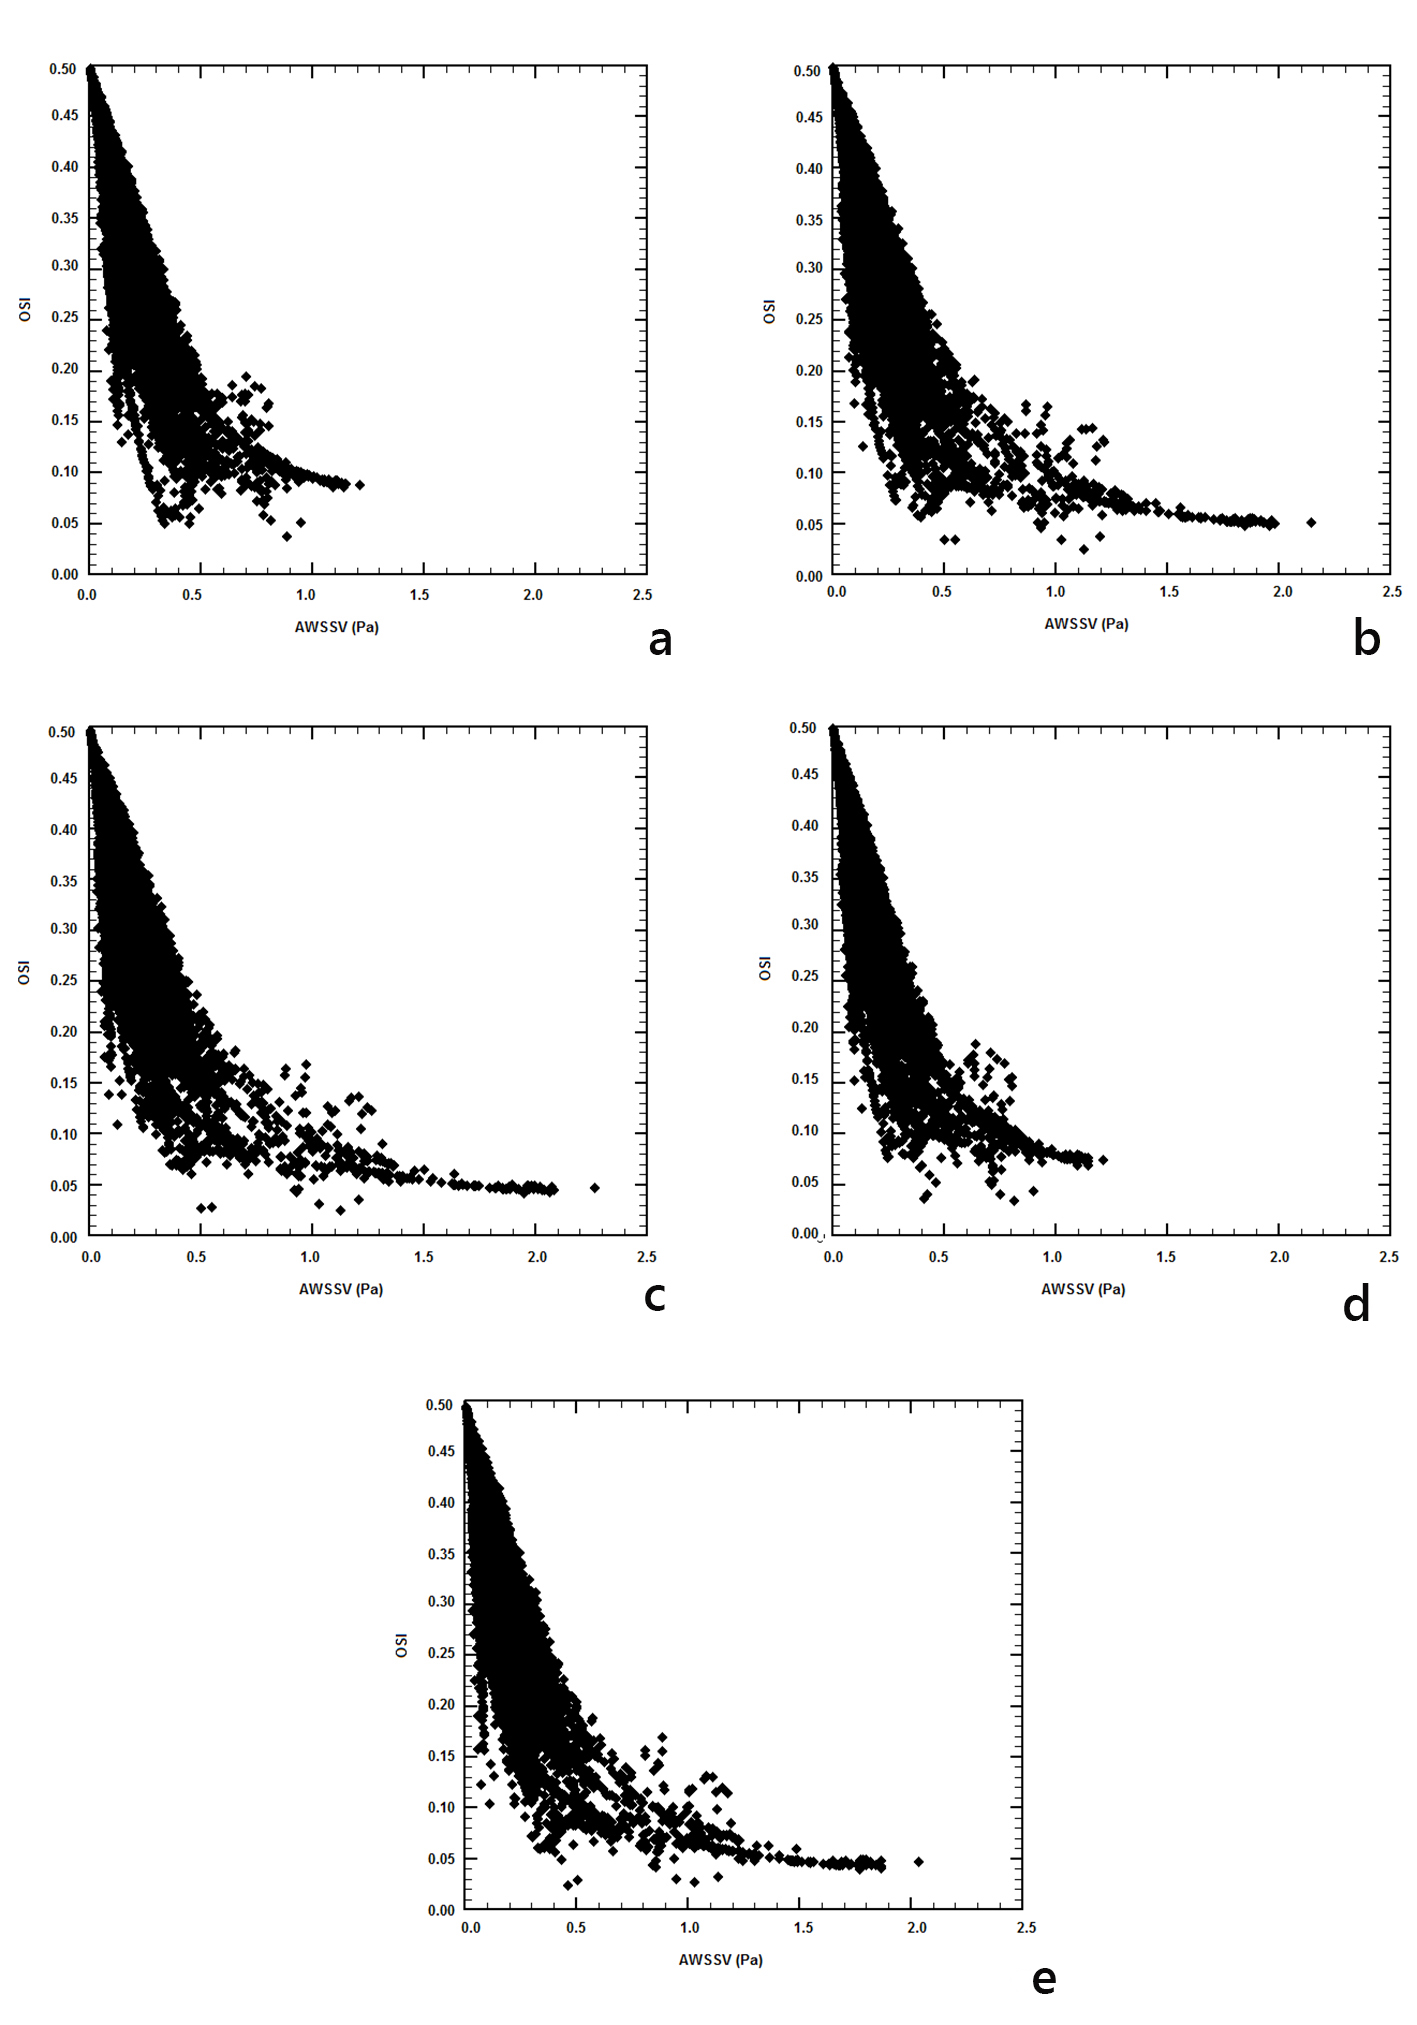
Figure 11. Oscillatory shear index versus time-averaged wall shear stress vector (AWSSV) (N/m2): (a) power, (b) Carreau, (c) Casson, (d) non-Newtonian power, and (e) Newtonian law models.
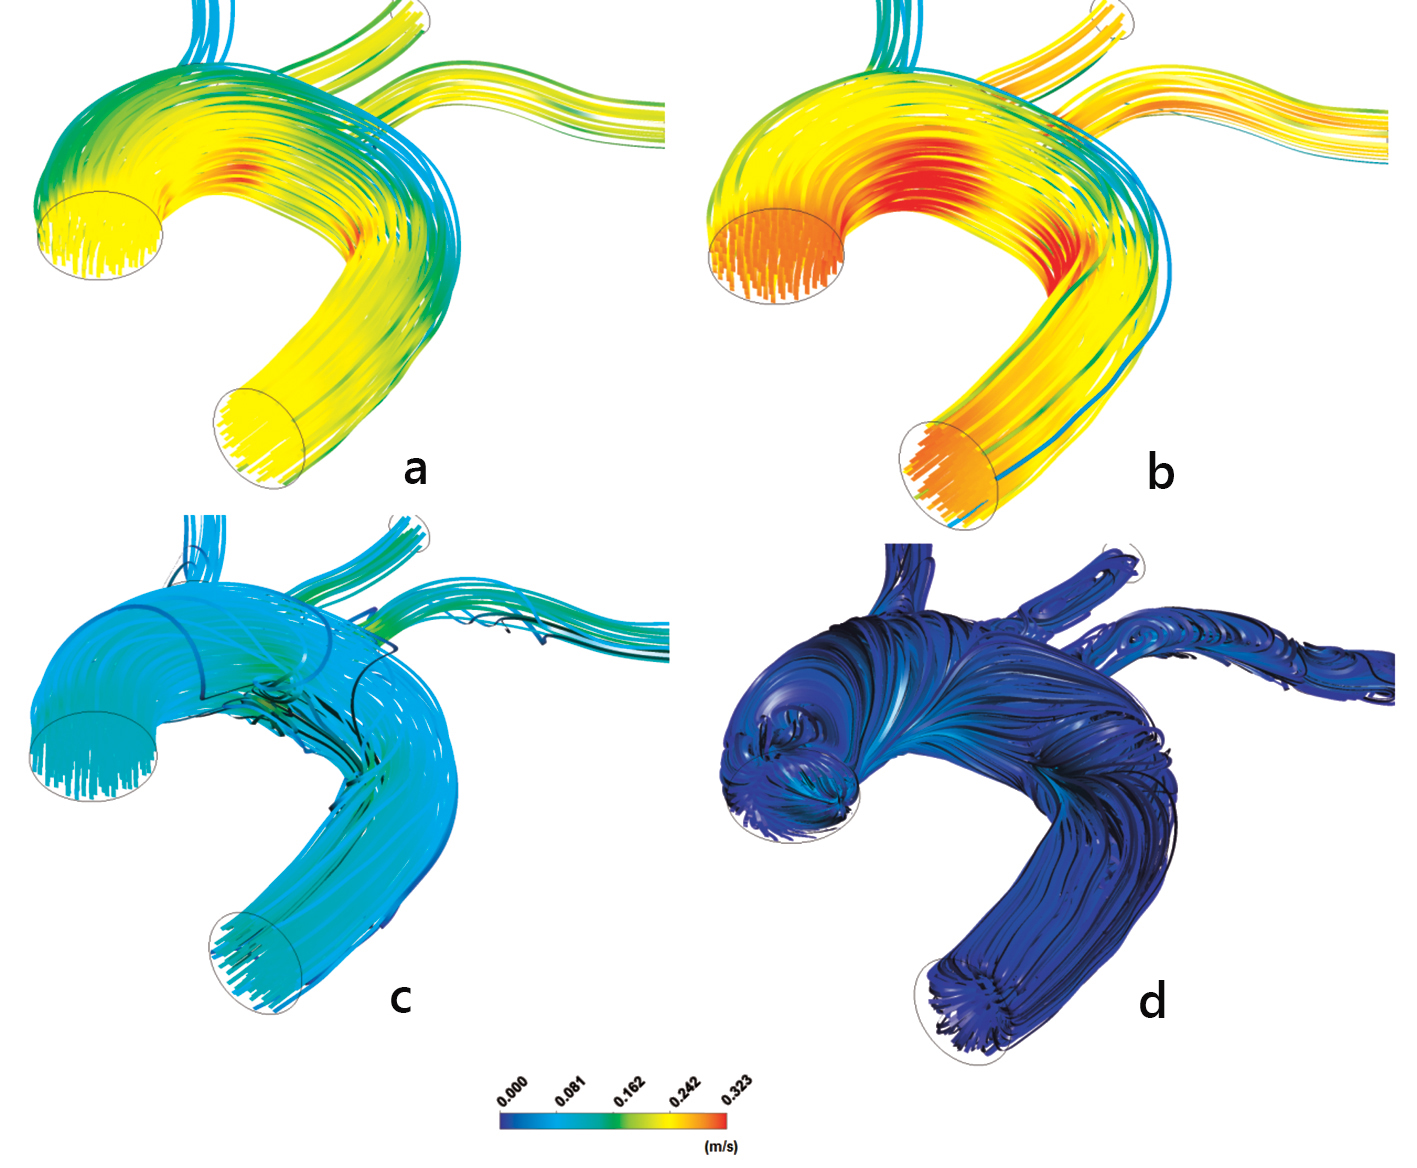
Figure 12. Aorta streamline velocities m/s: (a) t = 0.075 s, (b) t = 0.150 s, (c) t = 0.250 s and (d) t = 0.60 s using the non-Newtonian power law model.
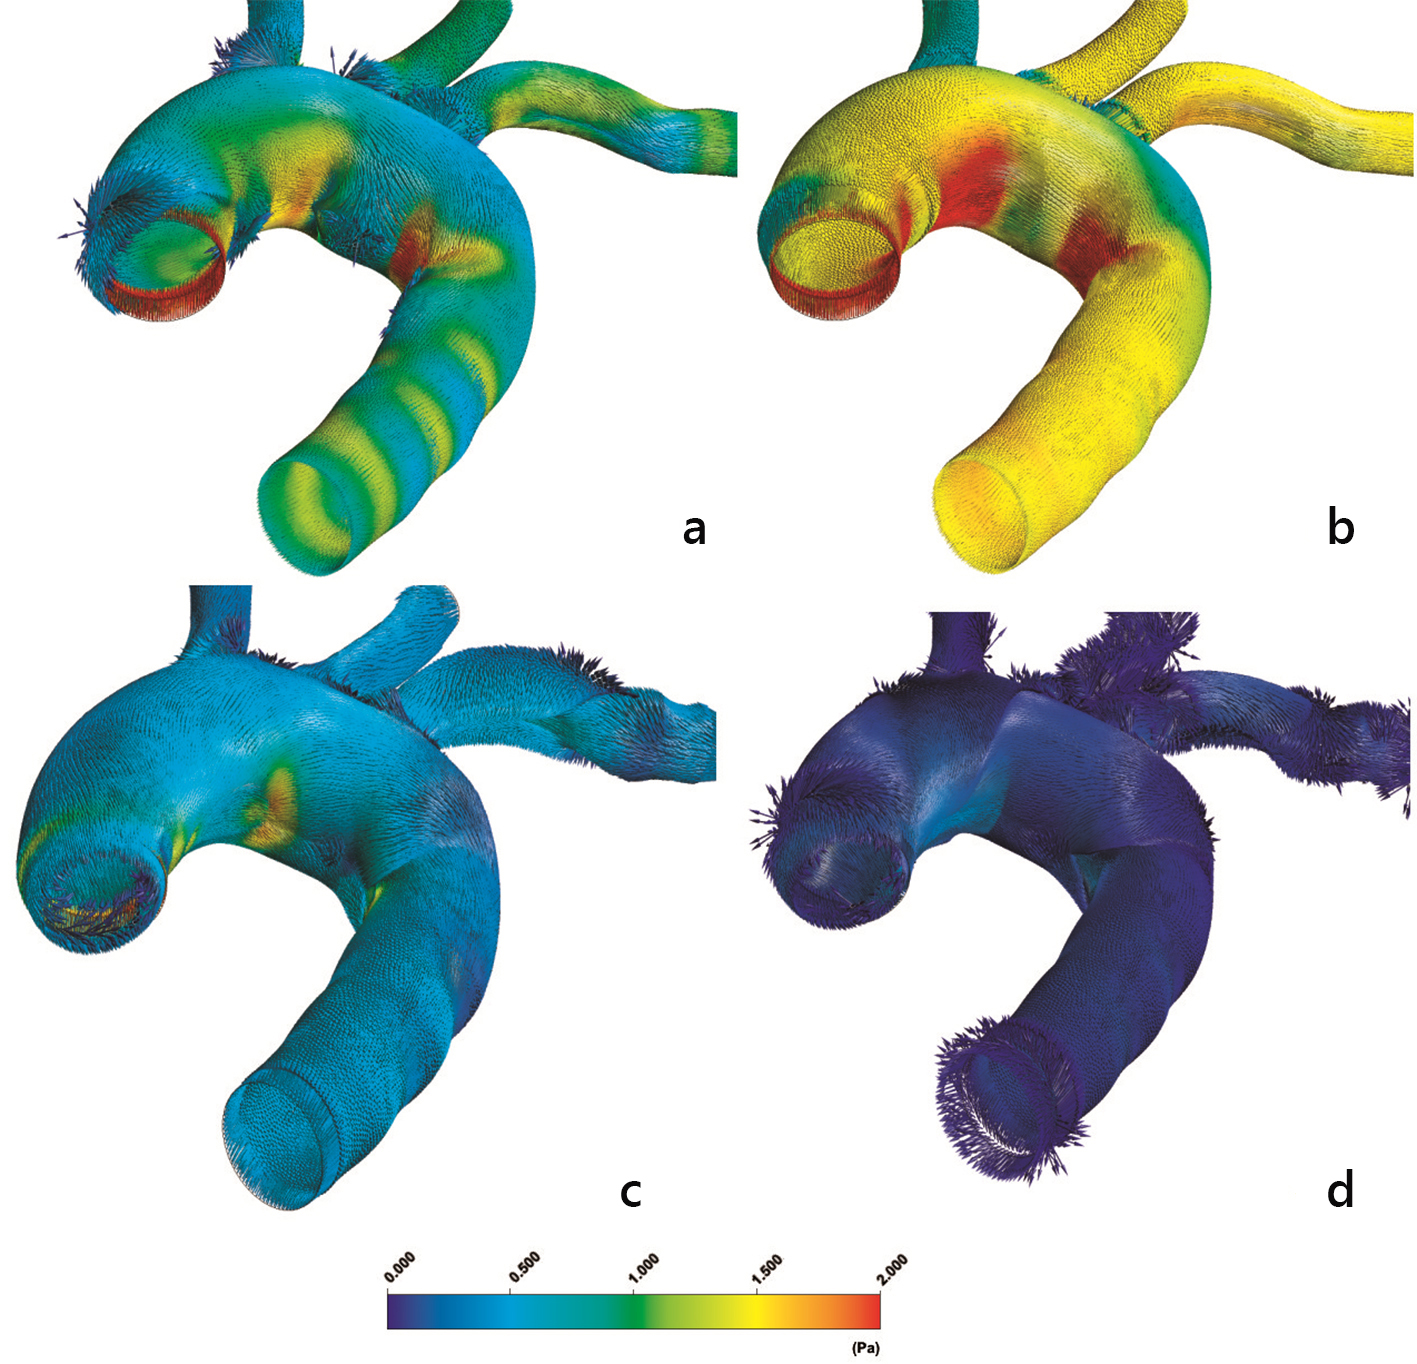
Figure 13. Instantaneous aorta wall shear stress vectors (WSSV) (N/m2) at (a) t = 0.075 s, (b) t = 0.150 s, (c) t = 0.250 s and (d) t = 0.60 s using the non-Newtonian power law model.
Table
Table 1. Pearson Correlation Factors Between Transient Blood Flow Properties
| AWSS (Pa) | AWSSV (Pa) | OSI | RRT |
|---|
| Correlations are statistically significant at the 0.01 level for all the examined parameters. |
| Power law | | | | |
| AWSS (Pa) | 1 | 0.735 | -0.221 | -0.244 |
| AWSSV (Pa) | | 1 | -0.784 | -0.444 |
| OSI | | | 1 | 0.542 |
| RRT | | | | 1 |
| Casson |
| AWSS (Pa) | 1 | 0.836 | -0.337 | -0.272 |
| AWSSV (Pa) | | 1 | -0.721 | -0.386 |
| OSI | | | 1 | 0.565 |
| RRT | | | | 1 |
| Newtonian |
| AWSS (Pa) | 1 | 0.836 | -0.358 | -0.305 |
| AWSSV (Pa) | | 1 | -0.731 | -0.418 |
| OSI | | | 1 | 0.605 |
| RRT | | | | 1 |
| Carreau | | | | |
| AWSS (Pa) | 1 | 0.816 | -0.287 | -0.212 |
| AWSSV (Pa) | | 1 | -0.721 | -0.340 |
| OSI | | | 1 | 0.490 |
| RRT | | | | 1 |
| Non-Newtonian power law | | | | |
| AWSS (Pa) | 1 | 0.759 | -0.272 | -0.229 |
| AWSSV (Pa) | | 1 | -0.784 | -0.406 |
| OSI | | | 1 | 0.523 |
| RRT | | | | 1 |