Cardiology Research, ISSN 1923-2829 print, 1923-2837 online, Open Access
Article copyright, the authors; Journal compilation copyright, Cardiol Res and Elmer Press Inc
Journal website https://www.cardiologyres.org

Original Article

Volume 7, Number 2, April 2016, pages 59-65


Interesting Correlation Between the Circulating Pentraxin 3 and Cardiac Rehabilitation Program Outcomes in Coronary Artery Bypass Grafting Patients

Figures

Figure 1.
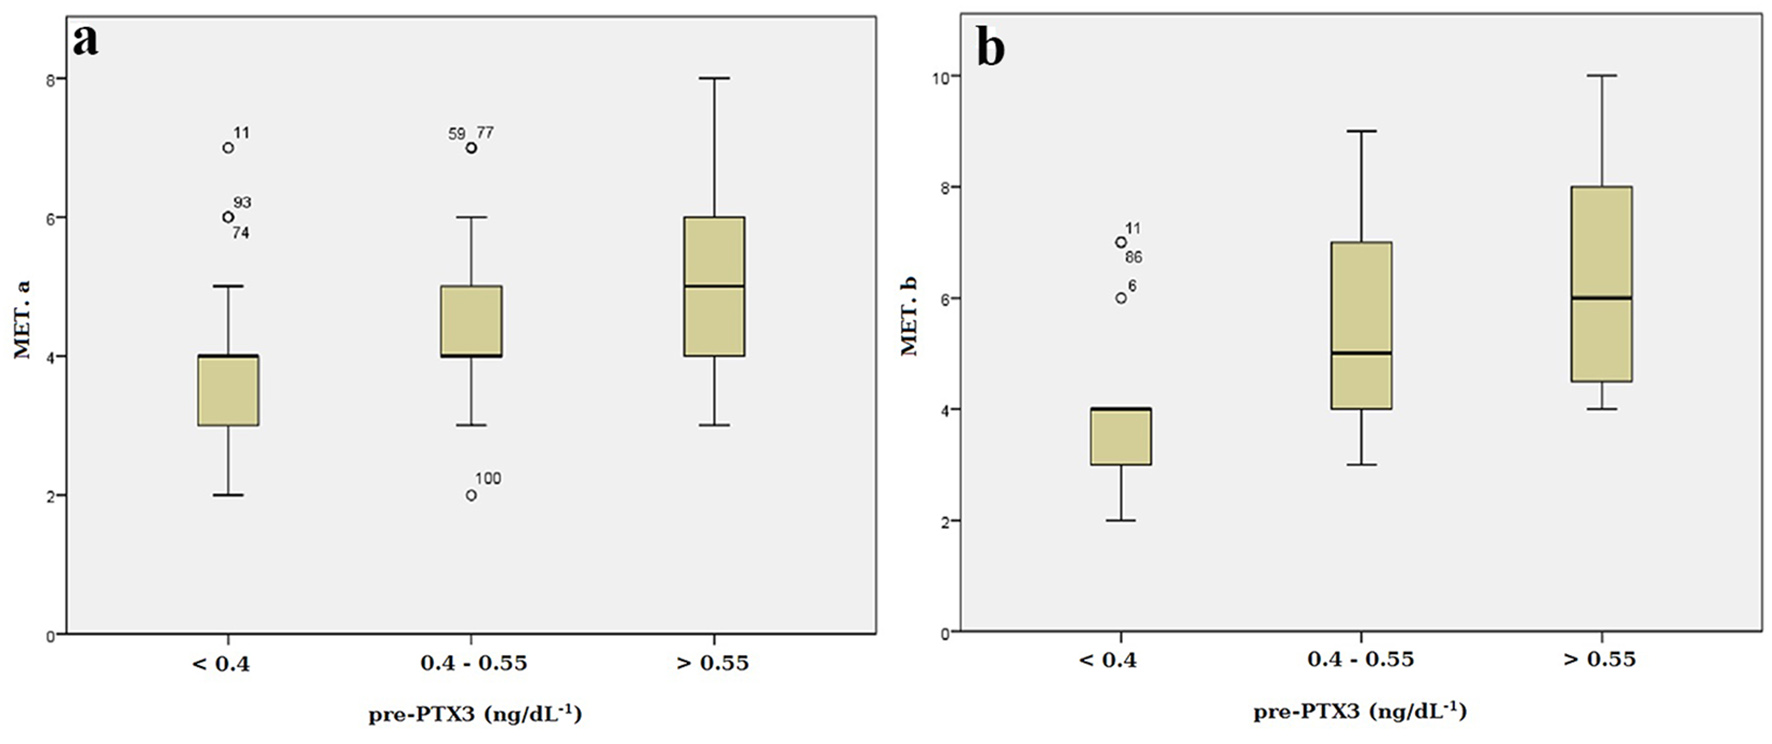
Figure 1. Distribution of MET among the patients undergoing CABG assigned to each PTX3 group. (a) Before cardiac rehabilitation. (b) After cardiac rehabilitation. MET: metabolic equivalent test; CABG: coronary artery bypass grafting; PTX3: pentraxin 3.
Figure 2.
Figure 2. Distribution of EF% among the patients undergoing CABG assigned to each PTX3 group. (a) Before cardiac rehabilitation. (b) After cardiac rehabilitation. EF: ejection fraction; CABG: coronary artery bypass grafting.

Tables

Table 1. Duke Activity Status Index (DASI)
 
DASI = SUM (values for all 12 questions)
Maximum value: 58.2, minimum value: 0
Estimated peak oxygen uptake in mL/min = 0.43 × (DASI)/9.6
1 MET is equivalent to a metabolic rate consuming 3.5 mL of oxygen per kg of body weight per min
DASI = sum of yes replies
VO2peak = (0.43 × DASI) + 9.6
VO2peak = mL/kg/min/(3.5 mL/kg/min) = METs


Table 2. Demographic Data of the Patients Participated in This Study
 
Data are presented as number (%) or mean. SYNTAX: synergy between percutaneous coronary intervention with Taxus and cardiac surgery; CRP: C-reactive protein.
Male/female (%)46/54
Age (years)61.76 ± 8.22
SYNTAX score33.18 ± 1.64
Smokers (%)20%
Hyperlipidemia (%)37%
Diabetes mellitus (%)48%
Hypertension (%)32%
High-density lipoprotein cholesterol (mmol/L)1.01 ± 0.21
Total cholesterol (mmol/L)5.89 ± 5.14


Table 3. Echocardiographic and Circulating Indicators Value of the Patients Before and After the Cardiac Rehabilitation Program
 
Before CRAfter CRP value
Data are presented as mean ± SD. CR: cardiac rehabilitation; EF: ejection fraction; MET: peak exercise capacity measured in metabolic equivalents; PTX3: pentraxin 3; CRP: C-reaction protein.
EF (%)31.89 ± 7.6533.88 ± 8.73< 0.05
MET4.47 ± 1.325.16 ± 1.96< 0.05
PTX3 (ng/dL)0.469 ± 0.0960.380 ± 0.051< 0.05
hs-CRP (mg/dL)3.85 ± 2.783.72 ± 2.610.546


Table 4. The Number of the Patients in Each EF Group Pre- and Post-CR Program Based on Pre-PTX3 Values
 
EF (%)
< 2525 - 3030 - 3535 - 40> 40
PrePostPrePostPrePostPrePostPrePost
EF: ejection fraction; pre-pentraxin 3: pentraxin 3 values before cardiac rehabilitation program; pre: before cardiac rehabilitation; post: after cardiac rehabilitation.
Pre-pentraxin 3 (ng/dL)
  < 0.40981514342212
  0.40 - 0.551410987985915
  > 0.554166333479


Table 5. The Number of the Patients in Each MET Group Pre- and Post-CR Program Based on Pre-PTX3 Values
 
MET
< 33 - 55 - 88 - 10
PrePostPrePostPrePostPrePost
MET: peak exercise capacity measured in metabolic equivalents; pre-pentraxin 3: pentraxin 3 values before cardiac rehabilitation program; pre: before cardiac rehabilitation; post: after cardiac rehabilitation.
Pre-pentraxin 3 (ng/dL)
  < 0.40131213154300
  0.40 - 0.551092617111308
  > 0.55301286728