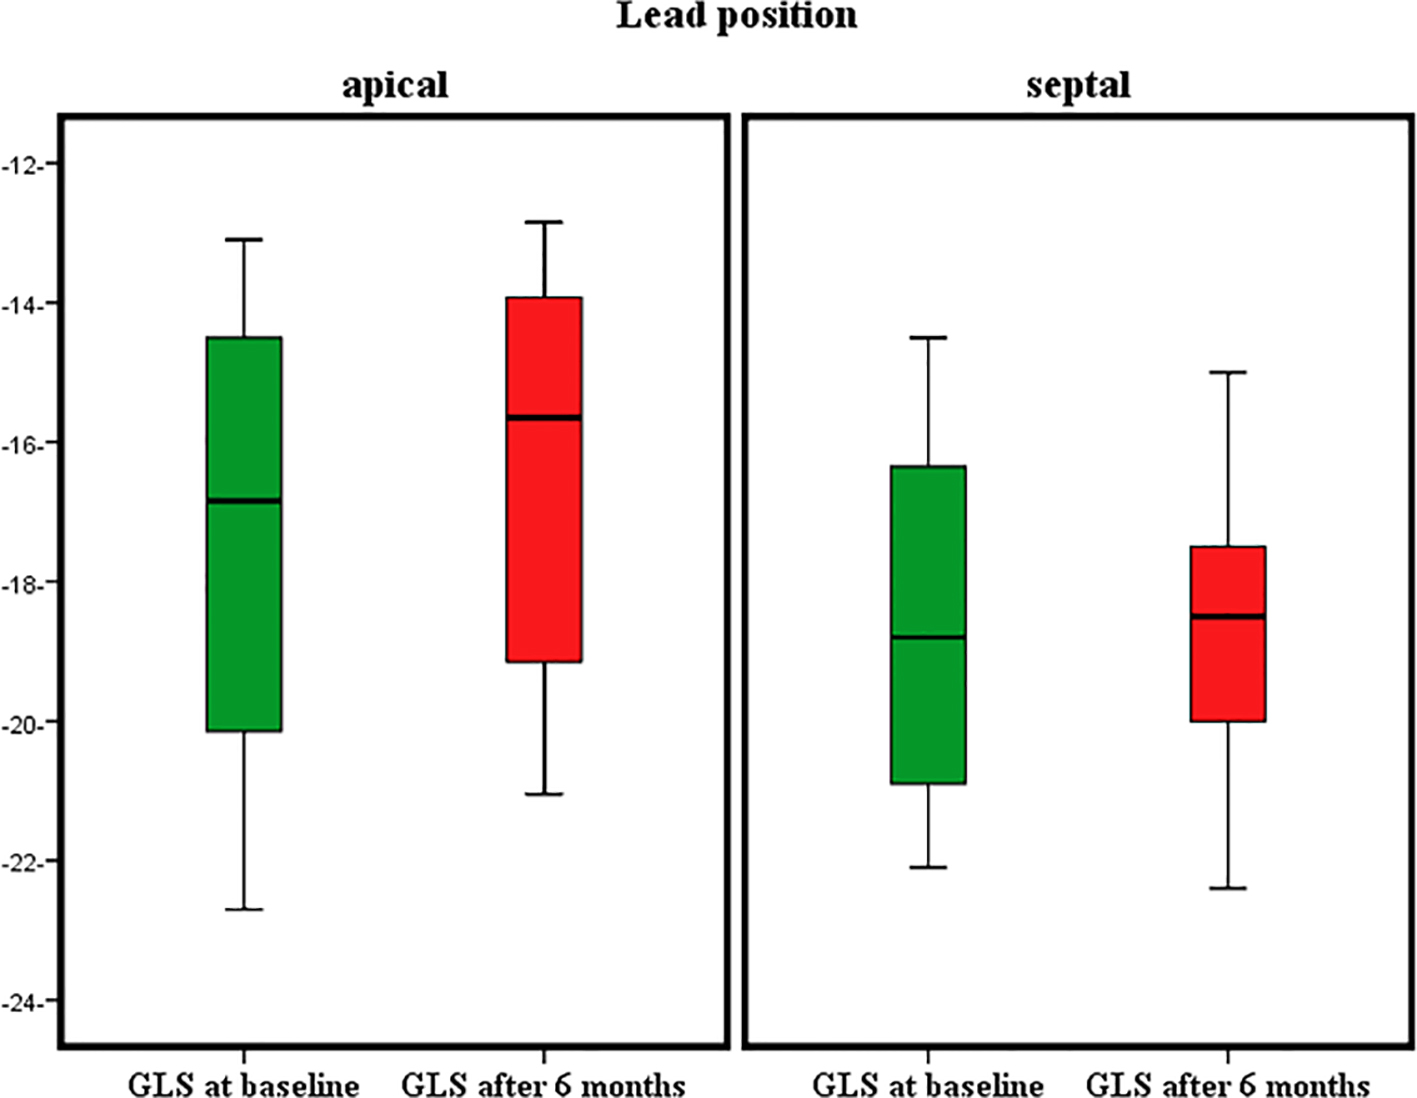
Figure 1. Global longitudinal strain (GLS) in both groups at baseline and after 6 months.
| Cardiology Research, ISSN 1923-2829 print, 1923-2837 online, Open Access |
| Article copyright, the authors; Journal compilation copyright, Cardiol Res and Elmer Press Inc |
| Journal website https://www.cardiologyres.org |
Original Article
Volume 7, Number 1, February 2016, pages 17-24
Changes in Left Ventricular Global and Regional Longitudinal Strain During Right Ventricular Pacing
Figures
Tables
| Variables | Group A (n = 32) | Group B (n = 30) | P value |
|---|---|---|---|
| SD: standard deviation; ACE: angiotensin converting enzyme. % is the percentage within the group. n means number of patients within the group. | |||
| Age in years, mean ± SD | 61.1 ± 7.5 | 58.3 ± 7.1 | 0.18 |
| Body mass index, mean ± SD | 26.59 ± 3.19 | 26.35 ± 3.78 | 0.78 |
| Male, n (%) | 6 (30) | 19 (63.3) | 0.31 |
| Female, n (%) | 14 (70) | 11 (36.7) | |
| Smoking, n (%) | 6 (30) | 15 (50) | 0.07 |
| Diabetes, n (%) | 4 (20) | 5 (16.7) | 0.67 |
| Hypertension, n (%) | 10 (50) | 16 (53.3) | 0.79 |
| Dyslipidemia, n (%) | 4 (12.5) | 4 (13.3) | 0.92 |
| ACE inhibitors, n (%) | 11 (34.3) | 8 (26.6) | 0.51 |
| Beta blockers, n (%) | 4 (12.5) | 6 (20) | 0.42 |
| Calcium channel blockers, n (%) | 4 (12.5) | 1 (3) | 0.18 |
| Diuretics, n (%) | 9 (28.1) | 14 (46.6) | 0.13 |
| Insulin, n (%) | 4 (12.5) | 1 (3) | 0.18 |
| Metformin, n (%) | 5 (15.6) | 3 (10) | 0.5 |
| Gliclazide, n (%) | 2 (6) | 0 | 0.16 |
| Glimpride, n (%) | 1 (3.1) | 4 (13.3) | 0.14 |
| Statin, n (%) | 4 (12.5) | 4 (13.3) | 0.9 |
| Group | Mean | SD | P value | |
|---|---|---|---|---|
| SD: standard deviation; TD: tissue Doppler imaging; cm: centimeter; ms: millisecond. % is the percentage within the group. *Significant P value. | ||||
| Baseline | ||||
| Ejection fraction (%) | Group A | 59.06 | 4.37 | 0.12 |
| Group B | 61.40 | 4.88 | ||
| Septal E by TDI (cm/s) | Group A | 10.90 | 1.55 | 0.64 |
| Group B | 11.17 | 2.84 | ||
| Lateral E by TDI (cm/s) | Group A | 12.71 | 1.67 | 0.09 |
| Group B | 13.5 | 19.9 | ||
| After 6 months | ||||
| QRS duration (ms) | Group A | 138.68 | 15.23 | 0.02* |
| Group B | 122.23 | 24.97 | ||
| Ejection fraction (%) | Group A | 56.65 | 5.36 | 0.07 |
| Group B | 60.36 | 6.21 | ||
| Septal E by TDI (cm/s) | Group A | 10.78 | 1.56 | 0.75 |
| Group B | 10.96 | 2.96 | ||
| Lateral E by TDI (cm/s) | Group A | 11.92 | 1.90 | 0.12 |
| Group B | 12.66 | 1.86 | ||
| Pacing percentage (%) | Group A | 75.31 | 14.59 | 0.32 |
| Group B | 72.03 | 10.96 | ||
| Group | Mean | SD | P value | |
|---|---|---|---|---|
| SD: standard deviation; LS: longitudinal strain. % is the percentage within the group. *Significant P value. | ||||
| Baseline | ||||
| Average septal LS | Group A | -16.48 | 5.43 | 0.41 |
| Group B | -16.18 | 3.93 | ||
| Average lateral LS | Group A | -17.66 | 5.33 | 0.77 |
| Group B | -18.01 | 4.19 | ||
| Average anterior LS | Group A | -16.83 | 5.06 | 0.18 |
| Group B | -18.52 | 4.82 | ||
| Average inferior LS | Group A | -18.70 | 3.98 | 0.52 |
| Group B | -19.29 | 3.24 | ||
| Apical LS | Group A | -17.94 | 4.29 | 0.08 |
| Group B | -16.92 | 4.31 | ||
| Mid LS | Group A | -15.98 | 5.44 | 0.16 |
| Group B | -17.83 | 4.93 | ||
| Basal LS | Group A | -20.05 | 3.44 | 0.44 |
| Group B | -20.71 | 3.25 | ||
| Relative apical LS | Group A | 0.45 | 0.13 | 0.78 |
| Group B | 0.51 | 0.11 | ||
| Global LS | Group A | -16.90 | 5.35 | 0.19 |
| Group B | -18.43 | 3.52 | ||
| After 6 month | ||||
| Average septal LS | Group A | -15.74 | 4.07 | 0.02* |
| Group B | -18.37 | 2.97 | ||
| Average lateral LS | Group A | -15.68 | 4.99 | 0.9 |
| Group B | -15.59 | 3.02 | ||
| Average anterior LS | Group A | -15.28 | 5.40 | 0.1 |
| Group B | -17.56 | 5.38 | ||
| Average inferior LS | Group A | -18.57 | 3.68 | 0.5 |
| Group B | -19.28 | 3.24 | ||
| Apical LS | Group A | -15.32 | 3.74 | 0.03* |
| Group B | -16.99 | 2.10 | ||
| Mid LS | Group A | -15.23 | 4.49 | 0.4 |
| Group B | -16.76 | 4.14 | ||
| Basal LS | Group A | -18.99 | 2.70 | 0.3 |
| Group B | -19.66 | 2.71 | ||
| Relative apical LS | Group A | 0.39 | 0.11 | 0.03* |
| Group B | 0.50 | 0.12 | ||
| Global LS | Group A | -15.23 | 4.11 | 0.01* |
| Group B | -18.29 | 2.09 | ||
| Variables controlled for lead position | GLS at 6 months | |
|---|---|---|
| R | P value | |
| GLS: global longitudinal strain; LS: longitudinal strain. *Significant P value. | ||
| QRS duration | 0.352 | 0.03* |
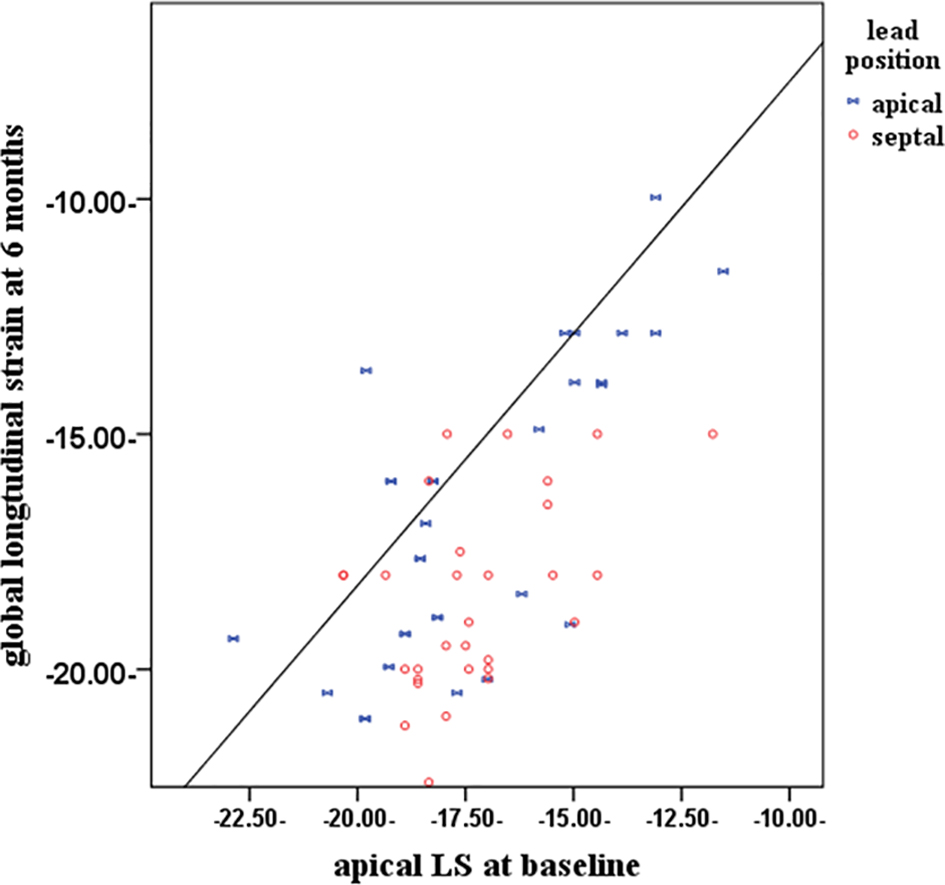
| Apical LS at baseline | 0.622 | 0.001* |
| Mid LS at baseline | 0.233 | 0.07 |
| Basal LS at baseline | 0.189 | 0.29 |
| Average anterior wall LS at baseline | 0.218 | 0.09 |
| Average inferior wall LS at baseline | 0.209 | 0.1 |
| Average lateral wall LS at baseline | 0.216 | 0.09 |
| Average septa wall LS at baseline | 0.252 | 0.054 |