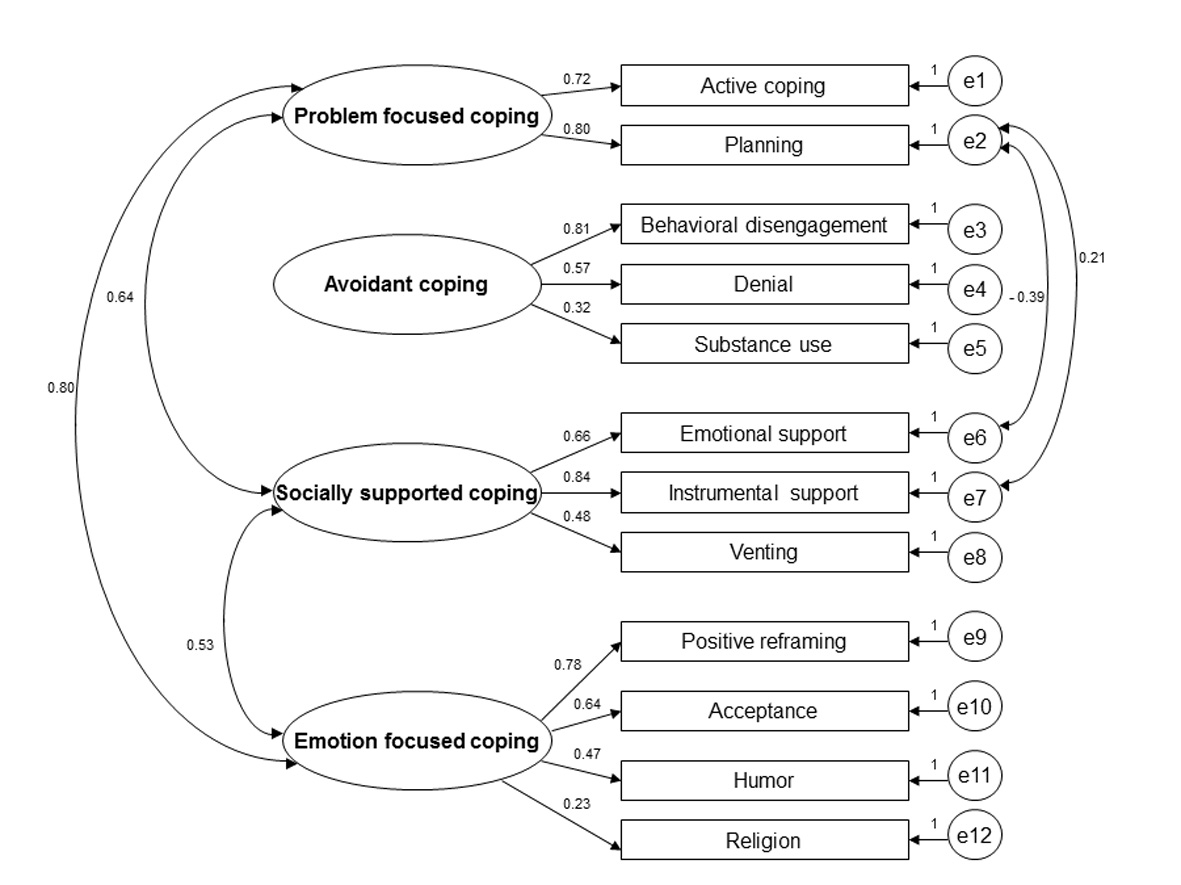
Figure 1. Modified four-factor model of Brief COPE. Parameter estimates are standardized coefficients. Non-significant correlations between the latent factors are not displayed in the model.
| Cardiology Research, ISSN 1923-2829 print, 1923-2837 online, Open Access |
| Article copyright, the authors; Journal compilation copyright, Cardiol Res and Elmer Press Inc |
| Journal website https://www.cardiologyres.org |
Original Article
Volume 6, Number 2, April 2015, pages 239-248
Assessment of Coping Strategies and Their Associations With Health Related Quality of Life in Patients With Chronic Heart Failure: the Brief COPE Restructured
Figure
Tables
| Total sample | Cohort 1 (%) | Cohort 2 (%) | ||
|---|---|---|---|---|
| n | % | |||
| aNYHA class: New York Heart Association class. bACEi: Angiotensin Converting Enzyme inhibitor. cARB: Angiotensin II Receptor Blocker. | ||||
| Age (mean ± SD) | 71.3 ± 9.7 (range 39 - 94) | 72.1 ± 10.5 | 70.7 ± 9.1 | |
| Sex (female) | 54 | 29.5 | 27.5 | 31.1 |
| Marital status | ||||
| Married/cohabitant | 117 | 64.0 | 60.0 | 67.0 |
| Single | 66 | 36.0 | 40.0 | 33.0 |
| Education | ||||
| Compulsory school | 53 | 29.0 | 35.0 | 24.3 |
| Upper secondary school | 69 | 37.7 | 38.8 | 36.9 |
| University | 61 | 33.3 | 26.2 | 38.8 |
| Occupation | ||||
| Working | 35 | 19.1 | 18.8 | 18.4 |
| Pensioner | 140 | 76.5 | 77.5 | 75.7 |
| Disability pensioner | 5 | 2.7 | 5.8 | |
| Other | 3 | 1.6 | 3.7 | |
| NYHA classa | ||||
| Class II | 126 | 68.9 | 48.75 | 84.5 |
| Class III | 55 | 30.1 | 48.75 | 15.5 |
| Class IV | 2 | 1.1 | 2.5 | |
| Duration of heart failure | ||||
| Less than 6 months | 48 | 26.2 | 18.8 | 32.0 |
| 6 months to 1 year | 25 | 13.7 | 17.5 | 10.7 |
| 1 year to 2 years | 30 | 16.4 | 11.2 | 20.4 |
| 2 years to 5 years | 43 | 23.5 | 22.5 | 24.3 |
| More than 5 years | 37 | 20.2 | 30.0 | 12.6 |
| Heart failure medication | ||||
| ACEib | 116 | 63.4 | 61.3 | 65.0 |
| ARBc | 61 | 33.3 | 35.0 | 32.0 |
| Beta-blockers | 178 | 97.3 | 96.3 | 98.1 |
| Aldosterone receptor antagonist | 88 | 48.1 | 53.8 | 43.7 |
| Diuretics | 148 | 80.9 | 92.5 | 70.9 |
| Left ventricular ejection fraction (LVEF) | ||||
| Normal (LVEF > 50%) | 27 | 14.8 | 16.2 | 13.6 |
| Mildly reduced (LVEF 40-49%) | 43 | 23.5 | 15.0 | 32.0 |
| Moderately reduced (LVEF 30-39%) | 68 | 37.2 | 35.0 | 38.8 |
| Severely reduced (LVEF < 30%) | 45 | 24.6 | 33.8 | 15.5 |
| 1 | 2 | 3 | 4 | 5 | 6 | 7 | 8 | 9 | 10 | 11 | 12 | 13 | 14 | |
|---|---|---|---|---|---|---|---|---|---|---|---|---|---|---|
| 1. Active coping | ||||||||||||||
| 2. Planning | 0.58 | |||||||||||||
| 3. Positive reframing | 0.43 | 0.48 | ||||||||||||
| 4. Acceptance | 0.37 | 0.45 | 0.50 | |||||||||||
| 5. Humor | 0.28 | 0.32 | 0.38 | 0.28 | ||||||||||
| 6. Religion | 0.09 | 0.13 | 0.25 | 0.09 | -0.01 | |||||||||
| 7. Emotional support | 0.32 | 0.17 | 0.27 | 0.24 | 0.21 | 0.16 | ||||||||
| 8. Instrumental support | 0.39 | 0.51 | 0.35 | 0.19 | 0.30 | 0.26 | 0.56 | |||||||
| 9. Self-distraction | 0.33 | 0.25 | 0.30 | 0.11 | 0.18 | 0.18 | 0.19 | 0.19 | ||||||
| 10. Denial | -0.02 | 0.01 | 0.11 | -0.08 | 0.01 | 0.05 | 0.06 | 0.10 | 0.38 | |||||
| 11. Venting | 0.23 | 0.21 | 0.17 | 0.07 | 0.11 | 0.27 | 0.31 | 0.41 | 0.33 | 0.27 | ||||
| 12. Substance use | 0.01 | 0.00 | -0.04 | -0.08 | 0.09 | -0.07 | 0.00 | 0.08 | 0.11 | 0.07 | 0.09 | |||
| 13. Behavioral diseng. | -0.15 | -0.09 | -0.01 | -0.10 | -0.07 | 0.05 | -0.05 | 0.01 | 0.28 | 0.48 | 0.18 | 0.30 | ||
| 14. Selfblame | 0.26 | 0.40 | 0.39 | 0.18 | 0.16 | 0.25 | 0.16 | 0.35 | 0.36 | 0.18 | 0.48 | 0.04 | 0.26 | |
| Mean inter-correlation coefficient | 0.27 | 0.28 | 0.28 | 0.21 | 0.18 | 0.14 | 0.21 | 0.28 | 0.25 | 0.14 | 0.24 | 0.07 | 0.16 | 0.27 |
| χ2 | df | CFIb | RMSEAc | 90% CId | SRMRe | Omitted subscales | |
|---|---|---|---|---|---|---|---|
| aError variance for planning is correlated with the error variance for instrumental support and emotional support. *P < 0.001. bCFI: Comparative Fit Index. cRMSEA: Root Mean Squared Error of Approximation. dCI: Confidence Interval. eSRMR: Standardized Root Mean square Residual. | |||||||
| Two-factor model, Bean et al [32] | 279.78* | 76 | 0.676 | 0.121 | 0.106 - 0.136 | 0.103 | None |
| Two-factor model, Eisenberg et al [33] | 224.59* | 53 | 0.703 | 0.133 | 0.115 - 0.151 | 0.099 | Humor, Religion |
| Three-factor model Paukert et al [34] | 275.49* | 63 | 0.643 | 0.136 | 0.120 - 0.152 | 0.114 | Humor |
| Four-factor model, Perez-Garcia et al [35] | 64.02* | 17 | 0.878 | 0.123 | 0.092 - 0.156 | 0.070 | Denial, humor, religion, self-distraction, substance use, venting |
| Four-factor model Carver et al (from COPE) [25] | 53.18* | 21 | 0.922 | 0.092 | 0.061 - 0.122 | 0.058 | Humor, religion, self-blame, self-distraction, substance use |
| Four-factor model Nahlen and Saboonchi [21] | 91.67* | 49 | 0.911 | 0.069 | 0.049 - 0.091 | 0.063 | Self-blame, self-distraction |
| Modified four-factor model Nahlen and Saboonchia [21] | 70.43* | 47 | 0.951 | 0.052 | 0.024 - 0.076 | 0.060 | Self-blame, self-distraction |
| Problem focused coping (two subscales) | Avoidant coping (three subscales) | Socially supported coping (three subscales) | Emotion focused coping (four subscales) | |
|---|---|---|---|---|
| Theoretical range | 4 - 16 | 6 - 24 | 6 - 24 | 8 - 32 |
| Man | 10.7 ± 2.8 | 8.6 ± 2.5 | 12.9 ± 3.6 | 17.7 ± 4.4 |
| Woman | 9.8 ± 3.2 | 9.6 ± 3.1 | 12.5 ± 3.9 | 15.4 ± 3.5 |
| Age < 71 | 10.9 ± 2.9 | 9.4 ± 2.8 | 13.4 ± 3.8 | 17.3 ± 4.2 |
| Age ≥ 71 | 9.4 ± 3.0 | 8.2 ± 2.4 | 12.1 ± 3.5 | 16.7 ± 4.3 |
| Total sample | 10.5 ± 2.9 | 8.9 ± 2.7 | 12.8 ± 3.7 | 17.1 ± 4.3 |
| Standardized beta | t | R2 | |
|---|---|---|---|
| n = 103. *P < 0.01, **P < 0.001. aNYHA class: New York Heart Association Class. bDuration of Chronic Heart Failure. | |||
| Dependent variable: physical health composite RAND 36 | |||
| Model 1 | 0.18 | ||
| Age | 0.31 | 3.06* | |
| NYHA classa (NYHA III vs. NYHA II) | -0.30 | -2.87* | |
| Duration of CHFb (≥ 6 months vs. < 6 months) | 0.11 | 1.10 | |
| F(3) = 6.05, P = 0.001 | |||
| Model 2 | 0.26 | ||
| Age | 0.19 | 1.78 | |
| NYHA class (NYHA III vs. NYHA II) | -0.31 | -3.07* | |
| Problem focused coping | 0.01 | 0.10 | |
| Avoidant coping | -0.30 | -2.79* | |
| Socially supported coping | -0.10 | -0.92 | |
| Emotion focused coping | -0.04 | -0.31 | |
| F(6) = 4.61, P < 0.001 | |||
| Dependent variable: mental health composite RAND 36 | |||
| Model 1 | 0.17 | ||
| Age | 0.33 | 3.27* | |
| NYHA class (NYHA III vs. NYHA II) | -0.29 | -2.83* | |
| Duration of CHF (≥ 6 months vs. < 6 months) | -0.01 | -0.12 | |
| F(3) = 5.50, P = 0.002 | |||
| Model 2 | 0.40 | ||
| Age | 0.13 | 1.46 | |
| NYHA class (NYHA III vs. NYHA II) | -0.26 | -3.04* | |
| Problem focused coping | -0.01 | -0.14 | |
| Avoidant coping | -0.57 | -6.31** | |
| Socially supported coping | -0.07 | -0.75 | |
| Emotion focused coping | -0.02 | -0.16 | |
| F(6) = 11.36, P < 0.001 | |||